Estimated zip code population in 2022: 56,580 Zip code population in 2010: 55,416 Zip code population in 2000: 51,545
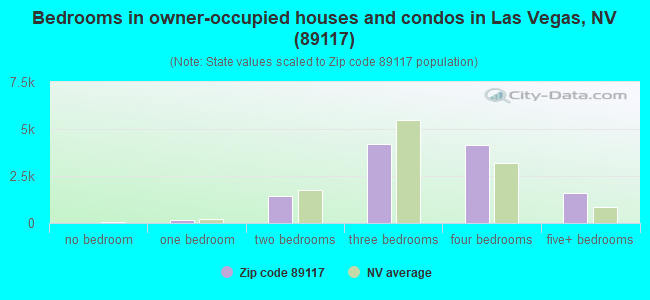
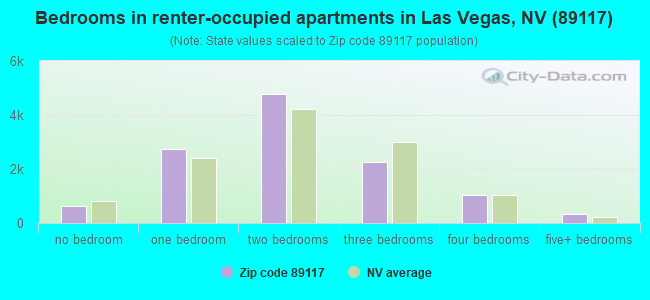
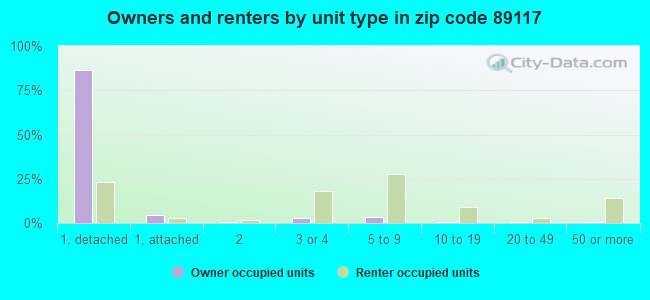
Houses and condos: 26,421 Renter-occupied apartments: 11,749
% of renters here:
50%
State:
40%
March 2022 cost of living index in zip code 89117: 101.0 (near average, U.S. average is 100)
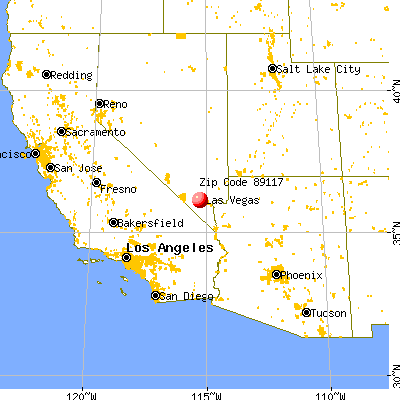
Land area: 9.1 sq. mi. Water area: 0.0 sq. mi.
Population density: 6,203 people per square mile
(high).
OSM Map
General Map
Google Map
MSN Map
OSM Map
General Map
Google Map
MSN Map
OSM Map
General Map
Google Map
MSN Map
OSM Map
General Map
Google Map
MSN Map
Please wait while loading the map...
Real estate property taxes paid for housing units in 2022:
This zip code:
0.5% ($2,435)
Nevada:
0.4% ($1,889)
Median real estate property taxes paid for housing units with mortgages in 2022: $2,405 (0.5%) Median real estate property taxes paid for housing units with no mortgage in 2022: $2,491 (0.5%)
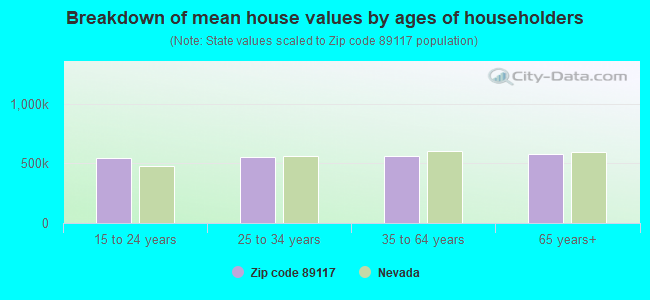
Estimated median house/condo value in 2022: $515,174
89117:
$515,174
Nevada:
$434,700
According to our research of Nevada and other state lists, there were 84 registered sex offenders living in 89117 zip code as of April 27, 2024. The ratio of all residents to sex offenders in zip code 89117 is 646 to 1. The ratio of registered sex offenders to all residents in this zip code is lower than the state average.
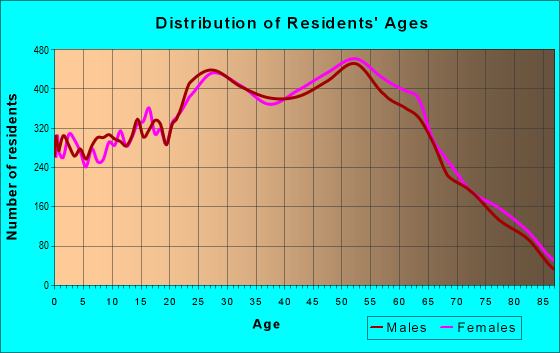
Median resident age:
This zip code:
42.7 years
Nevada median age:
39.0 years
Average household size:
This zip code:
2.4 people
Nevada:
2.6 people
Averages for the 2020 tax year for zip code 89117, filed in 2021:
Average Adjusted Gross Income (AGI) in 2020: $91,646 (Individual Income Tax Returns)
Here:
$91,646
State:
$78,964
Salary/wage: $55,169 (reported on 78.0% of returns)
Here:
$55,169
State:
$54,472
(% of AGI for various income ranges: 1106.8% for AGIs below $25k, 3369.1% for AGIs $25k-50k, 6397.9% for AGIs $50k-75k, 9373.0% for AGIs $75k-100k, 17456.9% for AGIs $100k-200k, 101135.8% for AGIs over 200k)
Taxable interest for individuals: $6,015 (reported on 25.3% of returns)
This zip code:
$6,015
Nevada:
$3,521
(% of AGI for various income ranges: 16.7% for AGIs below $25k, 22.5% for AGIs $25k-50k, 49.3% for AGIs $50k-75k, 90.4% for AGIs $75k-100k, 215.6% for AGIs $100k-200k, 9541.1% for AGIs over 200k)
Ordinary dividends: $22,155 (reported on 17.1% of returns)
Here:
$22,155
State:
$13,390
(% of AGI for various income ranges: 22.1% for AGIs below $25k, 32.5% for AGIs $25k-50k, 92.5% for AGIs $50k-75k, 205.2% for AGIs $75k-100k, 621.0% for AGIs $100k-200k, 24473.9% for AGIs over 200k)
Net capital gain/loss in AGI: +$72,813 (reported on 18.7% of returns)
Here:
+$72,813
State:
+$63,025
(% of AGI for various income ranges: 10.3% for AGIs below $25k, 32.7% for AGIs $25k-50k, 111.8% for AGIs $50k-75k, 317.0% for AGIs $75k-100k, 1126.2% for AGIs $100k-200k, 98726.1% for AGIs over 200k)
Profit/loss from business: +$13,166 (reported on 20.4% of returns)
Here:
+$13,166
State:
+$11,500
(% of AGI for various income ranges: 130.7% for AGIs below $25k, 170.1% for AGIs $25k-50k, 281.5% for AGIs $50k-75k, 411.8% for AGIs $75k-100k, 953.4% for AGIs $100k-200k, 7984.5% for AGIs over 200k)
Taxable individual retirement arrangement distribution: $26,540 (reported on 6.6% of returns)
89117:
$26,540
Nevada:
$23,628
(% of AGI for various income ranges: 40.9% for AGIs below $25k, 55.3% for AGIs $25k-50k, 161.4% for AGIs $50k-75k, 345.5% for AGIs $75k-100k, 913.3% for AGIs $100k-200k, 5575.3% for AGIs over 200k)
Self-employed (Keogh) retirement plans: $22,494 (reported on 0.5% of returns)
89117:
$22,494
Nevada:
$26,634
(% of AGI for various income ranges: 8.5% for AGIs $50k-75k, 48.7% for AGIs $100k-200k, 675.0% for AGIs over 200k)
Total itemized deductions: $55,569 (reported on 9.8% of returns)
Here:
$55,569
State:
$44,173
(% of AGI for various income ranges: 53.8% for AGIs below $25k, 150.5% for AGIs $25k-50k, 441.2% for AGIs $50k-75k, 729.3% for AGIs $75k-100k, 1669.3% for AGIs $100k-200k, 25832.1% for AGIs over 200k)
Charity contributions: $17,629 (reported on 8.0% of returns)
Here:
$17,629
State:
$12,589
(% of AGI for various income ranges: 3.4% for AGIs below $25k, 18.2% for AGIs $25k-50k, 62.4% for AGIs $50k-75k, 99.9% for AGIs $75k-100k, 287.3% for AGIs $100k-200k, 8548.7% for AGIs over 200k)
Taxes paid: $6,154 (reported on 9.6% of returns)
89117:
$6,154
State:
$6,112
(% of AGI for various income ranges: 7.4% for AGIs below $25k, 25.3% for AGIs $25k-50k, 72.4% for AGIs $50k-75k, 124.9% for AGIs $75k-100k, 286.3% for AGIs $100k-200k, 1816.3% for AGIs over 200k)
Earned income credit: $1,935 (reported on 15.9% of returns)
Here:
$1,935
State:
$2,214
(% of AGI for various income ranges: 79.8% for AGIs below $25k, 57.7% for AGIs $25k-50k, 0.8% for AGIs $50k-75k)
Percentage of individuals using paid preparers for their 2020 taxes: 92.0%
Here:
92%
State:
93%
(% for various income ranges: 91.1% for AGIs below $25k, 92.6% for AGIs $25k-50k, 92.5% for AGIs $50k-75k, 91.8% for AGIs $75k-100k, 91.8% for AGIs $100k-200k, 93.1% for AGIs over 200k)
Averages for the 2012 tax year for zip code 89117, filed in 2013:
Average Adjusted Gross Income (AGI) in 2012: $72,523 (Individual Income Tax Returns)
Here:
$72,523
State:
$61,164
Salary/wage: $52,572 (reported on 81.2% of returns)
Here:
$52,572
State:
$45,924
(% of AGI for various income ranges: 73.6% for AGIs below $25k, 81.6% for AGIs $25k-50k, 77.1% for AGIs $50k-75k, 73.1% for AGIs $75k-100k, 66.3% for AGIs $100k-200k, 37.1% for AGIs over 200k)
Taxable interest for individuals: $4,544 (reported on 27.3% of returns)
This zip code:
$4,544
Nevada:
$3,137
(% of AGI for various income ranges: 1.1% for AGIs below $25k, 0.7% for AGIs $25k-50k, 0.9% for AGIs $50k-75k, 0.7% for AGIs $75k-100k, 1.5% for AGIs $100k-200k, 2.7% for AGIs over 200k)
Ordinary dividends: $11,795 (reported on 17.4% of returns)
Here:
$11,795
State:
$11,762
(% of AGI for various income ranges: 2.7% for AGIs below $25k, 1.4% for AGIs $25k-50k, 1.2% for AGIs $50k-75k, 1.6% for AGIs $75k-100k, 3.2% for AGIs $100k-200k, 4.0% for AGIs over 200k)
Net capital gain/loss in AGI: +$31,598 (reported on 16.2% of returns)
Here:
+$31,598
State:
+$33,127
(% of AGI for various income ranges: 0.5% for AGIs $50k-75k, 0.6% for AGIs $75k-100k, 1.7% for AGIs $100k-200k, 16.4% for AGIs over 200k)
Profit/loss from business: +$15,724 (reported on 16.2% of returns)
Here:
+$15,724
State:
+$12,567
(% of AGI for various income ranges: 8.6% for AGIs below $25k, 3.4% for AGIs $25k-50k, 2.4% for AGIs $50k-75k, 3.0% for AGIs $75k-100k, 2.5% for AGIs $100k-200k, 3.6% for AGIs over 200k)
Taxable individual retirement arrangement distribution: $25,207 (reported on 7.8% of returns)
89117:
$25,207
Nevada:
$20,808
(% of AGI for various income ranges: 2.4% for AGIs below $25k, 1.5% for AGIs $25k-50k, 2.0% for AGIs $50k-75k, 2.8% for AGIs $75k-100k, 3.9% for AGIs $100k-200k, 2.9% for AGIs over 200k)
Self-employment retirement plans: $20,114 (reported on 0.5% of returns)
89117:
$20,114
Nevada:
$22,197
(% of AGI for various income ranges: 0.2% for AGIs $50k-75k, 0.2% for AGIs $100k-200k, 0.2% for AGIs over 200k)
Total itemized deductions: $35,864 (23% of AGI, reported on 30.8% of returns)
Here:
$35,864
State:
$26,148
Here:
23.5% of AGI
State:
20.0% of AGI
(% of AGI for various income ranges: 10.6% for AGIs below $25k, 10.8% for AGIs $25k-50k, 14.0% for AGIs $50k-75k, 14.5% for AGIs $75k-100k, 14.9% for AGIs $100k-200k, 18.1% for AGIs over 200k)
Charity contributions: $5,289 (reported on 25.6% of returns)
Here:
$5,289
State:
$4,329
(% of AGI for various income ranges: 0.6% for AGIs below $25k, 1.1% for AGIs $25k-50k, 1.6% for AGIs $50k-75k, 1.7% for AGIs $75k-100k, 2.0% for AGIs $100k-200k, 2.4% for AGIs over 200k)
Taxes paid: $6,016 (reported on 30.3% of returns)
89117:
$6,016
State:
$5,116
(% of AGI for various income ranges: 1.8% for AGIs below $25k, 2.0% for AGIs $25k-50k, 2.5% for AGIs $50k-75k, 2.6% for AGIs $75k-100k, 3.1% for AGIs $100k-200k, 2.5% for AGIs over 200k)
Earned income credit: $1,997 (reported on 15.9% of returns)
Here:
$1,997
State:
$2,279
(% of AGI for various income ranges: 5.0% for AGIs below $25k, 0.8% for AGIs $25k-50k)
Percentage of individuals using paid preparers for their 2012 taxes: 55.1%
Here:
55%
State:
55%
(% for various income ranges: 49.9% for AGIs below $25k, 52.4% for AGIs $25k-50k, 55.5% for AGIs $50k-75k, 60.2% for AGIs $75k-100k, 65.8% for AGIs $100k-200k, 80.5% for AGIs over 200k)
Averages for the 2004 tax year for zip code 89117, filed in 2005:
Average Adjusted Gross Income (AGI) in 2004: $79,913 (Individual Income Tax Returns)
Here:
$79,913
State:
$58,367
Salary/wage: $53,097 (reported on 83.7% of returns)
Here:
$53,097
State:
$42,695
(% of AGI for various income ranges: 81.0% for AGIs $10k-25k, 82.9% for AGIs $25k-50k, 77.1% for AGIs $50k-75k, 75.2% for AGIs $75k-100k, 40.6% for AGIs over 100k)
Taxable interest for individuals: $5,514 (reported on 40.1% of returns)
This zip code:
$5,514
Nevada:
$3,867
(% of AGI for various income ranges: 2.0% for AGIs $10k-25k, 1.4% for AGIs $25k-50k, 1.8% for AGIs $50k-75k, 2.0% for AGIs $75k-100k, 3.1% for AGIs over 100k)
Taxable dividends: $5,409 (reported on 22.0% of returns)
Here:
$5,409
State:
$5,770
(% of AGI for various income ranges: 1.1% for AGIs $10k-25k, 0.9% for AGIs $25k-50k, 0.9% for AGIs $50k-75k, 0.9% for AGIs $75k-100k, 1.7% for AGIs over 100k)
Net capital gain/loss: +$60,840 (reported on 21.7% of returns)
Here:
+$60,840
State:
+$50,644
(% of AGI for various income ranges: 0.1% for AGIs $10k-25k, 0.7% for AGIs $25k-50k, 1.6% for AGIs $50k-75k, 2.7% for AGIs $75k-100k, 24.4% for AGIs over 100k)
Profit/loss from business: +$17,742 (reported on 15.7% of returns)
Here:
+$17,742
State:
+$13,618
(% of AGI for various income ranges: 5.1% for AGIs $10k-25k, 3.1% for AGIs $25k-50k, 3.6% for AGIs $50k-75k, 3.5% for AGIs $75k-100k, 3.4% for AGIs over 100k)
IRA payment deduction: $3,409 (reported on 2.9% of returns)
89117:
$3,409
Nevada:
$3,054
(% of AGI for various income ranges: 0.2% for AGIs $10k-25k, 0.2% for AGIs $25k-50k, 0.2% for AGIs $50k-75k, 0.2% for AGIs $75k-100k, 0.1% for AGIs over 100k)
Self-employed pension: $19,500 (reported on 1.0% of returns)
Here:
$19,500
Nevada:
$16,706
(% of AGI for various income ranges: 0.1% for AGIs $10k-25k, 0.1% for AGIs $25k-50k, 0.2% for AGIs $50k-75k, 0.1% for AGIs $75k-100k, 0.3% for AGIs over 100k)
Total itemized deductions: $28,948 (20% of AGI, reported on 40.0% of returns)
Here:
$28,948
State:
$22,990
Here:
19.8% of AGI
State:
21.8% of AGI
(% of AGI for various income ranges: 13.6% for AGIs $10k-25k, 15.1% for AGIs $25k-50k, 18.6% for AGIs $50k-75k, 20.0% for AGIs $75k-100k, 12.6% for AGIs over 100k)
Charity contributions deductions: $4,651 (3% of AGI, reported on 35.2% of returns)
Here:
$4,651
State:
$3,443
Here:
3.0% of AGI
State:
3.1% of AGI
(% of AGI for various income ranges: 1.1% for AGIs $10k-25k, 1.4% for AGIs $25k-50k, 2.0% for AGIs $50k-75k, 2.2% for AGIs $75k-100k, 2.2% for AGIs over 100k)
Total tax: $16,848 (reported on 80.9% of returns)
89117:
$16,848
State:
$10,585
(% of AGI for various income ranges: 4.7% for AGIs $10k-25k, 7.6% for AGIs $25k-50k, 9.8% for AGIs $50k-75k, 11.2% for AGIs $75k-100k, 21.3% for AGIs over 100k)
Earned income credit: $1,491 (reported on 10.5% of returns)
Here:
$1,491
State:
$1,676
Percentage of individuals using paid preparers for their 2004 taxes: 59.1%
Here:
59%
State:
60%
(% for various income ranges: 54.2% for AGIs below $10k, 55.6% for AGIs $10k-25k, 54.9% for AGIs $25k-50k, 60.6% for AGIs $50k-75k, 63.2% for AGIs $75k-100k, 74.1% for AGIs over 100k)
Likely homosexual households (counted as self-reported same-sex unmarried-partner households)
Lesbian couples: 0.1% of all households
Gay men: 0.4% of all households
Household received Food Stamps/SNAP in the past 12 months: 2,282 Household did not receive Food Stamps/SNAP in the past 12 months: 21,106
Women who had a birth in the past 12 months: 337 (223 now married, 109 unmarried) Women who did not have a birth in the past 12 months: 12,963 (5,102 now married, 7,865 unmarried)
Housing units in zip code 89117 with a mortgage: 7,228 (312 second mortgage, 309 both second mortgage and home equity loan) Houses without a mortgage: 116
Median monthly owner costs for units with a mortgage: $1,852 Median monthly owner costs for units without a mortgage: $577
Residents with income below the poverty level in 2022:
This zip code:
12.3%
Whole state:
12.5%
Residents with income below 50% of the poverty level in 2022:
This zip code:
5.3%
Whole state:
5.9%
Median number of rooms in houses and condos:
Here:
6.6
State:
6.0
Median number of rooms in apartments:
Here:
4.1
State:
4.2
Notable locations in this zip code not listed on our city pages
Notable locations in zip code 89117: Lakeside Village Plaza (A), Las Vegas Fire and Rescue Station 2 (B), Sahara West Library and Fine Arts Museum (C). Display/hide their locations on the map
Churches in zip code 89117 include: Unity Church of the Desert (A), Saint Joseph Husband of Mary Catholic Church (B), The Church of Jesus Christ of Latter Day Saints (C), Spring Valley Baptist Church (D), Bahai Faith of Clark (E), Bahai Faith (F). Display/hide their locations on the map
5,043 married couples with children.
2,788 single-parent households (918 men, 1,870 women).
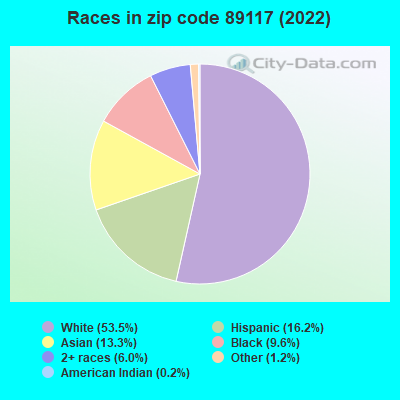
71.1% of residents of 89117 zip code speak English at home.
10.4% of residents speak Spanish at home (73% very well, 18% well, 9% not well).
6.4% of residents speak other Indo-European language at home (65% very well, 25% well, 9% not well, 1% not at all).
10.1% of residents speak Asian or Pacific Island language at home (64% very well, 21% well, 14% not well, 1% not at all).
1.7% of residents speak other language at home (88% very well, 11% well, 1% not well).
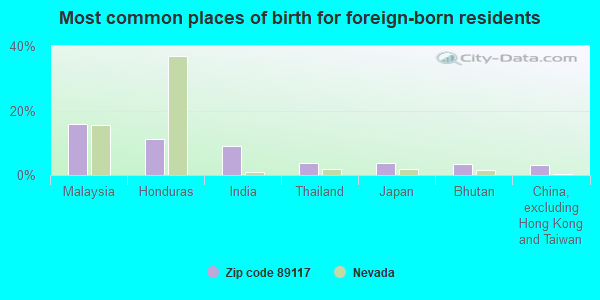
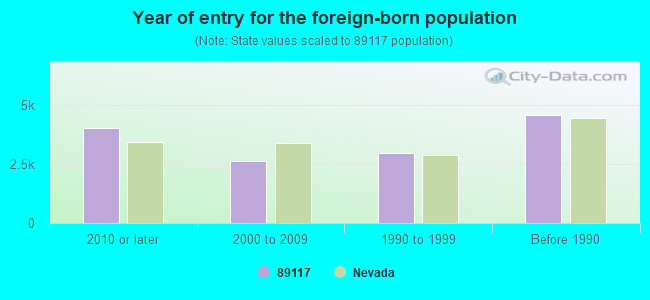
Foreign born population: 12,846 (22.7%) (66.1% of them are naturalized citizens)
Major facilities with environmental interests located in this zip code:
HERBERT A DERFELT ELEMENTARY SCHOOL (1900 S LISA LANE in LAS VEGAS, NV)
(Geographic Names Information System) (National Center for Education Statistics) - STATE ID-02-124 Organizations: CLARK CO SCH DIST (SCHOOL DISTRICT)
Alternative names: DERFELT, HERBERT ELEM
M J CHRISTENSEN ELEMENTARY SCHOOL (9001 MARINER COVE in LAS VEGAS, NV)
(Geographic Names Information System) (National Center for Education Statistics) - STATE ID-02-109 Organizations: CLARK CO SCH DIST (SCHOOL DISTRICT)
BENDORF, PATRICIA ELEM (3550 KEVIN STREET in LAS VEGAS, NV)
(National Center for Education Statistics) - STATE ID-02-138 Organizations: CLARK CO SCH DIST (SCHOOL DISTRICT)
BRYAN, ROGER ELEM (8255 KATIE AVENUE in LAS VEGAS, NV)
(National Center for Education Statistics) - STATE ID-02-156 Organizations: CLARK CO SCH DIST (SCHOOL DISTRICT)
LAWRENCE MIDSCH (4410 S. JULIANO STREET in LAS VEGAS, NV)
(National Center for Education Statistics) - STATE ID-02-337 Organizations: CLARK CO SCH DIST (SCHOOL DISTRICT)
PIGGOTT, CLARENCE ELEM (9601 RED HILLS DRIVE in LAS VEGAS, NV)
(National Center for Education Statistics) - STATE ID-02-145 Organizations: CLARK CO SCH DIST (SCHOOL DISTRICT)
LAKES CLEANERS (8657 W SAHARA in LAS VEGAS, NV)
Conditionally Exempt Small Quantity Generators, less than 100 kg/month of hazardous waste (Resource Conservation and Recovery Act (tracking hazardous waste)) - notification HAZARDOUS WASTE BIENNIAL REPORTER (Resource Conservation and Recovery Act (tracking hazardous waste)) Organizations: DOUGLAS B RATHER (CONTACT/OWNER)
, DOUGLAS B RATHER/LAKES CLEANERS (CONTACT/OWNER)
CHARLIE BROWN CONSTRUCTION CO (8000 W FLAMINGO RD in LAS VEGAS, NV)
(Resource Conservation and Recovery Act (tracking hazardous waste)) Organizations: CHARLES BROWN (CONTACT/OWNER)
ECONO LUBE N TUNE NO 146 (4897 S RAINBOW BLVD in LAS VEGAS, NV)
(Resource Conservation and Recovery Act (tracking hazardous waste)) Organizations: FRED FASTER (CONTACT/OWNER)
HOME DEPOT USA INC HD3315 (9705 W CHARLESTON BLVD in LAS VEGAS, NV)
Small Quantity Generators, between 100 kg and 1000 kg of hazardous waste/month (Resource Conservation and Recovery Act (tracking hazardous waste)) Organizations: HOME DEPOT 3315 (CONTACT/OPERATOR)
Alternative names: HOME DEPOT 3315
MASTER TUXEDO (8221 W CHARLESTON BLVD STE 103 in LAS VEGAS, NV)
Small Quantity Generators, between 100 kg and 1000 kg of hazardous waste/month (Resource Conservation and Recovery Act (tracking hazardous waste)) Organizations: KEN KRAINOCK (CONTACT/OPERATOR)
, AGAPE DRY CLEANERS (CONTACT/OWNER)
, MASTERS TUXEDO OF NEVADA (CONTACT/OWNER)
PARNELLI JONES TIRES (6809 W CHARLESTON AVE in LAS VEGAS, NV)
(Resource Conservation and Recovery Act (tracking hazardous waste)) Organizations: PARNELLI JONES INC (CONTACT/OWNER)
PURRFECT AUTO SERVICE 12 (7786 W SAHARA in LAS VEGAS, NV)
(Resource Conservation and Recovery Act (tracking hazardous waste)) Organizations: AUTO INVESTMENT INC (CONTACT/OWNER)
Housing units lacking complete plumbing facilities: 0.6% Housing units lacking complete kitchen facilities: 2.0%
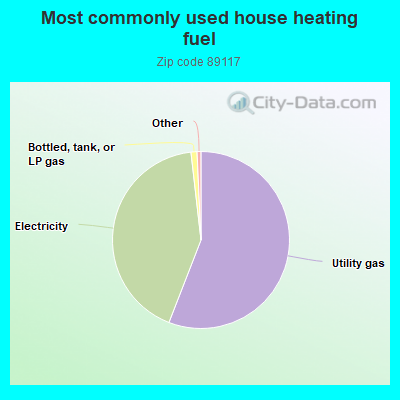
55.9%Utility gas
42.3%Electricity
1.1%Bottled, tank, or LP gas
Population in 1990: 30,271. Population change in the 1990s: +21,274 (+70.3%).
Place of birth for U.S.-born residents:
This state: 11,855
Northeast: 5,588
Midwest: 5,993
South: 3,824
West: 15,133
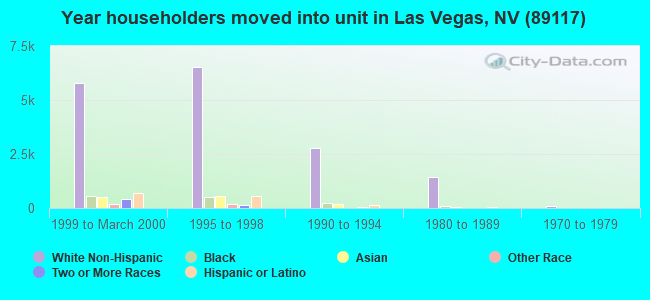
34% of the 89117 zip code residents lived in the same house 5 years ago. Out of people who lived in different houses, 47% lived in this county. Out of people who lived in different counties, 50% lived in Nevada.
88% of the 89117 zip code residents lived in the same house 1 year ago. Out of people who lived in different houses, 67% moved from this county. Out of people who lived in different houses, 1% moved from different county within same state. Out of people who lived in different houses, 30% moved from different state. Out of people who lived in different houses, 3% moved from abroad.
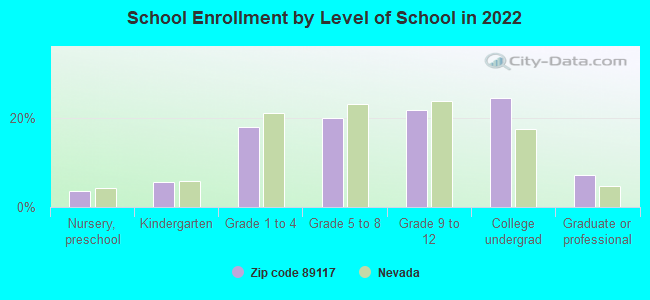
Private vs. public school enrollment:
Students in private schools in grades 1 to 8 (elementary and middle school): 860
Here:
21.7%
Nevada:
12.9%
Students in private schools in grades 9 to 12 (high school): 284
Here:
12.8%
Nevada:
6.9%
Students in private undergraduate colleges: 378
Here:
15.2%
Nevada:
16.0%
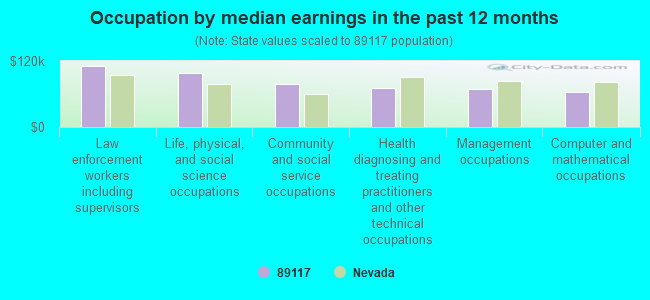
Occupation by median earnings in the past 12 months ($)
111,608Law enforcement workers including supervisors
98,507Life, physical, and social science occupations
78,081Community and social service occupations
70,076Health diagnosing and treating practitioners and other technical occupations
69,620Management occupations
63,178Computer and mathematical occupations
Companies with federal contracts located in this zip code (LAS VEGAS, NV):
STRUCTURE GENERAL INC (7801 WASATCH MAPLE AVE; small business) : $7,613,648 in 81 contractsfrom 1999 to 2002
Contracts for Construction of Structures and Facilities -- Other Administrative Facilities and Service Buildings, Maintenance, Repair or Alteration of Real Property -- Office Buildings, Construction of Structures and Facilities -- Restoration of real property, Construction of Structures and Facilities -- Other Airfield Structures by Army Signed by year:2000: $1,721,058; 2001: $738,190; 2002: $24,492; 2003: $0; 2004: $0; 2005: $0; 2006: $0.
Biggest contracts:
$5,105,834 with Army for Construction of Structures and Facilities -- Other Administrative Facilities and Service Buildings. Taking place in WA. Signed on 1999-12-23. Completion date: 2001-06-23.
$891,965, same as above.Signed on 2000-05-12. Completion date: 2001-06-23.
$256,519, same as above.Signed on 2000-11-30. Completion date: 2002-09-30.
$229,984 with Army for Maintenance, Repair or Alteration of Real Property -- Office Buildings. Taking place in WA. Signed on 2000-09-25. Completion date: 2001-09-30.
NIGHTINGALE PROMOTIONAL, INC (10020 HARPOON CIRCLE; small business) : $90,600 in 3 contractsfrom 2003 to 2004
$48,000 with Defense Logistics Agency for Bottles and Jars. Taking place in CA. Signed on 2004-04-08. Completion date: 2004-05-24.
$25,200, same as above.Signed on 2003-12-05. Completion date: 2004-02-03.
$17,400 with Army for Badges and Insignia. Taking place in MO. Signed on 2004-10-04. Completion date: 2005-09-30.
RESOLUTION MANAGEMENT CONSULTA (7530 WEST SAHARA AVENUE; small business)
$34,825 with Air Force for Architect - Engineer Services (including landscaping, interior layout, and designing). Taking place in NM. Signed on 2001-07-06. Completion date: 2001-09-21.
PROFESSIONAL MEDICAL TRANSCRIB (8635 W SAHARA AVE , SUITE; small business) : $32,434 in 2 contractsfrom 2001 to 2006
$34,960 with Air Force for Transcription Services. Signed on 2001-05-17. Completion date: 2001-09-30.
-$2,526, same as above.Signed on 2006-02-15. Completion date: 2001-09-30.
SMART CONNECT, INC (7472 W SAHARA BLVD STE 100; small business)
$19,745 with Army for ADP Components. Signed on 2002-09-25. Completion date: 2002-10-26.
SCOPECARE LTD (9909 GARAMOUND AVE; small business) : $15,317 in 2 contractsfrom 2004 to 2005
$10,525 with Air Force for Maintenance, Repair and Rebuilding of Equipment -- Medical, Dental, and Veterinary Equipment and Supplies. Signed on 2004-12-14. Completion date: 2004-12-31.
$4,792, same as above.Signed on 2005-09-17. Completion date: 2005-09-26.
WILBUR, CORY (6985 W SAHARA AVE STE 117; small business)
$11,850 with Air Force for Athletic and Sporting Equipment. Signed on 2005-09-14. Completion date: 2005-11-04.
N & N TRAVEL AND TOURS INC (3240 RED SCOTT CIRCLE; small business) : $8,770 in 3 contractsfrom 2003 to 2005
$15,170 with Air Force for Travel Agent Services. Taking place in UT. Signed on 2005-04-07. Completion date: 2005-10-31.
$8,770 with Army for Travel Agent Services. Signed on 2003-09-26. Completion date: 2003-09-26.
-$15,170 with Air Force for Travel Agent Services. Taking place in UT. Signed on 2005-09-29. Completion date: 2005-10-31.
MANPOWER, INC OF SOUTHERN NEV (8170 W SAHARA AVENUE #20) : $3,990 in 2 contractsin 2004
$3,990 with Army for Other Management Support Services. Signed on 2004-02-19. Completion date: 2003-05-18.
$0, same as above.Signed on 2004-02-19. Completion date: 2003-05-18.
PATFIELD, CARL (3216 CENTAVO DRIVE; small business) : $0 in 2 contractsin 2002
$6,900 with Army for Vocational/Technical. Taking place in OR. Signed on 2002-09-27. Completion date: 2002-10-31.
-$6,900, same as above.Signed on 2002-10-30. Completion date: 2002-10-31.
Top industries in this zip code by the number of employees in 2005:
2002 - 2018 National Fire Incident Reporting System (NFIRS) incidents
According to the data from the years 2002 - 2018 the average number of fires per year is 114. The highest number of fires - 188 took place in 2007, and the least - 0 in 2003. The data has a growing trend.
When looking into fire subcategories, the most reports belonged to: Structure Fires (35.5%), and Outside Fires (33.6%).
Fire incident types reported to NFIRS in Zip Code 89117


 Nearest zip codes: 89145, 89147, 89146, 89144, 89128, 89148.
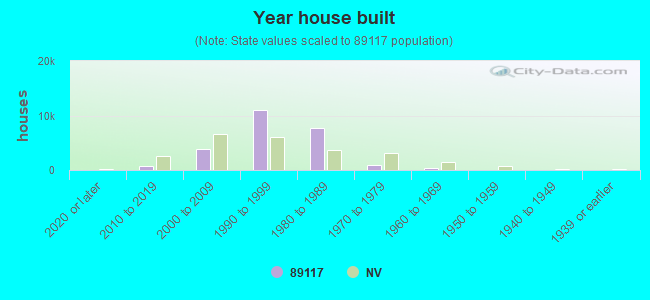


 According to the data from the years 2002 - 2018 the average number of fires per year is 114. The highest number of fires - 188 took place in 2007, and the least - 0 in 2003. The data has a growing trend.
 When looking into fire subcategories, the most reports belonged to: Structure Fires (35.5%), and Outside Fires (33.6%).