Estimated zip code population in 2022: 26,182 Zip code population in 2010: 25,759 Zip code population in 2000: 25,563
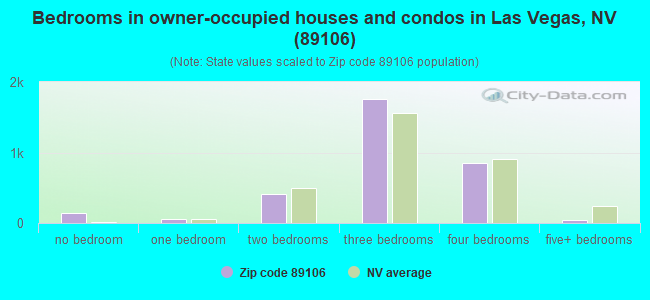
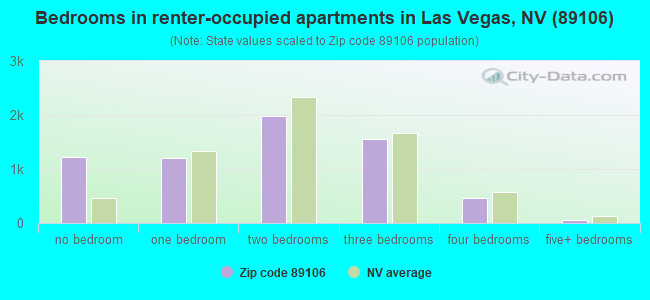
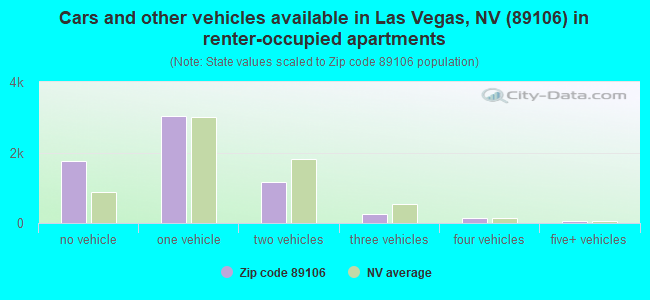
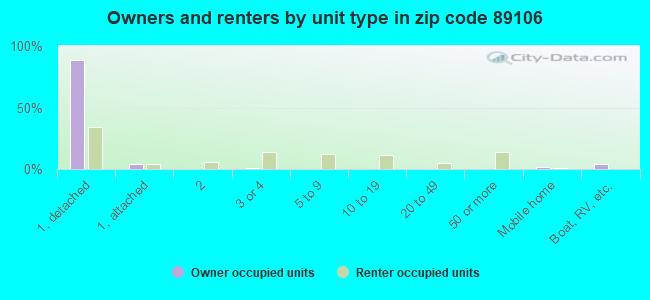
Houses and condos: 11,033 Renter-occupied apartments: 6,396
% of renters here:
66%
State:
40%
March 2022 cost of living index in zip code 89106: 99.8 (near average, U.S. average is 100)
Land area: 5.3 sq. mi. Water area: 0.0 sq. mi.
Population density: 4,949 people per square mile
(average).
OSM Map
General Map
Google Map
MSN Map
OSM Map
General Map
Google Map
MSN Map
OSM Map
General Map
Google Map
MSN Map
OSM Map
General Map
Google Map
MSN Map
Please wait while loading the map...
Real estate property taxes paid for housing units in 2022:
This zip code:
0.4% ($962)
Nevada:
0.4% ($1,889)
Median real estate property taxes paid for housing units with mortgages in 2022: $916 (0.3%) Median real estate property taxes paid for housing units with no mortgage in 2022: $1,075 (0.5%)
Averages for the 2020 tax year for zip code 89106, filed in 2021:
Average Adjusted Gross Income (AGI) in 2020: $35,286 (Individual Income Tax Returns)
Here:
$35,286
State:
$78,964
Salary/wage: $28,523 (reported on 84.2% of returns)
Here:
$28,523
State:
$54,472
(% of AGI for various income ranges: 1131.0% for AGIs below $25k, 3544.0% for AGIs $25k-50k, 6622.5% for AGIs $50k-75k, 9988.8% for AGIs $75k-100k, 13778.4% for AGIs $100k-200k)
Taxable interest for individuals: $1,223 (reported on 9.1% of returns)
This zip code:
$1,223
Nevada:
$3,521
(% of AGI for various income ranges: 3.3% for AGIs below $25k, 2.6% for AGIs $25k-50k, 7.7% for AGIs $50k-75k, 11.2% for AGIs $75k-100k, 71.1% for AGIs $100k-200k)
Ordinary dividends: $4,634 (reported on 3.2% of returns)
Here:
$4,634
State:
$13,390
(% of AGI for various income ranges: 4.4% for AGIs below $25k, 5.6% for AGIs $25k-50k, 6.0% for AGIs $50k-75k, 10.0% for AGIs $75k-100k, 169.5% for AGIs $100k-200k)
Net capital gain/loss in AGI: +$47,955 (reported on 3.9% of returns)
Here:
+$47,955
State:
+$63,025
(% of AGI for various income ranges: 0.2% for AGIs below $25k, 14.0% for AGIs $25k-50k, 15.5% for AGIs $50k-75k, 90.0% for AGIs $75k-100k, 662.1% for AGIs $100k-200k)
Profit/loss from business: +$5,246 (reported on 17.9% of returns)
Here:
+$5,246
State:
+$11,500
(% of AGI for various income ranges: 126.2% for AGIs below $25k, 53.7% for AGIs $25k-50k, 187.6% for AGIs $50k-75k, 243.8% for AGIs $75k-100k, 466.3% for AGIs $100k-200k)
Taxable individual retirement arrangement distribution: $11,121 (reported on 1.6% of returns)
89106:
$11,121
Nevada:
$23,628
(% of AGI for various income ranges: 5.1% for AGIs below $25k, 15.5% for AGIs $25k-50k, 87.0% for AGIs $50k-75k, 350.0% for AGIs $100k-200k)
Total itemized deductions: $34,776 (reported on 2.8% of returns)
Here:
$34,776
State:
$44,173
(% of AGI for various income ranges: 14.1% for AGIs below $25k, 76.9% for AGIs $25k-50k, 308.1% for AGIs $50k-75k, 513.1% for AGIs $75k-100k, 1213.7% for AGIs $100k-200k)
Charity contributions: $8,135 (reported on 2.2% of returns)
Here:
$8,135
State:
$12,589
(% of AGI for various income ranges: 15.4% for AGIs $25k-50k, 36.7% for AGIs $50k-75k, 120.0% for AGIs $75k-100k, 212.6% for AGIs $100k-200k)
Taxes paid: $4,352 (reported on 2.8% of returns)
89106:
$4,352
State:
$6,112
(% of AGI for various income ranges: 1.1% for AGIs below $25k, 12.3% for AGIs $25k-50k, 43.4% for AGIs $50k-75k, 73.1% for AGIs $75k-100k, 131.1% for AGIs $100k-200k)
Earned income credit: $2,603 (reported on 35.5% of returns)
Here:
$2,603
State:
$2,214
(% of AGI for various income ranges: 165.0% for AGIs below $25k, 101.3% for AGIs $25k-50k, 2.2% for AGIs $50k-75k)
Percentage of individuals using paid preparers for their 2020 taxes: 92.6%
Here:
93%
State:
93%
(% for various income ranges: 92.8% for AGIs below $25k, 92.9% for AGIs $25k-50k, 92.4% for AGIs $50k-75k, 90.0% for AGIs $75k-100k, 90.6% for AGIs $100k-200k, 87.5% for AGIs over 200k)
Averages for the 2012 tax year for zip code 89106, filed in 2013:
Average Adjusted Gross Income (AGI) in 2012: $28,785 (Individual Income Tax Returns)
Here:
$28,785
State:
$61,164
Salary/wage: $26,551 (reported on 82.6% of returns)
Here:
$26,551
State:
$45,924
(% of AGI for various income ranges: 73.4% for AGIs below $25k, 87.3% for AGIs $25k-50k, 79.0% for AGIs $50k-75k, 71.5% for AGIs $75k-100k, 64.4% for AGIs $100k-200k, 43.4% for AGIs over 200k)
Taxable interest for individuals: $1,200 (reported on 8.8% of returns)
This zip code:
$1,200
Nevada:
$3,137
(% of AGI for various income ranges: 0.2% for AGIs below $25k, 0.3% for AGIs $25k-50k, 0.3% for AGIs $50k-75k, 0.7% for AGIs $100k-200k, 1.0% for AGIs over 200k)
Ordinary dividends: $8,541 (reported on 3.9% of returns)
Here:
$8,541
State:
$11,762
(% of AGI for various income ranges: 2.1% for AGIs below $25k, 1.0% for AGIs $25k-50k, 0.7% for AGIs $50k-75k, 0.3% for AGIs $75k-100k, 0.3% for AGIs $100k-200k, 0.9% for AGIs over 200k)
Net capital gain/loss in AGI: +$3,238 (reported on 3.0% of returns)
Here:
+$3,238
State:
+$33,127
(% of AGI for various income ranges: 0.2% for AGIs below $25k, 0.3% for AGIs $50k-75k, 1.4% for AGIs $100k-200k, 2.0% for AGIs over 200k)
Profit/loss from business: +$8,246 (reported on 15.8% of returns)
Here:
+$8,246
State:
+$12,567
(% of AGI for various income ranges: 13.6% for AGIs below $25k, 0.8% for AGIs $25k-50k, 0.6% for AGIs $50k-75k, 1.9% for AGIs $75k-100k, 3.2% for AGIs $100k-200k)
Taxable individual retirement arrangement distribution: $10,875 (reported on 2.3% of returns)
89106:
$10,875
Nevada:
$20,808
(% of AGI for various income ranges: 0.5% for AGIs below $25k, 0.3% for AGIs $25k-50k, 1.1% for AGIs $50k-75k, 1.8% for AGIs $75k-100k, 4.5% for AGIs $100k-200k)
Total itemized deductions: $19,094 (30% of AGI, reported on 12.0% of returns)
Here:
$19,094
State:
$26,148
Here:
29.8% of AGI
State:
20.0% of AGI
(% of AGI for various income ranges: 4.3% for AGIs below $25k, 7.2% for AGIs $25k-50k, 9.7% for AGIs $50k-75k, 12.0% for AGIs $75k-100k, 15.0% for AGIs $100k-200k, 10.9% for AGIs over 200k)
Charity contributions: $3,260 (reported on 9.0% of returns)
Here:
$3,260
State:
$4,329
(% of AGI for various income ranges: 0.3% for AGIs below $25k, 1.0% for AGIs $25k-50k, 1.6% for AGIs $50k-75k, 1.8% for AGIs $75k-100k, 2.3% for AGIs $100k-200k, 0.8% for AGIs over 200k)
Taxes paid: $2,498 (reported on 11.4% of returns)
89106:
$2,498
State:
$5,116
(% of AGI for various income ranges: 0.4% for AGIs below $25k, 1.0% for AGIs $25k-50k, 1.2% for AGIs $50k-75k, 1.7% for AGIs $75k-100k, 2.0% for AGIs $100k-200k, 1.1% for AGIs over 200k)
Earned income credit: $2,776 (reported on 37.8% of returns)
Here:
$2,776
State:
$2,279
(% of AGI for various income ranges: 11.0% for AGIs below $25k, 1.8% for AGIs $25k-50k)
Percentage of individuals using paid preparers for their 2012 taxes: 58.9%
Here:
59%
State:
55%
(% for various income ranges: 58.2% for AGIs below $25k, 59.6% for AGIs $25k-50k, 57.7% for AGIs $50k-75k, 68.0% for AGIs $75k-100k, 66.7% for AGIs $100k-200k, 60.0% for AGIs over 200k)
Averages for the 2004 tax year for zip code 89106, filed in 2005:
Average Adjusted Gross Income (AGI) in 2004: $30,156 (Individual Income Tax Returns)
Here:
$30,156
State:
$58,367
Salary/wage: $26,430 (reported on 90.3% of returns)
Here:
$26,430
State:
$42,695
(% of AGI for various income ranges: 103.1% for AGIs below $10k, 89.4% for AGIs $10k-25k, 91.0% for AGIs $25k-50k, 83.0% for AGIs $50k-75k, 73.0% for AGIs $75k-100k, 37.6% for AGIs over 100k)
Taxable interest for individuals: $1,285 (reported on 14.0% of returns)
This zip code:
$1,285
Nevada:
$3,867
(% of AGI for various income ranges: 1.2% for AGIs below $10k, 0.3% for AGIs $10k-25k, 0.4% for AGIs $25k-50k, 0.5% for AGIs $50k-75k, 0.6% for AGIs $75k-100k, 1.3% for AGIs over 100k)
Taxable dividends: $4,364 (reported on 4.5% of returns)
Here:
$4,364
State:
$5,770
(% of AGI for various income ranges: 0.9% for AGIs below $10k, 0.2% for AGIs $10k-25k, 0.6% for AGIs $25k-50k, 0.9% for AGIs $50k-75k, 1.3% for AGIs $75k-100k, 0.8% for AGIs over 100k)
Net capital gain/loss: +$45,894 (reported on 4.0% of returns)
Here:
+$45,894
State:
+$50,644
(% of AGI for various income ranges: -0.1% for AGIs below $10k, 0.2% for AGIs $10k-25k, 0.2% for AGIs $25k-50k, 0.8% for AGIs $50k-75k, 3.1% for AGIs $75k-100k, 31.4% for AGIs over 100k)
Profit/loss from business: +$6,526 (reported on 7.0% of returns)
Here:
+$6,526
State:
+$13,618
(% of AGI for various income ranges: 6.2% for AGIs below $10k, 1.9% for AGIs $10k-25k, 0.3% for AGIs $25k-50k, -0.2% for AGIs $50k-75k, 2.3% for AGIs $75k-100k, 4.1% for AGIs over 100k)
IRA payment deduction: $2,305 (reported on 0.6% of returns)
89106:
$2,305
Nevada:
$3,054
Total itemized deductions: $16,353 (30% of AGI, reported on 21.9% of returns)
Here:
$16,353
State:
$22,990
Here:
29.9% of AGI
State:
21.8% of AGI
(% of AGI for various income ranges: 12.0% for AGIs below $10k, 7.8% for AGIs $10k-25k, 13.1% for AGIs $25k-50k, 16.6% for AGIs $50k-75k, 16.3% for AGIs $75k-100k, 8.2% for AGIs over 100k)
Charity contributions deductions: $2,476 (5% of AGI, reported on 17.9% of returns)
Here:
$2,476
State:
$3,443
Here:
4.5% of AGI
State:
3.1% of AGI
(% of AGI for various income ranges: 0.3% for AGIs below $10k, 0.6% for AGIs $10k-25k, 1.5% for AGIs $25k-50k, 2.3% for AGIs $50k-75k, 3.4% for AGIs $75k-100k, 1.1% for AGIs over 100k)
Total tax: $4,408 (reported on 54.7% of returns)
89106:
$4,408
State:
$10,585
(% of AGI for various income ranges: 2.0% for AGIs below $10k, 2.4% for AGIs $10k-25k, 4.9% for AGIs $25k-50k, 8.0% for AGIs $50k-75k, 10.9% for AGIs $75k-100k, 20.8% for AGIs over 100k)
Earned income credit: $1,946 (reported on 36.1% of returns)
Here:
$1,946
State:
$1,676
Percentage of individuals using paid preparers for their 2004 taxes: 70.8%
Here:
71%
State:
60%
(% for various income ranges: 68.6% for AGIs below $10k, 74.5% for AGIs $10k-25k, 68.2% for AGIs $25k-50k, 67.8% for AGIs $50k-75k, 74.6% for AGIs $75k-100k, 75.6% for AGIs over 100k)
Likely homosexual households (counted as self-reported same-sex unmarried-partner households)
Lesbian couples: 0.2% of all households
Gay men: 0.1% of all households
Household received Food Stamps/SNAP in the past 12 months: 3,350 Household did not receive Food Stamps/SNAP in the past 12 months: 6,798
Women who had a birth in the past 12 months: 554 (211 now married, 288 unmarried) Women who did not have a birth in the past 12 months: 5,751 (1,657 now married, 4,119 unmarried)
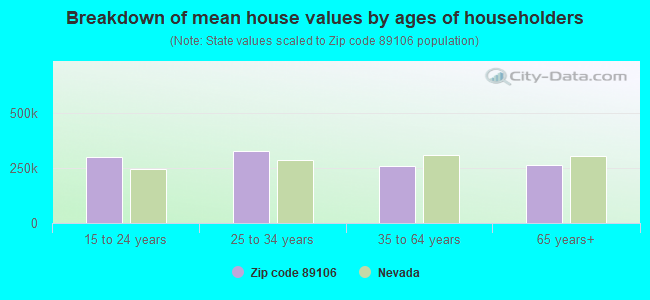
Housing units in zip code 89106 with a mortgage: 1,948 (159 second mortgage, 15 home equity loan, 106 both second mortgage and home equity loan) Houses without a mortgage: 38
Median monthly owner costs for units with a mortgage: $1,343 Median monthly owner costs for units without a mortgage: $402
Residents with income below the poverty level in 2022:
This zip code:
27.7%
Whole state:
12.5%
Residents with income below 50% of the poverty level in 2022:
This zip code:
14.1%
Whole state:
5.9%
Median number of rooms in houses and condos:
Here:
5.3
State:
6.0
Median number of rooms in apartments:
Here:
4.0
State:
4.2
Notable locations in this zip code not listed on our city pages
Notable locations in zip code 89106: Rancho Plaza (A), Rancho Center (B), Clark County Coroners Office (C), Las Vegas Fire and Rescue Station 3 (D), Pentecostal Temple Church of God in Christ Childrens Center (E), Reach Out Learning Center (F), Sherman Gardens Community Center (G), First Christian Child Development Center (H), Doolittle Community Center (I), Clark County Operations Center (J), Clark County Government Center (K), West Las Vegas Library (L), West Leisure Service Center (M). Display/hide their locations on the map
Shopping Centers: Golden West Shopping Center (1), Factory Outlet Mall of Las Vegas (2), Rancho Circle Shopping Center (3), Twin Lakes Shopping Center (4). Display/hide their locations on the map
Churches in zip code 89106 include: Victory Missionary Baptist Church (A), Second Baptist Church (B), Saint Johns Missionary Baptist Church (C), Saint James the Apostle Catholic Church (D), True Love Missionary Baptist Church (E), Trinity Church of God in Christ (F), The True Vine Missionary Baptist Church (G), Israelite Church of God in Christ (H), Holy Cross Baptist Church (I). Display/hide their locations on the map
Parks in zip code 89106 include: Booker Playground (1), Carson Playground (2), Doolittle Park (3), Doolittle Pool (4), Ethel Pearson Park (5), Fitzgeralds Tot Lot (6), Hoggard Playground (7), James Gay Park (8), Lubertha Johnson Park (9). Display/hide their locations on the map
Tourist attractions (not listed on the city page) : McNair Marketing Consultants (Tourism Consultants; 333 North Rancho Drive Suite 888), Southern Nevada Zoological Park (Cultural Attractions- Events- & Facilities; 1775 North Rancho Drive), Desert Eco-Tours (Cultural Attractions- Events- & Facilities; 1775 North Rancho Drive).
2,664 married couples with children.
2,914 single-parent households (804 men, 2,110 women).
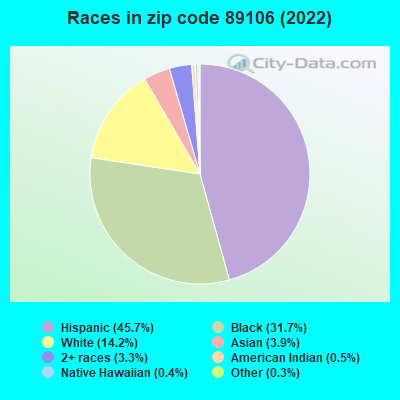
56.9% of residents of 89106 zip code speak English at home.
39.2% of residents speak Spanish at home (53% very well, 19% well, 16% not well, 12% not at all).
0.7% of residents speak other Indo-European language at home (96% very well, 4% well).
2.9% of residents speak Asian or Pacific Island language at home (57% very well, 35% well, 7% not well, 1% not at all).
0.2% of residents speak other language at home (87% very well, 13% well).
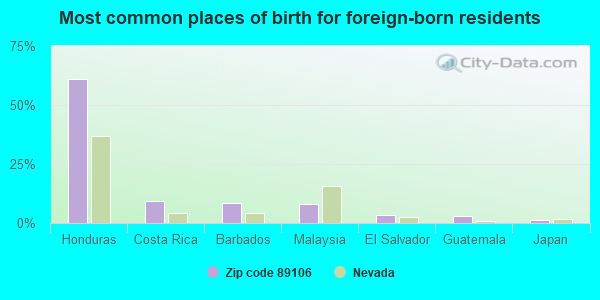
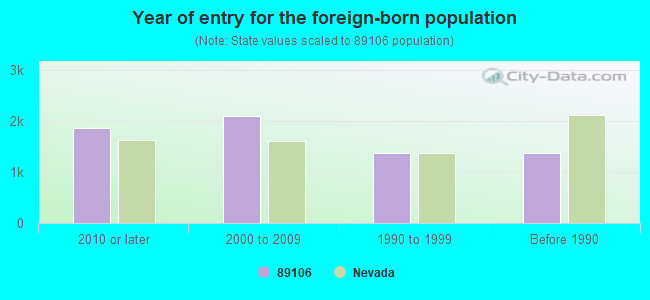
Foreign born population: 6,065 (23.2%) (33.7% of them are naturalized citizens)
Major facilities with environmental interests located in this zip code:
CLARK COUNTY GOVERNMENT (500 SOUTH GRAND CENTRAL PARKWAY in LAS VEGAS, NV)
AIR MINOR (AIRS/AFS) ENFORCEMENT/COMPLIANCE ACTIVITY (Integrated Compliance Information System) - ICIS-09-2002-0028, FORMAL ENFORCEMENT ACTION (Integrated Compliance Information System) - ICIS-09-2002-0028, FORMAL ENFORCEMENT ACTION Business SIC classification: EXECUTIVE OFFICES; NONCLASSIFIABLE ESTABLISHMENTS
HAYCOCK PETROLEUM COMPANY (715 W BONANZA RD in LAS VEGAS, NV)
(Integrated Compliance Information System) - ICIS-09-2005-0144, ENFORCEMENT/COMPLIANCE ACTIVITY FORMAL ENFORCEMENT ACTION (Integrated Compliance Information System) - ICIS-09-2005-0144, ENFORCEMENT/COMPLIANCE ACTIVITY Conditionally Exempt Small Quantity Generators, less than 100 kg/month of hazardous waste (Resource Conservation and Recovery Act (tracking hazardous waste)) TRANSPORTER (Resource Conservation and Recovery Act (tracking hazardous waste)) Alternative names: HAYCOCK DISTRIBUTING CO
CLARK CNTY (285 SO HIGHLAND in LAS VEGAS, NV)
(Resource Conservation and Recovery Act (tracking hazardous waste)) Organizations: CLARK COUNTY (CONTACT/OWNER)
, COUNTY OF CLARK (CONTACT/OWNER)
Alternative names: CLARK COUNTY AUTOMOTIVE SVCS
NEVADA READY MIX (601 BONANZA in LAS VEGAS, NV)
AIR SYNTHETIC MINOR (AIRS/AFS) (Integrated Compliance Information System) - ICIS-09-1999-0188, FORMAL ENFORCEMENT ACTION CRITERIA AND HAZARDOUS AIR POLLUTANT INVENTORY (Inventory of air pollution sources) TRI REPORTER (Tracking of toxic chemicals releasing facilities) Business SIC classification: CONSTRUCTION SAND AND GRAVEL; MOBILE HOMES; READY-MIXED CONCRETE; CONSTRUCTION MACHINERY AND EQUIPMENT; MINING MACHINERY AND EQUIPMENT, EXCEPT OIL AND GAS FIELD MACHINERY AND EQUIPMENT
AGASSI COLLEGE PREP CHARTER (1201 WEST LAKE MEAD in LAS VEGAS, NV)
(National Center for Education Statistics) - STATE ID-02-288 Organizations: CLARK CO SCH DIST (SCHOOL DISTRICT)
HOGGARD, MABEL ELEM (950 NORTH TONOPAH DRIVE in LAS VEGAS, NV)
(National Center for Education Statistics) - STATE ID-02-202 Organizations: CLARK CO SCH DIST (SCHOOL DISTRICT)
BOOKER, KERMIT ELEM (2277 MARTIN LUTHER KING BLVD in LAS VEGAS, NV)
(National Center for Education Statistics) - STATE ID-02-211 Organizations: CLARK CO SCH DIST (SCHOOL DISTRICT)
CARSON, KIT ELEM (1735 NORTH D STREET in LAS VEGAS, NV)
(National Center for Education Statistics) - STATE ID-02-219 Organizations: CLARK CO SCH DIST (SCHOOL DISTRICT)
ADVANCE TECH ACAD (2501 VEGAS DRIVE in LAS VEGAS, NV)
(National Center for Education Statistics) - STATE ID-02-420 Organizations: CLARK CO SCH DIST (SCHOOL DISTRICT)
KELLY, MATT ELEM (1900 NORTH J STREET in LAS VEGAS, NV)
(National Center for Education Statistics) - STATE ID-02-226 Organizations: CLARK CO SCH DIST (SCHOOL DISTRICT)
DETWILER, OLLIE ELEM (1960 FERRELL STREET in LAS VEGAS, NV)
(National Center for Education Statistics) - STATE ID-02-300 Organizations: CLARK CO SCH DIST (SCHOOL DISTRICT)
RANCHO CLEANERS (850 S RANCHO DR in LAS VEGAS, NV)
(Resource Conservation and Recovery Act (tracking hazardous waste)) Organizations: EDWARD TOTIGH (CONTACT/OWNER)
Alternative names: FAST 1 HOUR FOTO
CLEAR CHANNEL OUTDOOR (1211 W BONANZA RD in LAS VEGAS, NV)
HAZARDOUS WASTE BIENNIAL REPORTER (Resource Conservation and Recovery Act (tracking hazardous waste)) (Resource Conservation and Recovery Act (tracking hazardous waste)) Organizations: DONREY OF NEVADA (CONTACT/OWNER)
Housing units lacking complete plumbing facilities: 1.2% Housing units lacking complete kitchen facilities: 2.8%
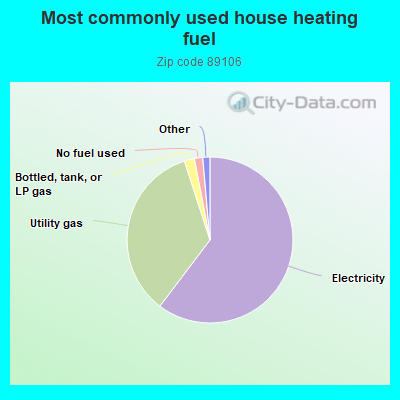
60.4%Electricity
34.7%Utility gas
2.0%Bottled, tank, or LP gas
1.6%No fuel used
0.7%Wood
0.7%Solar energy
Population in 1990: 21,458. Population change in the 1990s: +4,105 (+19.1%).
Place of birth for U.S.-born residents:
This state: 8,963
Northeast: 821
Midwest: 1,541
South: 2,755
West: 5,453
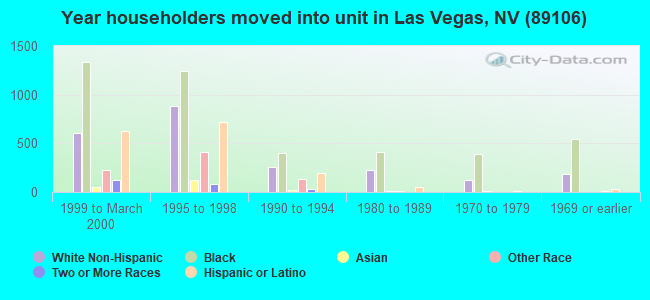
40% of the 89106 zip code residents lived in the same house 5 years ago. Out of people who lived in different houses, 65% lived in this county. Out of people who lived in different counties, 50% lived in Nevada.
84% of the 89106 zip code residents lived in the same house 1 year ago. Out of people who lived in different houses, 68% moved from this county. Out of people who lived in different houses, 0% moved from different county within same state. Out of people who lived in different houses, 23% moved from different state. Out of people who lived in different houses, 5% moved from abroad.
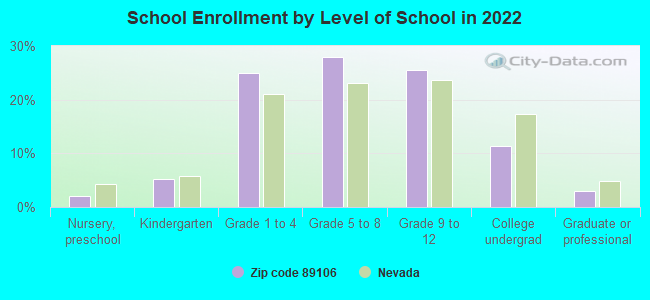
Private vs. public school enrollment:
Students in private schools in grades 1 to 8 (elementary and middle school): 106
Here:
3.5%
Nevada:
12.9%
Students in private schools in grades 9 to 12 (high school): 22
Here:
1.5%
Nevada:
6.9%
Students in private undergraduate colleges: 201
Here:
30.6%
Nevada:
16.0%
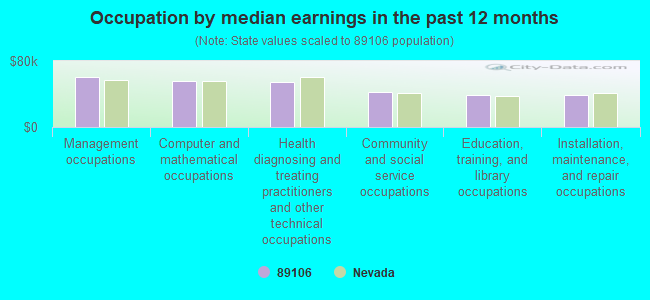
Occupation by median earnings in the past 12 months ($)
60,399Management occupations
55,946Computer and mathematical occupations
54,957Health diagnosing and treating practitioners and other technical occupations
42,734Community and social service occupations
39,182Education, training, and library occupations
38,544Installation, maintenance, and repair occupations
Companies with federal contracts located in this zip code (LAS VEGAS, NV):
WALTER JONES (1951 SUTRO; small business) : $98,175 in 3 contractsfrom 2000 to 2001
$75,000 with Air Force for Landscaping/Groundskeeping Services. Signed on 2000-11-14. Completion date: 2001-10-09.
$66,623 with Air Force for Custodial Janitorial Services. Signed on 2000-11-24. Completion date: 2001-10-09.
-$43,448, same as above.Signed on 2001-03-15. Completion date: 2001-03-15.
UNIFORMS INC (1070 S COMMERCE ST; small business)
$25,623 with Air Force for Footwear, Men's. Signed on 2005-02-15. Completion date: 2005-01-31.
PENSKE TRUCK LEASING CO, LP (1132 W BONANZA RD) : $24,224 in 2 contractsin 2005
$36,775 with Army for Refrigeration Equipment. Signed on 2005-03-07. Completion date: 2005-04-08.
-$12,551, same as above.Signed on 2005-06-02. Completion date: 2005-04-08.
NEVADA ASSOCIATION FOR THE EDU (701 N RANCHO DR)
$10,850 with Air Force for Educational Services. Signed on 2006-04-05. Completion date: 2006-04-08.
STEEL ENGINEERS INC (716 W MESQUITE AVE; small business)
$2,690 with Air Force for Miscellaneous Construction Materials. Signed on 2005-03-31. Completion date: 2005-03-10.
Top industries in this zip code by the number of employees in 2005:
Health Care and Social Assistance: General Medical and Surgical Hospitals (over 1000 employees: 1 establishment, 500-999 employees: 1 establishment)
Health Care and Social Assistance: Offices of Physicians (except Mental Health Specialists) (100-249: 1, 50-99: 5, 20-49: 10, 10-19: 26, 5-9: 18, 1-4: 82)
2002 - 2018 National Fire Incident Reporting System (NFIRS) incidents
According to the data from the years 2002 - 2018 the average number of fires per year is 195. The highest number of fires - 381 took place in 2017, and the least - 0 in 2003. The data has a rising trend.
When looking into fire subcategories, the most incidents belonged to: Outside Fires (44.8%), and Structure Fires (34.8%).
Fire incident types reported to NFIRS in Zip Code 89106


 Nearest zip codes: 89101, 89032, 89102, 89107, 89030, 89109.


 According to the data from the years 2002 - 2018 the average number of fires per year is 195. The highest number of fires - 381 took place in 2017, and the least - 0 in 2003. The data has a rising trend.
 When looking into fire subcategories, the most incidents belonged to: Outside Fires (44.8%), and Structure Fires (34.8%).