Estimated zip code population in 2022: 45,171 Zip code population in 2010: 46,055 Zip code population in 2000: 52,617
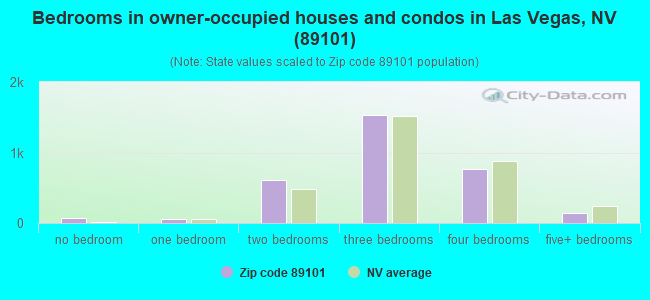
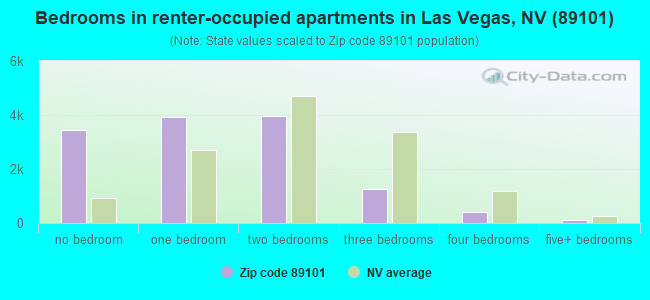
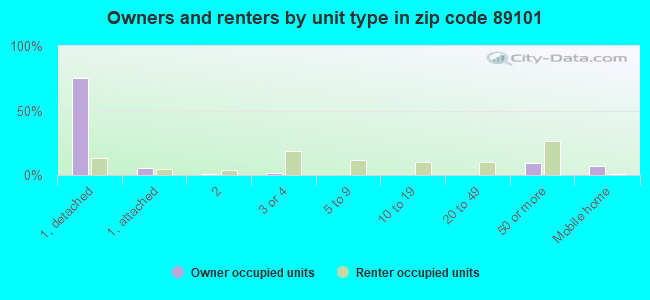
Houses and condos: 18,726 Renter-occupied apartments: 12,638
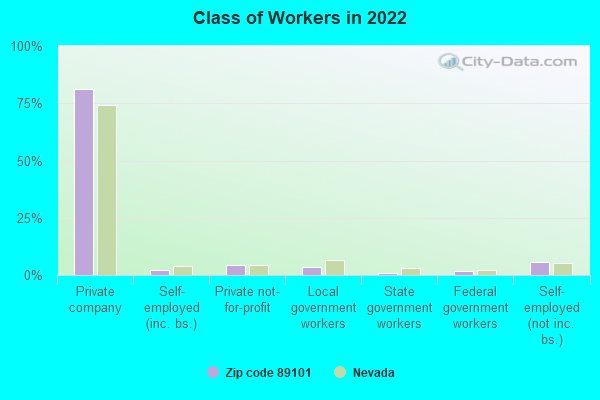
% of renters here:
80%
State:
40%
March 2022 cost of living index in zip code 89101: 99.6 (near average, U.S. average is 100)
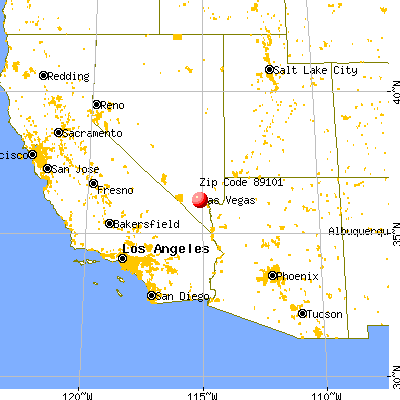
Land area: 5.4 sq. mi. Water area: 0.0 sq. mi.
Population density: 8,439 people per square mile
(high).
OSM Map
General Map
Google Map
MSN Map
OSM Map
General Map
Google Map
MSN Map
OSM Map
General Map
Google Map
MSN Map
OSM Map
General Map
Google Map
MSN Map
Please wait while loading the map...
Real estate property taxes paid for housing units in 2022:
This zip code:
0.3% ($772)
Nevada:
0.4% ($1,889)
Median real estate property taxes paid for housing units with mortgages in 2022: $855 (0.3%) Median real estate property taxes paid for housing units with no mortgage in 2022: $684 (0.3%)
Averages for the 2020 tax year for zip code 89101, filed in 2021:
Average Adjusted Gross Income (AGI) in 2020: $38,990 (Individual Income Tax Returns)
Here:
$38,990
State:
$78,964
Salary/wage: $29,730 (reported on 86.0% of returns)
Here:
$29,730
State:
$54,472
(% of AGI for various income ranges: 1225.2% for AGIs below $25k, 3605.8% for AGIs $25k-50k, 6789.8% for AGIs $50k-75k, 10409.7% for AGIs $75k-100k, 19272.1% for AGIs $100k-200k, 81490.0% for AGIs over 200k)
Taxable interest for individuals: $1,089 (reported on 8.6% of returns)
This zip code:
$1,089
Nevada:
$3,521
(% of AGI for various income ranges: 2.2% for AGIs below $25k, 2.1% for AGIs $25k-50k, 9.4% for AGIs $50k-75k, 20.3% for AGIs $75k-100k, 160.0% for AGIs $100k-200k, 1704.0% for AGIs over 200k)
Ordinary dividends: $9,673 (reported on 3.3% of returns)
Here:
$9,673
State:
$13,390
(% of AGI for various income ranges: 1.9% for AGIs below $25k, 4.8% for AGIs $25k-50k, 14.6% for AGIs $50k-75k, 52.9% for AGIs $75k-100k, 308.9% for AGIs $100k-200k, 8302.0% for AGIs over 200k)
Net capital gain/loss in AGI: +$77,697 (reported on 4.2% of returns)
Here:
+$77,697
State:
+$63,025
(% of AGI for various income ranges: 1.4% for AGIs below $25k, 10.6% for AGIs $25k-50k, 14.0% for AGIs $50k-75k, 215.6% for AGIs $75k-100k, 869.5% for AGIs $100k-200k, 102566.0% for AGIs over 200k)
Profit/loss from business: +$7,189 (reported on 16.3% of returns)
Here:
+$7,189
State:
+$11,500
(% of AGI for various income ranges: 128.3% for AGIs below $25k, 63.0% for AGIs $25k-50k, 174.6% for AGIs $50k-75k, 170.3% for AGIs $75k-100k, 580.5% for AGIs $100k-200k, 9668.0% for AGIs over 200k)
Taxable individual retirement arrangement distribution: $14,095 (reported on 1.2% of returns)
89101:
$14,095
Nevada:
$23,628
(% of AGI for various income ranges: 5.1% for AGIs below $25k, 9.5% for AGIs $25k-50k, 35.1% for AGIs $50k-75k, 105.0% for AGIs $75k-100k, 695.8% for AGIs $100k-200k)
Total itemized deductions: $38,706 (reported on 2.0% of returns)
Here:
$38,706
State:
$44,173
(% of AGI for various income ranges: 3.7% for AGIs below $25k, 44.3% for AGIs $25k-50k, 155.6% for AGIs $50k-75k, 213.2% for AGIs $75k-100k, 767.4% for AGIs $100k-200k, 14120.0% for AGIs over 200k)
Charity contributions: $13,864 (reported on 1.5% of returns)
Here:
$13,864
State:
$12,589
(% of AGI for various income ranges: 6.8% for AGIs $25k-50k, 18.5% for AGIs $50k-75k, 19.1% for AGIs $75k-100k, 91.6% for AGIs $100k-200k, 5440.0% for AGIs over 200k)
Taxes paid: $5,100 (reported on 1.9% of returns)
89101:
$5,100
State:
$6,112
(% of AGI for various income ranges: 0.5% for AGIs below $25k, 8.2% for AGIs $25k-50k, 25.0% for AGIs $50k-75k, 38.8% for AGIs $75k-100k, 132.1% for AGIs $100k-200k, 1150.0% for AGIs over 200k)
Earned income credit: $2,526 (reported on 30.5% of returns)
Here:
$2,526
State:
$2,214
(% of AGI for various income ranges: 138.3% for AGIs below $25k, 84.2% for AGIs $25k-50k, 0.8% for AGIs $50k-75k)
Percentage of individuals using paid preparers for their 2020 taxes: 92.3%
Here:
92%
State:
93%
(% for various income ranges: 90.8% for AGIs below $25k, 94.0% for AGIs $25k-50k, 93.8% for AGIs $50k-75k, 94.1% for AGIs $75k-100k, 94.7% for AGIs $100k-200k, 88.9% for AGIs over 200k)
Averages for the 2012 tax year for zip code 89101, filed in 2013:
Average Adjusted Gross Income (AGI) in 2012: $29,699 (Individual Income Tax Returns)
Here:
$29,699
State:
$61,164
Salary/wage: $25,108 (reported on 87.1% of returns)
Here:
$25,108
State:
$45,924
(% of AGI for various income ranges: 80.7% for AGIs below $25k, 90.6% for AGIs $25k-50k, 82.9% for AGIs $50k-75k, 76.9% for AGIs $75k-100k, 66.4% for AGIs $100k-200k, 25.6% for AGIs over 200k)
Taxable interest for individuals: $2,725 (reported on 7.5% of returns)
This zip code:
$2,725
Nevada:
$3,137
(% of AGI for various income ranges: 0.2% for AGIs below $25k, 0.2% for AGIs $25k-50k, 0.7% for AGIs $50k-75k, 0.4% for AGIs $75k-100k, 0.4% for AGIs $100k-200k, 2.6% for AGIs over 200k)
Ordinary dividends: $14,512 (reported on 3.5% of returns)
Here:
$14,512
State:
$11,762
(% of AGI for various income ranges: 1.6% for AGIs below $25k, 1.2% for AGIs $25k-50k, 1.0% for AGIs $50k-75k, 0.8% for AGIs $75k-100k, 0.9% for AGIs $100k-200k, 3.6% for AGIs over 200k)
Net capital gain/loss in AGI: +$24,616 (reported on 2.5% of returns)
Here:
+$24,616
State:
+$33,127
(% of AGI for various income ranges: 0.3% for AGIs $25k-50k, 0.6% for AGIs $50k-75k, 0.4% for AGIs $75k-100k, 0.3% for AGIs $100k-200k, 11.1% for AGIs over 200k)
Profit/loss from business: +$9,272 (reported on 14.0% of returns)
Here:
+$9,272
State:
+$12,567
(% of AGI for various income ranges: 9.9% for AGIs below $25k, 1.2% for AGIs $25k-50k, 1.3% for AGIs $50k-75k, 3.0% for AGIs $75k-100k, 3.7% for AGIs $100k-200k, 3.1% for AGIs over 200k)
Taxable individual retirement arrangement distribution: $18,738 (reported on 1.4% of returns)
89101:
$18,738
Nevada:
$20,808
(% of AGI for various income ranges: 0.4% for AGIs below $25k, 0.5% for AGIs $25k-50k, 1.5% for AGIs $50k-75k, 8.1% for AGIs $100k-200k)
Total itemized deductions: $28,817 (27% of AGI, reported on 7.8% of returns)
Here:
$28,817
State:
$26,148
Here:
26.8% of AGI
State:
20.0% of AGI
(% of AGI for various income ranges: 2.0% for AGIs below $25k, 5.5% for AGIs $25k-50k, 8.4% for AGIs $50k-75k, 11.1% for AGIs $75k-100k, 12.8% for AGIs $100k-200k, 17.9% for AGIs over 200k)
Charity contributions: $6,003 (reported on 5.9% of returns)
Here:
$6,003
State:
$4,329
(% of AGI for various income ranges: 0.1% for AGIs below $25k, 0.5% for AGIs $25k-50k, 0.8% for AGIs $50k-75k, 1.5% for AGIs $75k-100k, 2.2% for AGIs $100k-200k, 4.1% for AGIs over 200k)
Taxes paid: $3,305 (reported on 7.5% of returns)
89101:
$3,305
State:
$5,116
(% of AGI for various income ranges: 0.2% for AGIs below $25k, 0.7% for AGIs $25k-50k, 1.2% for AGIs $50k-75k, 1.6% for AGIs $75k-100k, 2.2% for AGIs $100k-200k, 1.2% for AGIs over 200k)
Earned income credit: $2,651 (reported on 32.2% of returns)
Here:
$2,651
State:
$2,279
(% of AGI for various income ranges: 7.9% for AGIs below $25k, 1.6% for AGIs $25k-50k)
Percentage of individuals using paid preparers for their 2012 taxes: 66.4%
Here:
66%
State:
55%
(% for various income ranges: 64.4% for AGIs below $25k, 71.0% for AGIs $25k-50k, 66.2% for AGIs $50k-75k, 59.3% for AGIs $75k-100k, 66.7% for AGIs $100k-200k, 87.5% for AGIs over 200k)
Averages for the 2004 tax year for zip code 89101, filed in 2005:
Average Adjusted Gross Income (AGI) in 2004: $26,902 (Individual Income Tax Returns)
Here:
$26,902
State:
$58,367
Salary/wage: $23,897 (reported on 92.4% of returns)
Here:
$23,897
State:
$42,695
(% of AGI for various income ranges: 121.9% for AGIs below $10k, 92.4% for AGIs $10k-25k, 93.7% for AGIs $25k-50k, 86.8% for AGIs $50k-75k, 73.4% for AGIs $75k-100k, 26.4% for AGIs over 100k)
Taxable interest for individuals: $4,563 (reported on 10.4% of returns)
This zip code:
$4,563
Nevada:
$3,867
(% of AGI for various income ranges: 3.2% for AGIs below $10k, 0.4% for AGIs $10k-25k, 0.4% for AGIs $25k-50k, 0.7% for AGIs $50k-75k, 0.7% for AGIs $75k-100k, 8.3% for AGIs over 100k)
Taxable dividends: $3,333 (reported on 3.1% of returns)
Here:
$3,333
State:
$5,770
(% of AGI for various income ranges: 1.1% for AGIs below $10k, 0.1% for AGIs $10k-25k, 0.1% for AGIs $25k-50k, 0.4% for AGIs $50k-75k, 0.4% for AGIs $75k-100k, 1.5% for AGIs over 100k)
Net capital gain/loss: +$26,389 (reported on 2.7% of returns)
Here:
+$26,389
State:
+$50,644
(% of AGI for various income ranges: 0.5% for AGIs below $10k, -0.0% for AGIs $10k-25k, 0.1% for AGIs $25k-50k, 0.8% for AGIs $50k-75k, 2.8% for AGIs $75k-100k, 15.5% for AGIs over 100k)
Profit/loss from business: +$8,871 (reported on 5.9% of returns)
Here:
+$8,871
State:
+$13,618
(% of AGI for various income ranges: 6.2% for AGIs below $10k, 1.7% for AGIs $10k-25k, 0.9% for AGIs $25k-50k, 1.2% for AGIs $50k-75k, 3.2% for AGIs $75k-100k, 4.2% for AGIs over 100k)
IRA payment deduction: $2,934 (reported on 0.6% of returns)
89101:
$2,934
Nevada:
$3,054
Total itemized deductions: $16,390 (26% of AGI, reported on 13.9% of returns)
Here:
$16,390
State:
$22,990
Here:
26.2% of AGI
State:
21.8% of AGI
(% of AGI for various income ranges: 3.0% for AGIs below $10k, 4.4% for AGIs $10k-25k, 9.0% for AGIs $25k-50k, 12.4% for AGIs $50k-75k, 13.6% for AGIs $75k-100k, 10.9% for AGIs over 100k)
Charity contributions deductions: $2,681 (4% of AGI, reported on 11.3% of returns)
Here:
$2,681
State:
$3,443
Here:
4.0% of AGI
State:
3.1% of AGI
(% of AGI for various income ranges: 0.2% for AGIs below $10k, 0.4% for AGIs $10k-25k, 0.9% for AGIs $25k-50k, 1.3% for AGIs $50k-75k, 2.2% for AGIs $75k-100k, 2.9% for AGIs over 100k)
Total tax: $3,735 (reported on 52.0% of returns)
89101:
$3,735
State:
$10,585
(% of AGI for various income ranges: 2.4% for AGIs below $10k, 2.7% for AGIs $10k-25k, 4.2% for AGIs $25k-50k, 7.0% for AGIs $50k-75k, 11.1% for AGIs $75k-100k, 22.5% for AGIs over 100k)
Earned income credit: $1,804 (reported on 31.4% of returns)
Here:
$1,804
State:
$1,676
Percentage of individuals using paid preparers for their 2004 taxes: 73.2%
Here:
73%
State:
60%
(% for various income ranges: 66.3% for AGIs below $10k, 74.9% for AGIs $10k-25k, 75.5% for AGIs $25k-50k, 74.1% for AGIs $50k-75k, 67.5% for AGIs $75k-100k, 81.7% for AGIs over 100k)
Likely homosexual households (counted as self-reported same-sex unmarried-partner households)
Lesbian couples: 0.4% of all households
Gay men: 0.2% of all households
Household received Food Stamps/SNAP in the past 12 months: 5,935 Household did not receive Food Stamps/SNAP in the past 12 months: 10,860
Women who had a birth in the past 12 months: 715 (393 now married, 288 unmarried) Women who did not have a birth in the past 12 months: 9,759 (2,935 now married, 6,862 unmarried)
Housing units in zip code 89101 with a mortgage: 1,879 (58 second mortgage, 12 both second mortgage and home equity loan) Houses without a mortgage: 16
Median monthly owner costs for units with a mortgage: $1,235 Median monthly owner costs for units without a mortgage: $402
Residents with income below the poverty level in 2022:
This zip code:
29.8%
Whole state:
12.5%
Residents with income below 50% of the poverty level in 2022:
This zip code:
14.7%
Whole state:
5.9%
Median number of rooms in houses and condos:
Here:
5.2
State:
6.0
Median number of rooms in apartments:
Here:
3.1
State:
4.2
Notable locations in this zip code not listed on our city pages
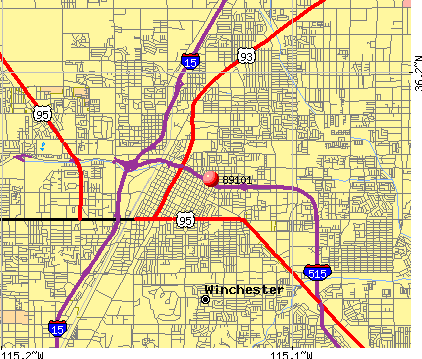
Notable locations in zip code 89101: Bonanza Square (A), Greater Vegas Plaza (B), Union Pacific Station (C), Las Vegas Fire and Rescue Station 8 (D), Las Vegas Fire and Rescue Station 4 (E), Las Vegas Fire and Rescue Station 1 (F), Child Haven-Agassi Center (G), Canon Senior Center (H), Bridger Building (I), Bilingual Senior Community Center (J), Las Vegas Natural History Museum (K), Las Vegas Metropolitan Police Department Northeast Substation (L), Las Vegas Metropolitan Police Department Downtown Substation (M), Las Vegas Library (N), Las Vegas City Hall (O), Las Vegas Branch Genealogical Library (P), Jesus is the Answer Mens Home (Q), Rafael Rivera Community Center (R), Reed Whipple Cultural Center (S), South Third Street Building (T). Display/hide their locations on the map
Shopping Centers: Wonderland East Shopping Center (1), Bonanza East Shopping Center (2), Sunrise Shopping Center (3), Stewart Square Shopping Center (4). Display/hide their locations on the map
Churches in zip code 89101 include: Sanctuary of Praise International Church (A), Saint Lukes Episcopal Church (B), Saint Josephs Catholic Church (C), Saint Joan of Arc Catholic Church (D), United Church of Christ (E), The Good Samaritan Worship and Training Center (F), The Church of Jesus Christ of Latter Day Saints (G), Jesus is Lord Church of Henderson (H), Iglesia Pentecostal Unida Hispana (I). Display/hide their locations on the map
Parks in zip code 89101 include: Old Las Vegas Fort State Historical Park (1), Bracken Playground (2), Hadland Pool (3), Heritage Park (4), Hewetson Playground (5), Ronnow Playground (6), Fantasy Park (7), Hadland Park (8), Las Vegas Racetrack and Ball Park (9). Display/hide their locations on the map
Tourist attractions (not listed on the city page) : University-Nevada Book Store (Museums; 4505 South Maryland PKWY), RL Publishing (Ski & Helicopter Tours; Post Office Box 16006), Freeman Companies (Cultural Attractions- Events- & Facilities; 7000 Placid St Suite 101), Lydia Malcolm (Cultural Attractions- Events- & Facilities; 80 North Pecos Road), Henderson Libraries (Cultural Attractions- Events- & Facilities; 1608 Moser Drive), Pittman Cybrary (Cultural Attractions- Events- & Facilities; 1608 Moser Drive), 1 A Free Las Vegas Newsletter - Discounts - Specials (Post Office Box 15110), Visitors Information Centers (Las Vegas Visitors Centre), Sightseeing Tours Unlimited (4740 South Valley View Boulevard).
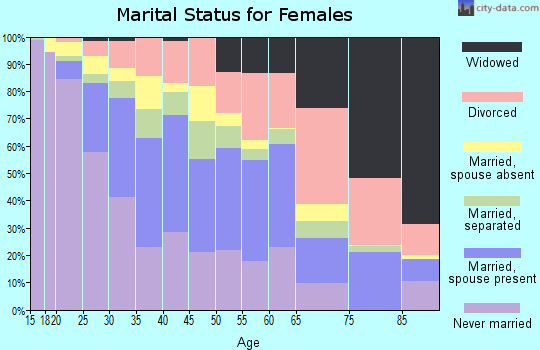
3,585 married couples with children.
4,558 single-parent households (1,152 men, 3,406 women).
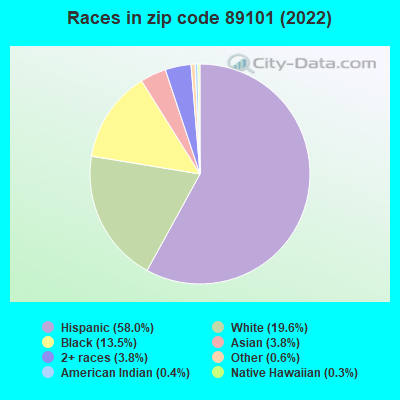
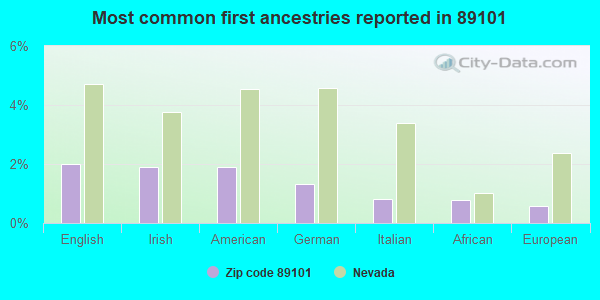
45.5% of residents of 89101 zip code speak English at home.
49.5% of residents speak Spanish at home (52% very well, 14% well, 21% not well, 13% not at all).
1.1% of residents speak other Indo-European language at home (74% very well, 18% well, 8% not well).
3.5% of residents speak Asian or Pacific Island language at home (44% very well, 41% well, 13% not well, 2% not at all).
0.4% of residents speak other language at home (68% very well, 16% well, 16% not at all).
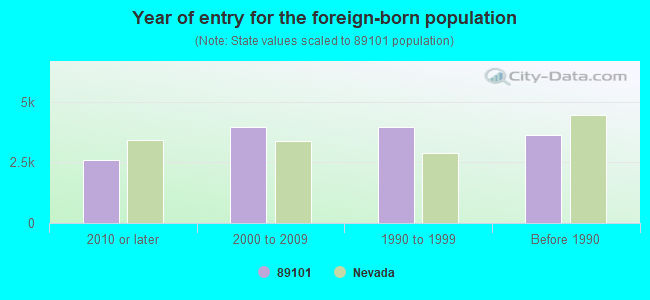
Foreign born population: 13,270 (29.4%) (27.7% of them are naturalized citizens)
Major facilities with environmental interests located in this zip code:
LAS VEGAS FINISHING LLC (3261 BUILDERS AVENUE in LAS VEGAS, NV)
AIR MINOR (AIRS/AFS) (Integrated Compliance Information System) - ICIS-09-2000-0183, FORMAL ENFORCEMENT ACTION Large Quantity Generators, more that 1000 kg of hazardous waste/month (Resource Conservation and Recovery Act (tracking hazardous waste)) - ICIS-, ENFORCEMENT/COMPLIANCE ACTIVITY TRI REPORTER (Tracking of toxic chemicals releasing facilities) Business SIC and NAICS classification: ELECTROPLATING, PLATING, POLISHING, ANODIZING, AND COLORING Organizations: C I P CAPITAL (CONTACT/OWNER)
, JOHN KRUGER (CONTACT/OWNER)
, HARSCH INVESTMENT PROPERTIES (CONTACT/OWNER)
Alternative names: L V FINISHING, LAS VEGAS FINISHING L.L.C., LV FINISHING
ANDERSON DAIRY (801 SEARLES AVE. in LAS VEGAS, NV)
(Integrated Compliance Information System) - ICIS-09-1997-0120, FORMAL ENFORCEMENT ACTION COMPLIANCE ACTIVITY (Tracking inspections of insecticide, fungicide, and rodenticide, and toxic substances) STATE MASTER (NV-FP) - STORMWATER-ISW-391, NPDES STORMWATER PERMIT TRI REPORTER (Tracking of toxic chemicals releasing facilities) Business SIC classification: ICE CREAM AND FROZEN DESSERTS; FLUID MILK Alternative names: ANDERSON DAIRY PRODS., CEDAR AVENUE DRAINAGE CHANNEL
COCA COLA LAS VEGAS (424 NORTH MAIN STREET in LAS VEGAS, NV)
(Resource Conservation and Recovery Act (tracking hazardous waste)) Organizations: COCA COLA ENTERPRISES (CONTACT/OWNER)
, COCA-COLA ENTERPRISES - WEST (CONTACT/OWNER)
, COCA COLA LOS ANGELES (CONTACT/OWNER)
Alternative names: COCA COLA BOTTLING CO OF LAS VEGAS, COCA COLA OF LAS VEGAS
ROY W MARTIN JUNIOR HIGH SCHOOL (2800 E. STEWART AVE. in LAS VEGAS, NV)
(Geographic Names Information System) COMPLIANCE ACTIVITY (Tracking inspections of insecticide, fungicide, and rodenticide, and toxic substances) (National Center for Education Statistics) - STATE ID-02-311 Organizations: CLARK CO SCH DIST (SCHOOL DISTRICT)
Alternative names: MARTIN, ROY MIDSCH
C C RONNOW ELEMENTARY SCHOOL (1100 LENA STREET in LAS VEGAS, NV)
(Geographic Names Information System) (National Center for Education Statistics) - STATE ID-02-203 Organizations: CLARK CO SCH DIST (SCHOOL DISTRICT)
Alternative names: RONNOW, C C ELEM
HOMEBOUND SPECIAL SCHOOL (2601 SUNRISE AVENUE in LAS VEGAS, NV)
(Geographic Names Information System) (National Center for Education Statistics) - STATE ID-02-915 Organizations: CLARK CO SCH DIST (SCHOOL DISTRICT)
HALLE HEWETSON ELEMENTARY SCHOOL (701 NORTH 20TH STREET in LAS VEGAS, NV)
(Geographic Names Information System) (National Center for Education Statistics) - STATE ID-02-210 Organizations: CLARK CO SCH DIST (SCHOOL DISTRICT)
Alternative names: HEWETSON, HALLE ELEM
LAS VEGAS HS (315 SOUTH 7TH STREET in LAS VEGAS, NV)
COMPLIANCE ACTIVITY (Tracking inspections of insecticide, fungicide, and rodenticide, and toxic substances) (National Center for Education Statistics) - STATE ID-02-402 Organizations: CLARK CO SCH DIST (SCHOOL DISTRICT)
Alternative names: LAS VEGAS HIGH SCHOOL
ROBERT LUNT ELEMENTARY SCHOOL (2701 HARRIS ST in LAS VEGAS, NV)
(Geographic Names Information System) (National Center for Education Statistics) - STATE ID-02-117 Organizations: CLARK CO SCH DIST (SCHOOL DISTRICT)
Alternative names: LUNT,ROBERT ELEM
CHILD HAVEN (3400 EAST BONANZA ROAD in LAS VEGAS, NV)
(National Center for Education Statistics) - STATE ID-02-912 Organizations: CLARK CO SCH DIST (SCHOOL DISTRICT)
FORMER CHEVRON STATION 9-7763 (2450 EAST BONANZA ROAD in LAS VEGAS, NV)
National Pollutant Discharge Elimination System NON-MAJOR (Tracking pollutant discharge elimination systems) - permit Small Quantity Generators, between 100 kg and 1000 kg of hazardous waste/month (Resource Conservation and Recovery Act (tracking hazardous waste)) - notification Business SIC classification: GASOLINE SERVICE STATIONS Organizations: FORMER CHEVRON STATION 9-7753 (CONTACT/OPERATOR)
, CHEVRON PRODUCTS CO (CONTACT/OWNER)
, CHEVRON TEXACO PRODUCTS CO (CONTACT/OWNER)
Alternative names: CHEVRON NO 97753, CHEVRON TEXACO
CAMBEIRO ELEM (2851 HARRIS STREET in LAS VEGAS, NV)
(National Center for Education Statistics) - STATE ID-02-155 Organizations: CLARK CO SCH DIST (SCHOOL DISTRICT)
LV ACAD (315 SOUTH 7TH STREET in LAS VEGAS, NV)
(National Center for Education Statistics) - STATE ID-02-418 Organizations: CLARK CO SCH DIST (SCHOOL DISTRICT)
Housing units lacking complete plumbing facilities: 0.7% Housing units lacking complete kitchen facilities: 1.5%
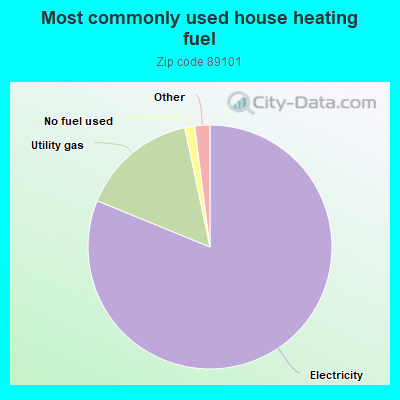
81.2%Electricity
15.5%Utility gas
1.3%No fuel used
0.8%Bottled, tank, or LP gas
0.7%Other fuel
Population in 1990: 40,270. Population change in the 1990s: +12,347 (+30.7%).
Place of birth for U.S.-born residents:
This state: 13,045
Northeast: 1,829
Midwest: 2,892
South: 3,045
West: 10,148
38% of the 89101 zip code residents lived in the same house 5 years ago. Out of people who lived in different houses, 55% lived in this county. Out of people who lived in different counties, 50% lived in Nevada.
75% of the 89101 zip code residents lived in the same house 1 year ago. Out of people who lived in different houses, 69% moved from this county. Out of people who lived in different houses, 1% moved from different county within same state. Out of people who lived in different houses, 20% moved from different state. Out of people who lived in different houses, 3% moved from abroad.
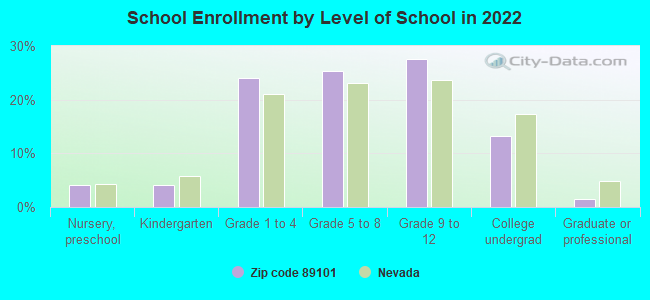
Private vs. public school enrollment:
Students in private schools in grades 1 to 8 (elementary and middle school): 400
Here:
9.0%
Nevada:
12.9%
Students in private schools in grades 9 to 12 (high school): 108
Here:
4.3%
Nevada:
6.9%
Students in private undergraduate colleges: 327
Here:
26.8%
Nevada:
16.0%
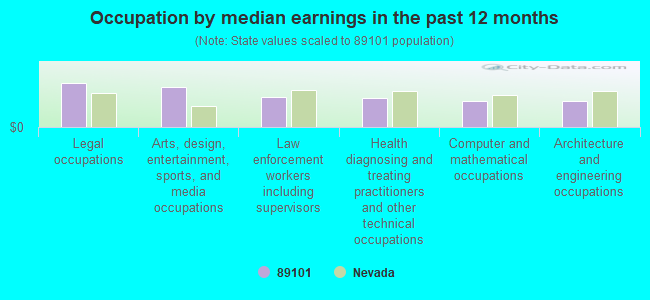
Occupation by median earnings in the past 12 months ($)
108,755Legal occupations
99,439Arts, design, entertainment, sports, and media occupations
72,985Law enforcement workers including supervisors
72,895Health diagnosing and treating practitioners and other technical occupations
64,909Computer and mathematical occupations
63,725Architecture and engineering occupations
Companies with biggest federal contracts located in this zip code (LAS VEGAS, NV):
FRESH EXPRESS (726 S CASINO CENTER; small business) : $4,559,845 in 26 contractsfrom 2001 to 2005
Contracts for Operation of Government-Owned Facilities -- Dining Facilities, Food Services by Air Force Signed by year:2000: $0; 2001: $840,254; 2002: $965,497; 2003: $987,503; 2004: $1,081,857; 2005: $684,734; 2006: $0.
Biggest contracts:
$775,964 with Air Force for Operation of Government-Owned Facilities -- Dining Facilities. Taking place in WY. Signed on 2003-10-01. Completion date: 2004-09-30.
$736,277 with Air Force for Food Services. Taking place in WY. Signed on 2005-10-01. Completion date: 2006-09-30.
$731,489, same as above.Signed on 2004-10-01. Completion date: 2005-09-30.
$675,501 with Air Force for Operation of Government-Owned Facilities -- Dining Facilities. Signed on 2002-10-01. Completion date: 2003-09-30.
UNIVERSAL BUILDING MAINT , INC (3310 SUNRISE AVENUE, SUITE; small business) : $2,203,346 in 34 contractsfrom 1999 to 2006
Contracts for Custodial Janitorial Services by Bureau of Reclamation, Public Buildings Service, Air Force, Army, and others Signed by year:2000: $1,125,288; 2001: $170,000; 2002: $0; 2003: $80,270; 2004: $69,209; 2005: $94,064; 2006: $48,515.
Biggest contracts:
$306,000 with Bureau of Reclamation for Custodial Janitorial Services. Signed on 2000-10-15. Completion date: 2001-04-15.
$305,000, same as above.Signed on 1999-10-15. Completion date: 2001-04-15.
$254,000, same as above.Signed on 2000-03-15. Completion date: 2001-04-15.
$168,000 with Public Buildings Service for Custodial Janitorial Services. Taking place in TX. Signed on 1999-11-15. Completion date: 2000-12-15.
COUGHCOR, LLC (124 SOUTH SIXTH STREET, SU; small business) : $2,079,035 in 27 contractsfrom 2002 to 2005
Contracts for Trash/Garbage Collection Services - Including Portable Sanitation Services by Air Force Signed by year:2000: $0; 2001: $0; 2002: $503,301; 2003: $582,867; 2004: $594,004; 2005: $398,863; 2006: $0.
Biggest contracts:
$326,085 with Air Force for Trash/Garbage Collection Services - Including Portable Sanitation Services. Taking place in IL. Signed on 2005-10-01. Completion date: 2006-09-30.
$319,876, same as above.Signed on 2004-10-01. Completion date: 2005-09-30.
$313,796, same as above.Signed on 2003-10-01. Completion date: 2004-09-30.
$283,343, same as above.Signed on 2002-10-01. Completion date: 2003-09-30.
TRUE POWER INC (2313 BRADY AVE; small business) : $2,001,725 in 48 contractsfrom 1999 to 2006
Contracts for Power and Hand Pumps, Lease or Rental of Equipment -- Construction, Mining, Excavating, and Highway Maintenance Equipment, Pipe, Tube and Rigid Tubing, Miscellaneous Construction Materials, and moreby Bureau of Reclamation, Air Force, Army Signed by year:2000: $60,547; 2001: $0; 2002: $215,166; 2003: $633,416; 2004: $647,932; 2005: $153,521; 2006: $244,143.
Biggest contracts:
$512,091 with Bureau of Reclamation for Power and Hand Pumps. Signed on 2003-07-15. Completion date: 2003-10-15.
$316,985, same as above.Signed on 2004-04-13. Completion date: 2004-07-01.
$178,260 with Bureau of Reclamation for Lease or Rental of Equipment -- Construction, Mining, Excavating, and Highway Maintenance Equipment. Taking place in CA. Signed on 2003-01-15. Completion date: 2003-05-15.
$117,862 with Bureau of Reclamation for Pipe, Tube and Rigid Tubing. Taking place in NM. Signed on 2004-09-16. Completion date: 2004-10-18.
CITY LAUNDRY & CLEANERS INC (125 S 13TH ST; small business) : $1,761,258 in 37 contractsfrom 2001 to 2006
Contracts for Laundry and DryCleaning Services by Air Force Signed by year:2000: $0; 2001: $384,883; 2002: $384,853; 2003: $418,300; 2004: $402,005; 2005: $165,907; 2006: $5,310.
Biggest contracts:
$291,883 with Air Force for Laundry and DryCleaning Services. Signed on 2001-10-01. Completion date: 2002-09-30.
$251,000, same as above.Signed on 2003-10-01. Completion date: 2004-09-30.
$250,500, same as above.Signed on 2002-10-01. Completion date: 2003-09-30.
$149,600, same as above.Signed on 2005-10-18. Completion date: 2006-11-30.
OPTIKEY, INC (101CONVENTION CTR DR #700; small business) : $1,562,148 in 2 contractsfrom 2005 to 2006
$799,000 with Air Force for Other Defense -- Basic Research (R&D). Signed on 2006-07-03. Completion date: 2007-05-05.
$763,148, same as above.Signed on 2005-09-21. Completion date: 2006-06-19.
BECKLY, SINGLETON CHARTERED IN (530 LAS VEGAS BLVD S)
$299,900 with Navy for Other Special Studies and Analyses. Signed on 2003-01-09. Completion date: 2003-07-12.
ADS ENVIRONMENTAL & CONSTRUCTI (3320 SUNRISE AVENUE, SUITE; small business) : $282,855 in 6 contractsfrom 2003 to 2004
Contracts for Maintenance, Repair or Alteration of Real Property -- Other Non-Building Facilities, Maintenance, Repair or Alteration of Real Property -- Other Administrative Facilities and Service Buildings, Hazardous Substance Removal, Cleanup, and Disposal Services and Operational Support by Air Force, Bureau of Reclamation Signed by year:2000: $0; 2001: $0; 2002: $0; 2003: $9,085; 2004: $273,770; 2005: $0; 2006: $0.
Biggest contracts:
$228,697 with Air Force for Maintenance, Repair or Alteration of Real Property -- Other Non-Building Facilities. Signed on 2004-05-12. Completion date: 2004-05-19.
$42,055 with Air Force for Maintenance, Repair or Alteration of Real Property -- Other Administrative Facilities and Service Buildings. Signed on 2004-05-03. Completion date: 2004-05-27.
$9,085 with Bureau of Reclamation for Hazardous Substance Removal, Cleanup, and Disposal Services and Operational Support. Signed on 2003-06-15. Completion date: 2003-08-15.
$6,182 with Air Force for Maintenance, Repair or Alteration of Real Property -- Other Non-Building Facilities. Signed on 2004-09-16. Completion date: 2004-09-25.
ANDERSON DAIRY INC (801 SEARLES AVE; small business) : $269,155 in 5 contractsfrom 2004 to 2005
Contracts for Food Items For Resale by Defense Commissary Agency Signed by year:2000: $0; 2001: $0; 2002: $0; 2003: $0; 2004: $82,675; 2005: $186,480; 2006: $0.
Biggest contracts:
$88,187 with Defense Commissary Agency for Food Items For Resale. Signed on 2005-04-01. Completion date: 2005-08-31.
$82,675, same as above.Signed on 2004-10-01. Completion date: 2005-02-28.
$46,352, same as above.Signed on 2005-01-01. Completion date: 2005-03-31.
$27,808, same as above.Signed on 2005-08-01. Completion date: 2005-08-31.
DAVIS NURSERY INC (2701 E BONANZA RD; small business) : $166,500 in 3 contractsfrom 2000 to 2004
$75,500 with Air Force for Landscaping/Groundskeeping Services. Signed on 2000-09-25. Completion date: 2001-05-14.
$50,000, same as above.Signed on 2003-02-07. Completion date: 2003-06-23.
$41,000, same as above.Signed on 2004-05-12. Completion date: 2004-04-30.
Top industries in this zip code by the number of employees in 2005:
2002 - 2018 National Fire Incident Reporting System (NFIRS) incidents
According to the data from the years 2002 - 2018 the average number of fires per year is 327. The highest number of fires - 599 took place in 2017, and the least - 0 in 2003. The data has a rising trend.
When looking into fire subcategories, the most incidents belonged to: Outside Fires (54.5%), and Structure Fires (30.9%).
Fire incident types reported to NFIRS in Zip Code 89101


 Nearest zip codes: 89104, 89030, 89106, 89169, 89121, 89109.


 According to the data from the years 2002 - 2018 the average number of fires per year is 327. The highest number of fires - 599 took place in 2017, and the least - 0 in 2003. The data has a rising trend.
 When looking into fire subcategories, the most incidents belonged to: Outside Fires (54.5%), and Structure Fires (30.9%).