Charleston Estates neighborhood in Las Vegas, Nevada (NV), 89107 detailed profile
Settings
X

Business Search - 14 Million verified businesses
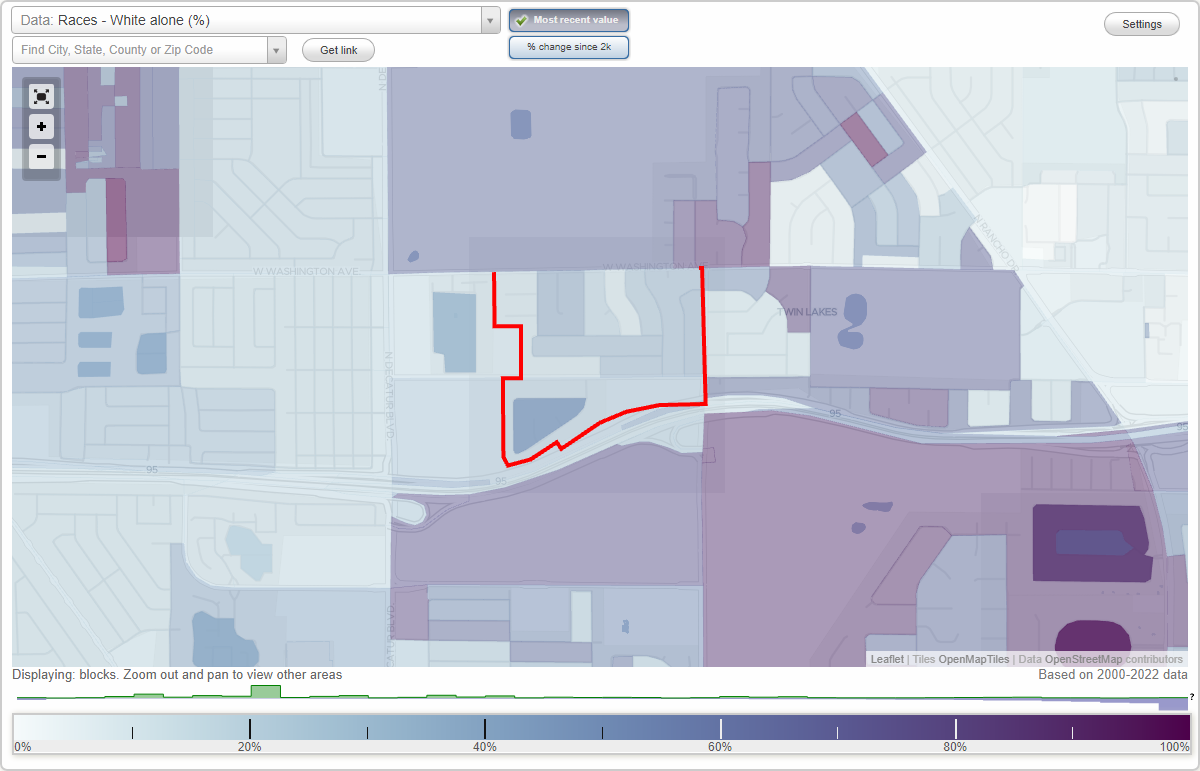
Area: 0.180 square miles
Population: 487
Population density:
| Charleston Estates: | 2,701 people per square mile |
| Las Vegas: | 5,792 people per square mile |

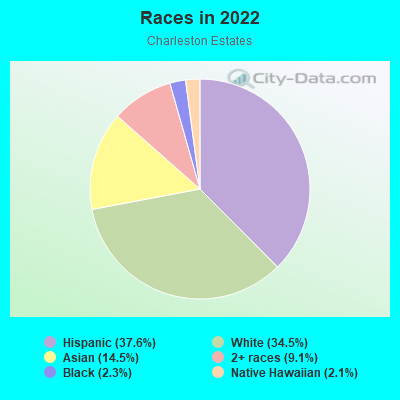
- 18237.6%Hispanic or Latino
- 16734.5%White
- 7014.5%Asian
- 449.1%Two or more races
- 112.3%Black
- 102.1%Native Hawaiian and Other
Pacific Islander
Median household income in 2022:
| Charleston Estates: | $80,499 |
| Las Vegas: | $68,905 |
Distribution of median household income
![Distribution of median household income]()
- 5Less than $10,000
- 14$10,000 to $19,999
- 10$20,000 to $29,999
- 26$30,000 to $39,999
- 31$40,000 to $49,999
- 21$50,000 to $59,999
- 12$60,000 to $74,999
- 23$75,000 to $99,999
- 6$100,000 to $124,999
- 12$125,000 to $149,999
- 18$150,000 to $199,999
- 41$200,000 or more

Distribution of owner-occupied house/condo value
![Distribution of owner-occupied house/condo value]()
- 21Less than $50,000
- 9$50,000 to $99,999
- 2$100,000 to $149,999
- 8$150,000 to $199,999
- 34$200,000 to $249,999
- 11$250,000 to $299,999
- 76$300,000 to $399,999
- 20$400,000 to $499,999
- 8$500,000 to $749,999

Distribution of rent paid by renters
![Distribution of rent paid by renters]()
- 32$400 to $499
- 1$600 to $699
- 3$700 to $799
- 1$800 to $899
- 14$900 to $999
- 12$1,000 to $1,249
- 35$1,250 to $1,499
- 26$1,500 to $1,999

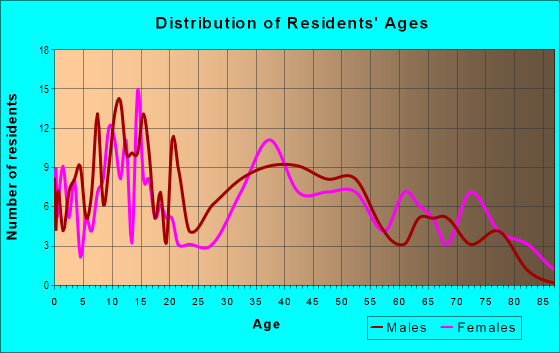
| Males: | 268 |
| Females: | 219 |
Males:
| This neighborhood: | 35.5 years |
| Whole city: | 38.4 years |
| This neighborhood: | 36.3 years |
| Whole city: | 38.9 years |
Average household size:
| Charleston Estates: | 3.6 people |
| Las Vegas: | 2.7 people |
Percentage of family households:
| Charleston Estates: | 57.7% |
| Las Vegas: | 45.8% |
| Here: | 31.5% |
| Las Vegas: | 40.9% |
Percentage of married-couple families with children (among all households):
| Charleston Estates: | 9.9% |
| Las Vegas: | 23.4% |
Percentage of single-mother households (among all households):
| Charleston Estates: | 6.0% |
| Las Vegas: | 10.1% |
Percentage of never married males 15 years old and over:
Percentage of never married females 15 years old and over:
| Charleston Estates: | 34.4% |
| Las Vegas: | 19.7% |
Percentage of never married females 15 years old and over:
| Charleston Estates: | 10.5% |
| city: | 17.0% |
Percentage of people that speak English not well or not at all:
| Charleston Estates: | 8.2% |
| Las Vegas: | 7.0% |
Percentage of people born in this state:
Percentage of people born in another U.S. state:
Percentage of native residents but born outside the U.S.:
Percentage of foreign born residents:
| Here: | 32.3% |
| Las Vegas: | 27.3% |
Percentage of people born in another U.S. state:
| Charleston Estates: | 37.1% |
| Las Vegas: | 49.8% |
Percentage of native residents but born outside the U.S.:
| Here: | 0.6% |
| city: | 1.9% |
Percentage of foreign born residents:
| Here: | 30.0% |
| Las Vegas: | 21.0% |
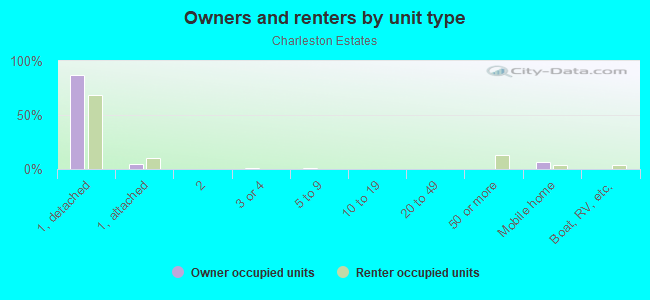
Owner-occupied
Renter-occupied

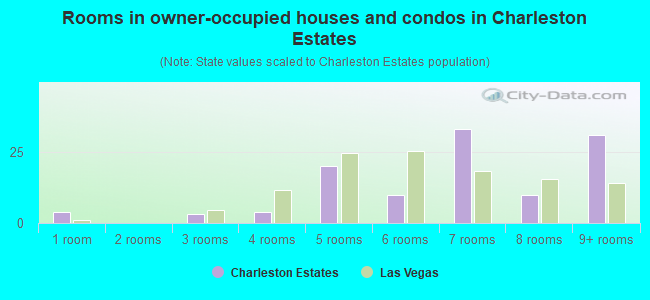
- Rooms in owner-occupied houses and condos in Charleston Estates
- 41 room
- 02 rooms
- 33 rooms
- 44 rooms
- 205 rooms
- 106 rooms
- 337 rooms
- 108 rooms
- 319+ rooms
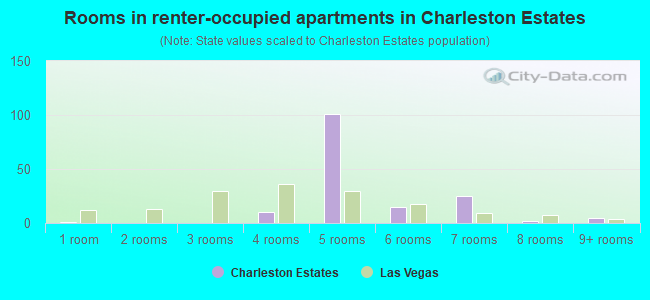
- Rooms in renter-occupied apartments in Charleston Estates
- 11 room
- 02 rooms
- 03 rooms
- 104 rooms
- 1015 rooms
- 156 rooms
- 257 rooms
- 28 rooms
- 59+ rooms
Owner-occupied
Renter-occupied
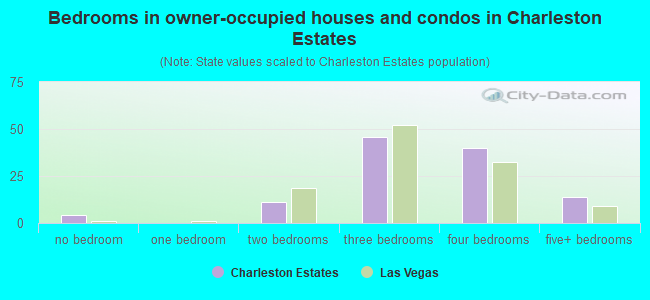
- Bedrooms in owner-occupied houses and condos in Charleston Estates
- 4no bedroom
- 01 bedroom
- 112 bedrooms
- 463 bedrooms
- 404 bedrooms
- 145+ bedrooms
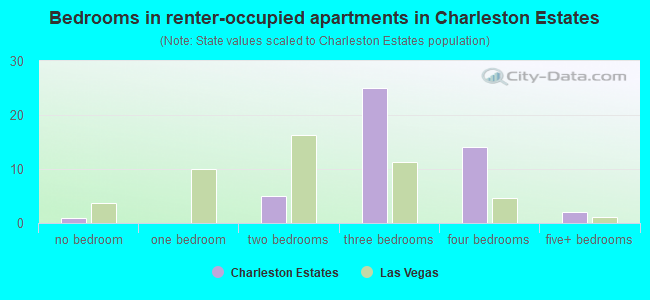
- Bedrooms in renter-occupied apartments in Charleston Estates
- 1no bedroom
- 01 bedroom
- 52 bedrooms
- 253 bedrooms
- 144 bedrooms
- 25+ bedrooms
Average number of cars or other vehicles available in houses/condos:
Average number of cars or other vehicles available in apartments:
| This neighborhood: | 2.3 |
| Las Vegas: | 2.0 |
Average number of cars or other vehicles available in apartments:
| Here: | 2.9 |
| city: | 1.3 |
Percentage of units with a mortgage:
| Charleston Estates: | 76.0% |
| Las Vegas: | 69.3% |
Average estimated value of detached houses in 2022 (100.0% of all units):
| Charleston Estates: | $361,123 |
| Nevada: | $549,327 |
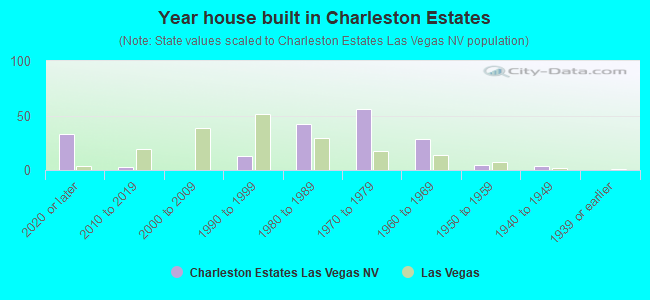
- Year house built in Charleston Estates
- 332020 or later
- 32010 to 2019
- 02000 to 2009
- 131990 to 1999
- 421980 to 1989
- 561970 to 1979
- 281960 to 1969
- 51950 to 1959
- 41940 to 1949
- 01939 or earlier
City-data.com crime index for city in 2020 (higher means more crime):
| City: | 280.7 |
| U.S. average: | 219.5 |
Travel time to work (commute)
![Travel time to work (commute)]()
- 3Less than 5 minutes
- 105 to 9 minutes
- 1710 to 14 minutes
- 2715 to 19 minutes
- 4420 to 24 minutes
- 1825 to 29 minutes
- 3530 to 34 minutes
- 435 to 39 minutes
- 1040 to 44 minutes
- 1845 to 59 minutes
- 860 to 89 minutes

Means of transportation to work
![Means of transportation to work]()
- 76.5%194Drove a car alone
- 20.9%53Carpooled
- 2.0%5Walked
- 0.4%1Other means
- 3.6%9Worked at home

Time leaving home to go to work
![Time leaving home to go to work]()
- 912:00 a.m. to 4:59 a.m.
- 155:00 a.m. to 5:29 a.m.
- 135:30 a.m. to 5:59 a.m.
- 246:00 a.m. to 6:29 a.m.
- 216:30 a.m. to 6:59 a.m.
- 267:00 a.m. to 7:29 a.m.
- 97:30 a.m. to 7:59 a.m.
- 98:00 a.m. to 8:29 a.m.
- 68:30 a.m. to 8:59 a.m.
- 49:00 a.m. to 9:59 a.m.
- 110:00 a.m. to 10:59 a.m.
- 411:00 a.m. to 11:59 a.m.
- 1712:00 p.m. to 3:59 p.m.
- 164:00 p.m. to 11:59 p.m.

Occupations of males:
- Percentage of males in management occupations (except farmers):
Here: 5.5% city: 9.6%
- Percentage of males in business and financial operations occupations:
Here: 3.4% city: 3.6%
- Percentage of males in computer and mathematical occupations:
Here: 10.1% city: 3.4%
- Percentage of males in legal occupations:
Here: 4.9% city: 0.9%
- Percentage of males in education, training, and library occupations:
Here: 4.5% city: 2.5%
- Percentage of males in healthcare practitioners and technical occupations:
Here: 13.4% city: 3.3%
- Percentage of males in service occupations:
Here: 14.7% city: 23.3%
- Percentage of males in sales and office occupations:
Here: 12.8% city: 16.6%
- Percentage of males in construction, extraction, and maintenance occupations:
Here: 12.3% city: 10.6%
- Percentage of males in production occupations:
Here: 3.4% city: 3.3%
- Percentage of males in material moving occupations:
Here: 19.5% city: 5.4%
Occupations of females:
- Percentage of females in business and financial operations occupations:
Here: 6.7% city: 5.7%
- Percentage of females in education, training, and library occupations:
Here: 7.3% city: 8.0%
- Percentage of females in healthcare practitioners and technical occupations:
Here: 6.7% city: 7.4%
- Percentage of females in service occupations:
Here: 24.2% city: 26.5%
- Percentage of females in sales and office occupations:
Here: 54.9% city: 30.5%
Percentage of people 16-64 in Armed Forces:
| Charleston Estates: | 0.2% |
| Las Vegas: | 1.0% |
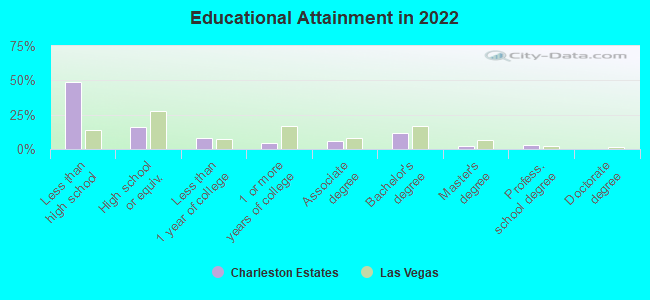
Education in this neighborhood (subdivision or community):
- Percentage of people 3 years and older in K-12 schools:
Charleston Estates: 21.8% Las Vegas: 17.4%
- Percentage of people 3 years and older in undergraduate colleges:
Charleston Estates: 3.3% Las Vegas: 4.2%
- Percentage of people 3 years and older in grad. or professional schools:
Charleston Estates: 2.3% Las Vegas: 1.0%
- Percentage of students K-12 enrolled in private schools:
Charleston Estates: 3.8% Las Vegas: 12.9%
Percentage of population below poverty level:
| Charleston Estates: | 8.7% |
| Las Vegas: | 14.1% |
Median year owner moved in (as recorded in 2022):
Median year renter moved in (as recorded in 2022):
| Charleston Estates: | 2010 |
| Las Vegas: | 2015 |
Median year renter moved in (as recorded in 2022):
| Charleston Estates: | 2017 |
| Las Vegas: | 2020 |
Percentage of married-couple families with both working:
| Charleston Estates: | 122.5% |
| Las Vegas: | 62.0% |
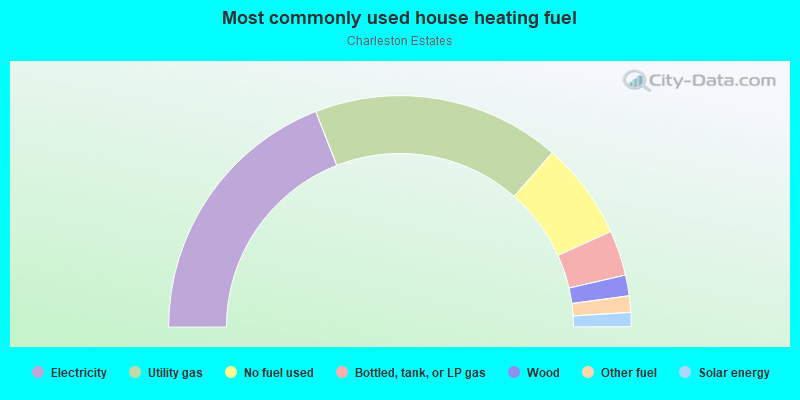
- 38.1%Electricity
- 34.7%Utility gas
- 13.6%No fuel used
- 6.3%Bottled, tank, or LP gas
- 2.9%Wood
- 2.3%Other fuel
- 2.0%Solar energy
Roads and streets:
Snead Dr
Length: 0.38 miles
Directions: E-W, SW-NE
Address range: 4000 to 4499
Directions: E-W, SW-NE
Address range: 4000 to 4499
Fortune Ave
Length: 0.38 miles
Direction: E-W
Address range: 4000 to 4399
Direction: E-W
Address range: 4000 to 4399
Estella Ave
Length: 0.31 miles
Directions: E-W, N-S, SW-NE
Address range: 200 to 599
Directions: E-W, N-S, SW-NE
Address range: 200 to 599
W Bonanza Rd
Length: 0.29 miles
Direction: E-W
Address range: 3900 to 4399
Direction: E-W
Address range: 3900 to 4399
N Valley View Blvd
Length: 0.26 miles
Direction: N-S
Address range: 300 to 849
Direction: N-S
Address range: 300 to 849
Langtry Dr
Length: 0.23 miles
Directions: N-S, SE-NW
Address range: 600 to 799
Directions: N-S, SE-NW
Address range: 600 to 799
Hanford Ave
Length: 0.21 miles
Direction: E-W
Address range: 4200 to 4499
Direction: E-W
Address range: 4200 to 4499
Starks Dr
Length: 0.19 miles
Directions: N-S, SE-NW
Address range: 600 to 899
Directions: N-S, SE-NW
Address range: 600 to 899
Hogan Dr
Length: 0.15 miles
Directions: N-S, SE-NW, SW-NE
Address range: 600 to 807
Directions: N-S, SE-NW, SW-NE
Address range: 600 to 807
Horn St
Length: 0.13 miles
Directions: N-S, SE-NW, SW-NE
Address range: 200 to 499
Directions: N-S, SE-NW, SW-NE
Address range: 200 to 499
St Andrews Cir
Length: 0.09 miles
Direction: E-W
Address range: 4400 to 4499
Direction: E-W
Address range: 4400 to 4499
Thompson Cir
Length: 0.09 miles
Direction: E-W
Address range: 4400 to 4499
Direction: E-W
Address range: 4400 to 4499
Apache Ln
Length: 0.08 miles
Directions: E-W, SW-NE
Address range: 3800 to 3899
Directions: E-W, SW-NE
Address range: 3800 to 3899
Moller Ct (Moller Cir)
Length: 0.06 miles
Directions: N-S, SE-NW
Address range: 200 to 299
Directions: N-S, SE-NW
Address range: 200 to 299
Bolt Dr
Length: 0.05 miles
Direction: N-S
Address range: 600 to 699
Direction: N-S
Address range: 600 to 699
Sabra Ct
Length: 0.03 miles
Direction: SE-NW
Address range: 300 to 399
Direction: SE-NW
Address range: 300 to 399