Estimated zip code population in 2022: 19,878 Zip code population in 2010: 20,483 Zip code population in 2000: 20,395
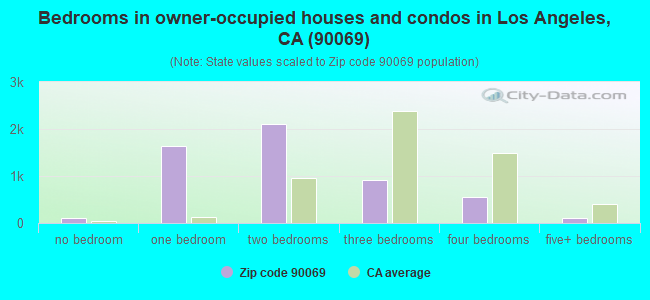
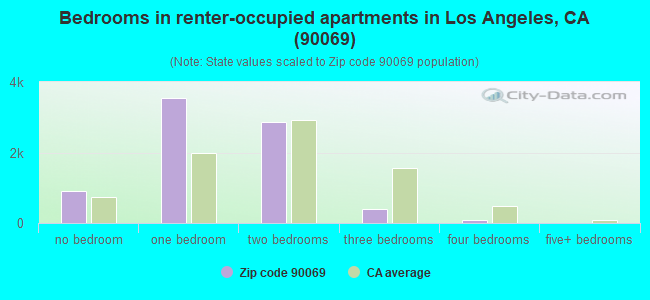
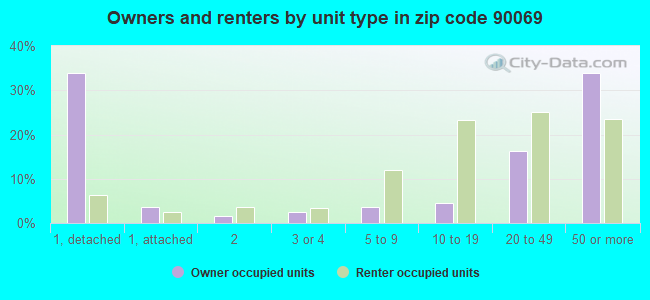
Houses and condos: 15,314 Renter-occupied apartments: 7,810
% of renters here:
59%
State:
44%
March 2022 cost of living index in zip code 90069: 138.7 (high, U.S. average is 100)
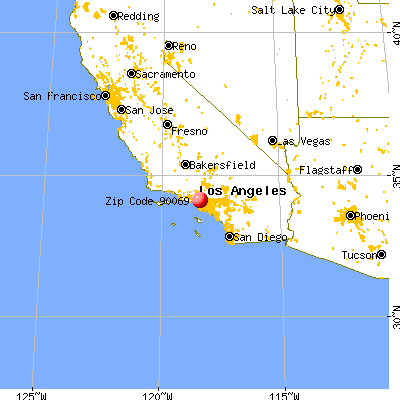
Land area: 2.1 sq. mi. Water area: 0.0 sq. mi.
Population density: 9,402 people per square mile
(high).
OSM Map
General Map
Google Map
MSN Map
OSM Map
General Map
Google Map
MSN Map
OSM Map
General Map
Google Map
MSN Map
OSM Map
General Map
Google Map
MSN Map
Please wait while loading the map...
Real estate property taxes paid for housing units in 2022:
This zip code:
0.7% ($8,143)
California:
0.7% ($4,831)
Median real estate property taxes paid for housing units with mortgages in 2022: $8,921 (0.8%) Median real estate property taxes paid for housing units with no mortgage in 2022: $6,898 (0.6%)
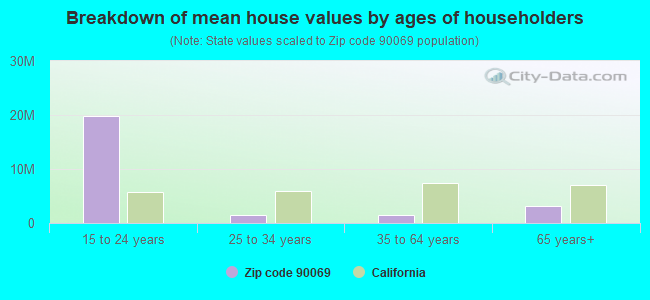
Estimated median house/condo value in 2022: $1,114,406
90069:
$1,114,406
California:
$715,900
According to our research of California and other state lists, there were 10 registered sex offenders living in 90069 zip code as of April 27, 2024. The ratio of all residents to sex offenders in zip code 90069 is 2,073 to 1. The ratio of registered sex offenders to all residents in this zip code is much lower than the state average.
Median resident age:
This zip code:
44.7 years
California median age:
37.9 years
Average household size:
This zip code:
1.5 people
California:
2.8 people
Averages for the 2020 tax year for zip code 90069, filed in 2021:
Average Adjusted Gross Income (AGI) in 2020: $288,872 (Individual Income Tax Returns)
Here:
$288,872
State:
$95,910
Salary/wage: $143,193 (reported on 75.3% of returns)
Here:
$143,193
State:
$77,331
(% of AGI for various income ranges: 1072.3% for AGIs below $25k, 4082.8% for AGIs $25k-50k, 7955.4% for AGIs $50k-75k, 11723.8% for AGIs $75k-100k, 21579.5% for AGIs $100k-200k, 181397.6% for AGIs over 200k)
Taxable interest for individuals: $8,155 (reported on 43.5% of returns)
This zip code:
$8,155
California:
$2,294
(% of AGI for various income ranges: 53.1% for AGIs below $25k, 122.7% for AGIs $25k-50k, 78.9% for AGIs $50k-75k, 140.1% for AGIs $75k-100k, 326.2% for AGIs $100k-200k, 7660.8% for AGIs over 200k)
Ordinary dividends: $22,607 (reported on 35.9% of returns)
Here:
$22,607
State:
$10,949
(% of AGI for various income ranges: 117.5% for AGIs below $25k, 235.7% for AGIs $25k-50k, 215.3% for AGIs $50k-75k, 368.2% for AGIs $75k-100k, 749.6% for AGIs $100k-200k, 17470.2% for AGIs over 200k)
Net capital gain/loss in AGI: +$167,913 (reported on 35.9% of returns)
Here:
+$167,913
State:
+$49,306
(% of AGI for various income ranges: 50.1% for AGIs below $25k, 254.0% for AGIs $25k-50k, 263.5% for AGIs $50k-75k, 392.1% for AGIs $75k-100k, 873.3% for AGIs $100k-200k, 154097.2% for AGIs over 200k)
Profit/loss from business: +$25,834 (reported on 29.8% of returns)
Here:
+$25,834
State:
+$15,671
(% of AGI for various income ranges: 350.8% for AGIs below $25k, 653.5% for AGIs $25k-50k, 717.3% for AGIs $50k-75k, 1008.8% for AGIs $75k-100k, 1489.1% for AGIs $100k-200k, 10924.2% for AGIs over 200k)
Taxable individual retirement arrangement distribution: $27,524 (reported on 6.6% of returns)
90069:
$27,524
California:
$23,505
(% of AGI for various income ranges: 83.6% for AGIs below $25k, 156.6% for AGIs $25k-50k, 171.2% for AGIs $50k-75k, 254.4% for AGIs $75k-100k, 511.4% for AGIs $100k-200k, 2099.4% for AGIs over 200k)
Self-employed (Keogh) retirement plans: $31,276 (reported on 1.9% of returns)
90069:
$31,276
California:
$30,163
(% of AGI for various income ranges: 11.8% for AGIs below $25k, 27.5% for AGIs $50k-75k, 47.5% for AGIs $75k-100k, 121.0% for AGIs $100k-200k, 1093.0% for AGIs over 200k)
Total itemized deductions: $66,323 (reported on 23.6% of returns)
Here:
$66,323
State:
$39,517
(% of AGI for various income ranges: 261.8% for AGIs below $25k, 494.5% for AGIs $25k-50k, 643.4% for AGIs $50k-75k, 1007.8% for AGIs $75k-100k, 2007.8% for AGIs $100k-200k, 31156.0% for AGIs over 200k)
Charity contributions: $37,596 (reported on 19.0% of returns)
Here:
$37,596
State:
$12,598
(% of AGI for various income ranges: 11.3% for AGIs below $25k, 40.7% for AGIs $25k-50k, 58.1% for AGIs $50k-75k, 96.2% for AGIs $75k-100k, 268.5% for AGIs $100k-200k, 17649.2% for AGIs over 200k)
Taxes paid: $9,553 (reported on 23.4% of returns)
90069:
$9,553
State:
$8,807
(% of AGI for various income ranges: 61.7% for AGIs below $25k, 126.2% for AGIs $25k-50k, 168.3% for AGIs $50k-75k, 325.1% for AGIs $75k-100k, 654.5% for AGIs $100k-200k, 2900.0% for AGIs over 200k)
Earned income credit: $565 (reported on 6.2% of returns)
Here:
$565
State:
$2,074
(% of AGI for various income ranges: 25.1% for AGIs below $25k, 8.1% for AGIs $25k-50k)
Percentage of individuals using paid preparers for their 2020 taxes: 94.1%
Here:
94%
State:
92%
(% for various income ranges: 90.5% for AGIs below $25k, 93.1% for AGIs $25k-50k, 95.1% for AGIs $50k-75k, 94.8% for AGIs $75k-100k, 95.8% for AGIs $100k-200k, 96.3% for AGIs over 200k)
Averages for the 2012 tax year for zip code 90069, filed in 2013:
Average Adjusted Gross Income (AGI) in 2012: $156,001 (Individual Income Tax Returns)
Here:
$156,001
State:
$72,726
Salary/wage: $107,189 (reported on 77.9% of returns)
Here:
$107,189
State:
$59,079
(% of AGI for various income ranges: 60.3% for AGIs below $25k, 74.9% for AGIs $25k-50k, 78.2% for AGIs $50k-75k, 76.9% for AGIs $75k-100k, 76.1% for AGIs $100k-200k, 42.8% for AGIs over 200k)
Taxable interest for individuals: $5,836 (reported on 44.0% of returns)
This zip code:
$5,836
California:
$2,146
(% of AGI for various income ranges: 2.6% for AGIs below $25k, 1.5% for AGIs $25k-50k, 1.0% for AGIs $50k-75k, 0.8% for AGIs $75k-100k, 1.2% for AGIs $100k-200k, 1.8% for AGIs over 200k)
Ordinary dividends: $26,264 (reported on 29.8% of returns)
Here:
$26,264
State:
$9,308
(% of AGI for various income ranges: 4.5% for AGIs below $25k, 2.6% for AGIs $25k-50k, 1.8% for AGIs $50k-75k, 2.1% for AGIs $75k-100k, 2.1% for AGIs $100k-200k, 6.4% for AGIs over 200k)
Net capital gain/loss in AGI: +$97,436 (reported on 28.1% of returns)
Here:
+$97,436
State:
+$30,460
(% of AGI for various income ranges: 0.6% for AGIs $25k-50k, 1.1% for AGIs $50k-75k, 0.9% for AGIs $75k-100k, 2.0% for AGIs $100k-200k, 25.5% for AGIs over 200k)
Profit/loss from business: +$23,198 (reported on 30.0% of returns)
Here:
+$23,198
State:
+$17,064
(% of AGI for various income ranges: 23.0% for AGIs below $25k, 10.7% for AGIs $25k-50k, 7.0% for AGIs $50k-75k, 6.7% for AGIs $75k-100k, 5.5% for AGIs $100k-200k, 2.8% for AGIs over 200k)
Taxable individual retirement arrangement distribution: $23,525 (reported on 7.2% of returns)
90069:
$23,525
California:
$19,557
(% of AGI for various income ranges: 2.9% for AGIs below $25k, 1.8% for AGIs $25k-50k, 1.7% for AGIs $50k-75k, 2.2% for AGIs $75k-100k, 1.8% for AGIs $100k-200k, 0.7% for AGIs over 200k)
Self-employment retirement plans: $24,958 (reported on 2.2% of returns)
90069:
$24,958
California:
$24,530
(% of AGI for various income ranges: 0.2% for AGIs $25k-50k, 0.4% for AGIs $50k-75k, 0.4% for AGIs $75k-100k, 0.5% for AGIs $100k-200k, 0.3% for AGIs over 200k)
Total itemized deductions: $49,917 (19% of AGI, reported on 52.3% of returns)
Here:
$49,917
State:
$34,004
Here:
18.8% of AGI
State:
22.7% of AGI
(% of AGI for various income ranges: 26.5% for AGIs below $25k, 15.8% for AGIs $25k-50k, 16.3% for AGIs $50k-75k, 19.4% for AGIs $75k-100k, 20.9% for AGIs $100k-200k, 15.4% for AGIs over 200k)
Charity contributions: $6,267 (reported on 41.6% of returns)
Here:
$6,267
State:
$4,659
(% of AGI for various income ranges: 1.1% for AGIs below $25k, 1.0% for AGIs $25k-50k, 1.2% for AGIs $50k-75k, 1.4% for AGIs $75k-100k, 1.4% for AGIs $100k-200k, 1.9% for AGIs over 200k)
Taxes paid: $26,485 (reported on 52.1% of returns)
90069:
$26,485
State:
$14,448
(% of AGI for various income ranges: 6.0% for AGIs below $25k, 3.9% for AGIs $25k-50k, 4.9% for AGIs $50k-75k, 7.7% for AGIs $75k-100k, 9.6% for AGIs $100k-200k, 9.6% for AGIs over 200k)
Earned income credit: $638 (reported on 8.4% of returns)
Here:
$638
State:
$2,286
(% of AGI for various income ranges: 1.5% for AGIs below $25k)
Percentage of individuals using paid preparers for their 2012 taxes: 67.3%
Here:
67%
State:
64%
(% for various income ranges: 62.5% for AGIs below $25k, 59.9% for AGIs $25k-50k, 62.6% for AGIs $50k-75k, 66.2% for AGIs $75k-100k, 75.0% for AGIs $100k-200k, 89.0% for AGIs over 200k)
Averages for the 2004 tax year for zip code 90069, filed in 2005:
Average Adjusted Gross Income (AGI) in 2004: $101,018 (Individual Income Tax Returns)
Here:
$101,018
State:
$58,600
Salary/wage: $89,052 (reported on 76.2% of returns)
Here:
$89,052
State:
$49,455
(% of AGI for various income ranges: 67.8% for AGIs $10k-25k, 79.3% for AGIs $25k-50k, 81.4% for AGIs $50k-75k, 79.2% for AGIs $75k-100k, 60.2% for AGIs over 100k)
Taxable interest for individuals: $5,657 (reported on 54.4% of returns)
This zip code:
$5,657
California:
$2,365
(% of AGI for various income ranges: 4.1% for AGIs $10k-25k, 2.0% for AGIs $25k-50k, 2.1% for AGIs $50k-75k, 1.8% for AGIs $75k-100k, 3.1% for AGIs over 100k)
Taxable dividends: $8,314 (reported on 34.5% of returns)
Here:
$8,314
State:
$4,746
(% of AGI for various income ranges: 3.3% for AGIs $10k-25k, 2.2% for AGIs $25k-50k, 1.7% for AGIs $50k-75k, 2.1% for AGIs $75k-100k, 2.9% for AGIs over 100k)
Net capital gain/loss: +$31,363 (reported on 33.2% of returns)
Here:
+$31,363
State:
+$23,418
(% of AGI for various income ranges: 0.6% for AGIs $10k-25k, 1.1% for AGIs $25k-50k, 1.3% for AGIs $50k-75k, 1.9% for AGIs $75k-100k, 13.4% for AGIs over 100k)
Profit/loss from business: +$21,144 (reported on 30.2% of returns)
Here:
+$21,144
State:
+$16,826
(% of AGI for various income ranges: 17.0% for AGIs $10k-25k, 9.0% for AGIs $25k-50k, 5.7% for AGIs $50k-75k, 5.8% for AGIs $75k-100k, 5.3% for AGIs over 100k)
IRA payment deduction: $2,946 (reported on 4.0% of returns)
90069:
$2,946
California:
$3,192
(% of AGI for various income ranges: 0.4% for AGIs $10k-25k, 0.4% for AGIs $25k-50k, 0.2% for AGIs $50k-75k, 0.2% for AGIs $75k-100k, 0.0% for AGIs over 100k)
Self-employed pension: $20,678 (reported on 2.7% of returns)
Here:
$20,678
California:
$17,688
(% of AGI for various income ranges: 0.2% for AGIs $10k-25k, 0.4% for AGIs $25k-50k, 0.3% for AGIs $50k-75k, 0.5% for AGIs $75k-100k, 0.6% for AGIs over 100k)
Total itemized deductions: $37,367 (22% of AGI, reported on 53.7% of returns)
Here:
$37,367
State:
$28,113
Here:
21.9% of AGI
State:
25.3% of AGI
(% of AGI for various income ranges: 25.8% for AGIs $10k-25k, 20.8% for AGIs $25k-50k, 21.6% for AGIs $50k-75k, 24.5% for AGIs $75k-100k, 17.8% for AGIs over 100k)
Charity contributions deductions: $4,150 (2% of AGI, reported on 46.6% of returns)
Here:
$4,150
State:
$3,923
Here:
2.3% of AGI
State:
3.3% of AGI
(% of AGI for various income ranges: 1.5% for AGIs $10k-25k, 1.9% for AGIs $25k-50k, 1.8% for AGIs $50k-75k, 2.1% for AGIs $75k-100k, 1.9% for AGIs over 100k)
Total tax: $23,608 (reported on 85.8% of returns)
90069:
$23,608
State:
$10,761
(% of AGI for various income ranges: 7.1% for AGIs $10k-25k, 10.1% for AGIs $25k-50k, 12.9% for AGIs $50k-75k, 14.1% for AGIs $75k-100k, 22.5% for AGIs over 100k)
Earned income credit: $492 (reported on 6.9% of returns)
Here:
$492
State:
$1,763
Percentage of individuals using paid preparers for their 2004 taxes: 71.3%
Here:
71%
State:
66%
(% for various income ranges: 66.3% for AGIs below $10k, 66.7% for AGIs $10k-25k, 66.0% for AGIs $25k-50k, 68.2% for AGIs $50k-75k, 73.5% for AGIs $75k-100k, 86.9% for AGIs over 100k)
Likely homosexual households (counted as self-reported same-sex unmarried-partner households)
Lesbian couples: 0.3% of all households
Gay men: 4.8% of all households
Household received Food Stamps/SNAP in the past 12 months: 1,055 Household did not receive Food Stamps/SNAP in the past 12 months: 12,043
Women who had a birth in the past 12 months: 144 (102 now married, 42 unmarried) Women who did not have a birth in the past 12 months: 4,467 (1,103 now married, 3,391 unmarried)
Housing units in zip code 90069 with a mortgage: 3,912 (323 second mortgage, 336 both second mortgage and home equity loan) Median monthly owner costs for units with a mortgage: $3,876 Median monthly owner costs for units without a mortgage: $1,434
Residents with income below the poverty level in 2022:
This zip code:
11.0%
Whole state:
12.2%
Residents with income below 50% of the poverty level in 2022:
This zip code:
6.0%
Whole state:
6.2%
Median number of rooms in houses and condos:
Here:
4.4
State:
6.0
Median number of rooms in apartments:
Here:
3.4
State:
3.9
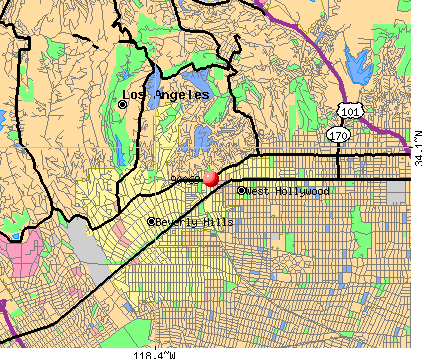
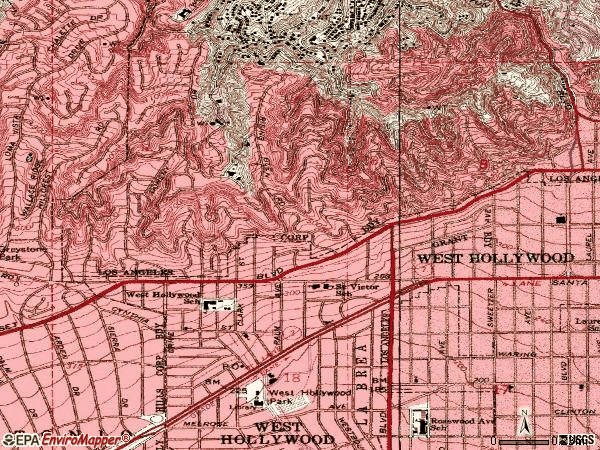
Notable locations in this zip code not listed on our city pages
Notable locations in zip code 90069: Hollywood Film Archive Library (A), West Hollywood Branch County of Los Angeles Public Library (B), Pacific Design Center (C), West Hollywood Sheriffs Station (D), West Hollywood County Building (E), Mac Center For Art And Architecture (F), Globe Playhouse (G), Sunset Tower (H), Los Angeles County Fire Department Station 7 (I). Display/hide their locations on the map
Churches in zip code 90069 include: First Baptist Church of Beverly Hills (A), Saint Victors Roman Catholic Church (B), West Hollywood Community Church (C), West Hollywood Foursquare Church (D). Display/hide their locations on the map
883 married couples with children.
208 single-parent households (9 men, 199 women).
74.0% of residents of 90069 zip code speak English at home.
6.9% of residents speak Spanish at home (72% very well, 21% well, 5% not well, 2% not at all).
13.5% of residents speak other Indo-European language at home (75% very well, 14% well, 9% not well, 2% not at all).
4.3% of residents speak Asian or Pacific Island language at home (75% very well, 13% well, 11% not well, 1% not at all).
1.0% of residents speak other language at home (54% very well, 39% well, 7% not well).
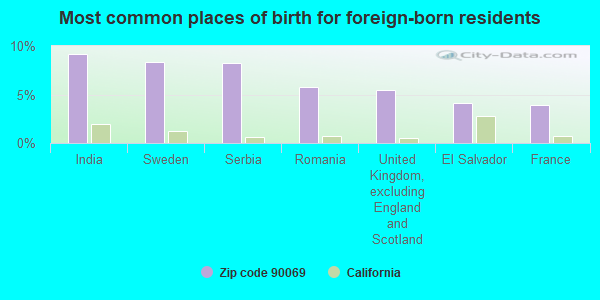
Foreign born population: 4,569 (23.0%) (63.8% of them are naturalized citizens)
This zip code:
23.0%
Whole state:
26.7%
9%India
8%Sweden
8%Serbia
6%Romania
5%United Kingdom, excluding England and Scotland
4%El Salvador
4%France
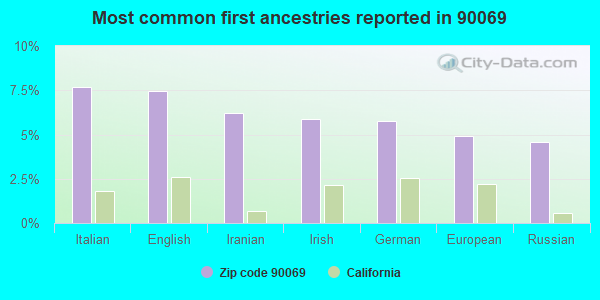
8%Italian
7%English
6%Iranian
6%Irish
6%German
5%European
5%Russian
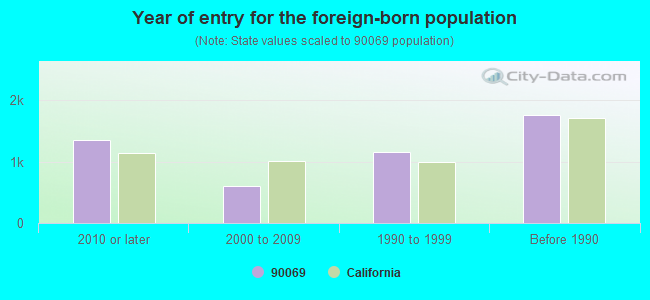
Year of entry for the foreign-born population
1,3542010 or later
5992000 to 2009
1,1651990 to 1999
1,763Before 1990
Major facilities with environmental interests located in this zip code:
GEHRKE CHEVRON (1107 N LA CIENIGA in WEST HOLLYWOOD, CA) . Federal Facility
STATE MASTER (California - Hazardous Waste Tracking) - HAZARDOU WASTE PROGRAM Small Quantity Generators, between 100 kg and 1000 kg of hazardous waste/month (Resource Conservation and Recovery Act (tracking hazardous waste)) - notification STATE MASTER (California - Used Oil Recycling System ) - USED OIL RECYCLING Organizations: CHEVRON PRODUCTS CO (CONTACT/OWNER)
Alternative names: CHEVRON STATION NO 98744, GEHRKE CAR SERVICE, GEHRKE CHEVRON SERVICE
AGAPIOU ROLLS ROYCE LTD (9017 SANTA MONICA BLVD in LOS ANGELES, CA)
STATE MASTER (California - Hazardous Waste Tracking) - HAZARDOU WASTE PROGRAM Small Quantity Generators, between 100 kg and 1000 kg of hazardous waste/month (Resource Conservation and Recovery Act (tracking hazardous waste)) - notification Business NAICS classification: OTHER AUTOMOTIVE MECHANICAL AND ELECTRICAL REPAIR AND MAINTENANCE. Organizations: AGAPIOU CHARLES (CONTACT/OWNER)
Alternative names: CHARLES AGAPIOU LTD.
HOLLYWAY CLEANERS (8359 SANTA MONICA BOULEVARD in LOS ANGELES, CA)
STATE MASTER (California - Hazardous Waste Tracking) - HAZARDOU WASTE PROGRAM CRITERIA AND HAZARDOUS AIR POLLUTANT INVENTORY (Inventory of air pollution sources) Small Quantity Generators, between 100 kg and 1000 kg of hazardous waste/month (Resource Conservation and Recovery Act (tracking hazardous waste)) Business SIC classification: DRYCLEANING PLANTS, EXCEPT RUG CLEANING
LACIENEGA 1 HOUR CLEANERS INC (900 N LACIENEGA BLVD in LOS ANGELES, CA)
STATE MASTER (California - Hazardous Waste Tracking) - HAZARDOU WASTE PROGRAM Small Quantity Generators, between 100 kg and 1000 kg of hazardous waste/month (Resource Conservation and Recovery Act (tracking hazardous waste)) - notification Organizations: LEON RUDYAK (CONTACT/OWNER)
Alternative names: LA CIENEGA 1 HOUR DRY CLEANERS INC
JEFFREYS CUSTOM DRY CLEANERS (8917 MELROSE AVE in WEST HOLLYWOOD, CA)
STATE MASTER (California - Hazardous Waste Tracking) - HAZARDOU WASTE PROGRAM Small Quantity Generators, between 100 kg and 1000 kg of hazardous waste/month (Resource Conservation and Recovery Act (tracking hazardous waste)) Alternative names: EFFREY'S CUSTOM DRY CLEANERS
FORMER CANYON CLEANERS (8725 SANTA MONICA BLVD in WEST HOLLYWOOD, CA)
Large Quantity Generators, more that 1000 kg of hazardous waste/month (Resource Conservation and Recovery Act (tracking hazardous waste)) - notification Organizations: 8725 L L C ATTN FRED DEMAVANDI (CONTACT/OWNER)
NEW DIMENSION (9107 W SUNSET BLVD in LOS ANGELES, CA)
Small Quantity Generators, between 100 kg and 1000 kg of hazardous waste/month (Resource Conservation and Recovery Act (tracking hazardous waste)) Small Quantity Generators, between 100 kg and 1000 kg of hazardous waste/month (Resource Conservation and Recovery Act (tracking hazardous waste)) Organizations: DOUGLAS COOPER (CONTACT/OWNER)
Alternative names: NEW DIMENSION STUDIO
CARE CLEANERS AND LAUNDRY (8364 SANTA MONICA BLVD in WEST HOLLYWOOD, CA)
Small Quantity Generators, between 100 kg and 1000 kg of hazardous waste/month (Resource Conservation and Recovery Act (tracking hazardous waste)) Small Quantity Generators, between 100 kg and 1000 kg of hazardous waste/month (Resource Conservation and Recovery Act (tracking hazardous waste)) - notification Organizations: JOE YACOUB (CONTACT/OWNER)
FOTO SPEED (8470 SANTA MONICA BLVD in LOS ANGELES, CA)
Small Quantity Generators, between 100 kg and 1000 kg of hazardous waste/month (Resource Conservation and Recovery Act (tracking hazardous waste)) - notification Organizations: LEO SIEFERT (CONTACT/OWNER)
GIBBONS COLOR LABORATORY INC (606 N ALMONT DR in LOS ANGELES, CA)
Small Quantity Generators, between 100 kg and 1000 kg of hazardous waste/month (Resource Conservation and Recovery Act (tracking hazardous waste)) - notification Organizations: GIBBONS COLOR LAB INC (CONTACT/OWNER)
HANGER CLEANERS (8280 SANTA MONICA BLVD in LOS ANGELES, CA)
Small Quantity Generators, between 100 kg and 1000 kg of hazardous waste/month (Resource Conservation and Recovery Act (tracking hazardous waste)) Organizations: CHUCK WALKER (CONTACT/OWNER)
LA PEER PHOTO LAB (614 N LA PEER in WEST HOLLYWOOD, CA)
Small Quantity Generators, between 100 kg and 1000 kg of hazardous waste/month (Resource Conservation and Recovery Act (tracking hazardous waste)) Organizations: MICHAEL JOSEPH (CONTACT/OWNER)
CELEBRITY CLEANER (10531 PICO BLVD in LOS ANGELES, CA)
Small Quantity Generators, between 100 kg and 1000 kg of hazardous waste/month (Resource Conservation and Recovery Act (tracking hazardous waste)) Organizations: KINSLING CRAIGTRON (CONTACT/OWNER)
Housing units lacking complete plumbing facilities: 0.7% Housing units lacking complete kitchen facilities: 1.9%
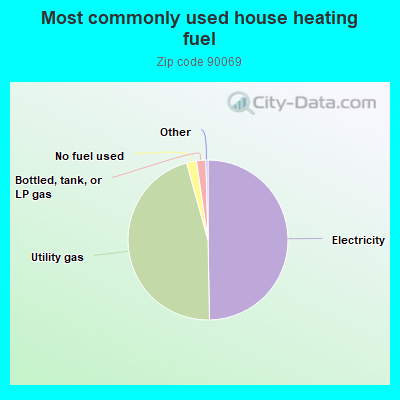
49.7%Electricity
46.0%Utility gas
2.0%No fuel used
1.9%Bottled, tank, or LP gas
Population in 1990: 20,587.
Place of birth for U.S.-born residents:
This state: 5,881
Northeast: 3,348
Midwest: 2,617
South: 2,295
West: 680
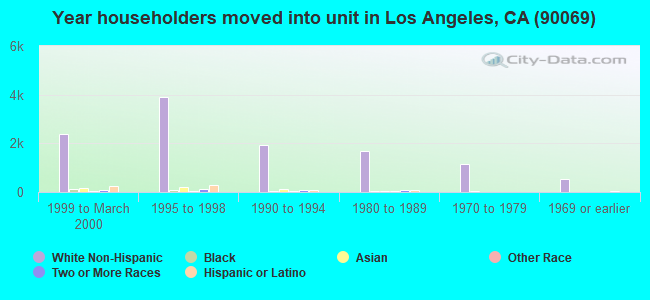
49% of the 90069 zip code residents lived in the same house 5 years ago. Out of people who lived in different houses, 65% lived in this county. Out of people who lived in different counties, 50% lived in California.
87% of the 90069 zip code residents lived in the same house 1 year ago. Out of people who lived in different houses, 58% moved from this county. Out of people who lived in different houses, 14% moved from different county within same state. Out of people who lived in different houses, 24% moved from different state. Out of people who lived in different houses, 4% moved from abroad.
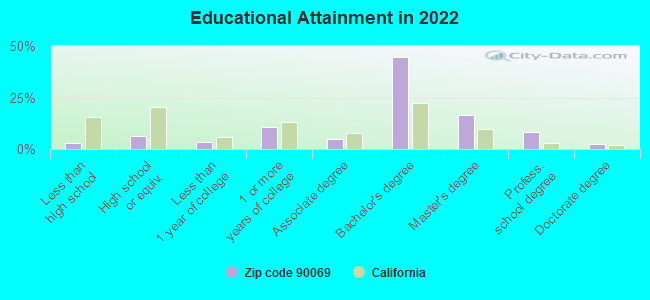
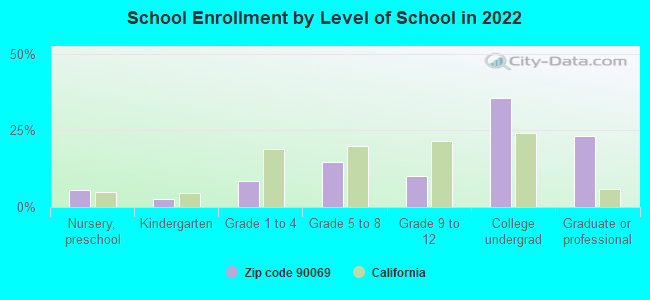
Private vs. public school enrollment:
Students in private schools in grades 1 to 8 (elementary and middle school): 250
Here:
57.7%
California:
10.5%
Students in private schools in grades 9 to 12 (high school): 66
Here:
36.8%
California:
8.5%
Students in private undergraduate colleges: 325
Here:
50.1%
California:
15.9%
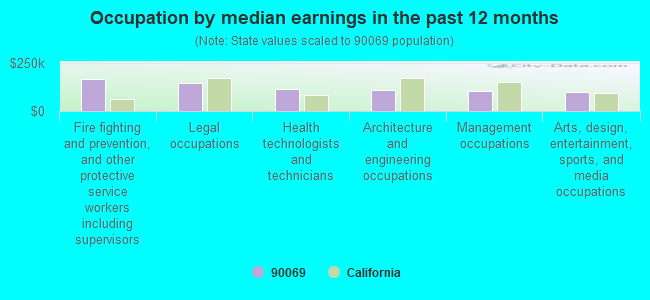
Occupation by median earnings in the past 12 months ($)
163,721Fire fighting and prevention, and other protective service workers including supervisors
142,725Legal occupations
111,545Health technologists and technicians
107,191Architecture and engineering occupations
105,311Management occupations
99,924Arts, design, entertainment, sports, and media occupations
Companies with federal contracts located in this zip code:
ENDEMOL USA HOLDING INC (9255 W SUNSET BLVD in WEST HOLLYWOOD, CA) : $467,059 in 9 contractsfrom 2002 to 2006
Contracts for Miscellaneous Items by Department of Defense, American Forces Information Service Signed by year:2000: $0; 2001: $0; 2002: $52,800; 2003: $51,696; 2004: $58,247; 2005: $227,938; 2006: $76,378.
Biggest contracts:
$77,724 with Department of Defense for Miscellaneous Items. Signed on 2005-11-07. Completion date: 2005-12-05.
$67,260 with American Forces Information Service for Miscellaneous Items. Signed on 2005-03-21. Completion date: 2005-06-15.
$58,247, same as above.Signed on 2004-02-12. Completion date: 2004-06-15.
$53,808, same as above.Signed on 2005-03-22. Completion date: 2005-03-31.
AGENCY FOR THE PERFORMING ARTS (9200 SUNSET BLVD in LOS ANGELES, CA; small business) : $61,000 in 2 contractsfrom 1999 to 2000
$35,000 with Army for Other Professional Services. Taking place in VA. Signed on 2000-11-03. Completion date: 2000-12-10.
$26,000 with Army for Other Transportation Travel and Relocation Services. Taking place in DC. Signed on 1999-11-05. Completion date: 1999-12-12.
EDGROUP PRODUCTIONS, INC (9312 NIGHTINGALE DRIVE in LOS ANGELES, CA; small business)
$3,085 with Navy for Books and Pamphlets. Signed on 2003-08-29. Completion date: 2003-09-12.
Top industries in this zip code by the number of employees in 2005:
Arts, Entertainment, and Recreation: Agents and Managers for Artists, Athletes, Entertainers, and Other Public Figures (50-99: 1, 20-49: 1, 10-19: 4, 5-9: 13, 1-4: 57)
Management of Companies and Enterprises: Offices of Other Holding Companies (250-499: 1)
People in group quarters in 2010:
6 people in other noninstitutional facilities
Fatal accident statistics in 2014:
Fatal accident count: 2
Vehicles involved in fatal accidents: 3
Fatal accidents caused by drunken drivers: 2
Fatalities: 2
Persons involved in fatal accidents: 4
Pedestrians involved in fatal accidents: 1
Fatal accident statistics in 2013:
Fatal accident count: 2
Vehicles involved in fatal accidents: 2
Fatal accidents caused by drunken drivers: 1
Fatalities: 2
Persons involved in fatal accidents: 2
Pedestrians involved in fatal accidents: 3
Home Mortgage Disclosure Act Aggregated Statistics For Year 2009 (Based on 2 full and 10 partial tracts)
A) FHA, FSA/RHS & VA Home Purchase Loans
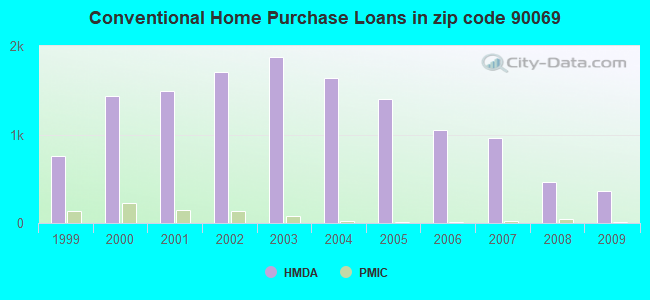
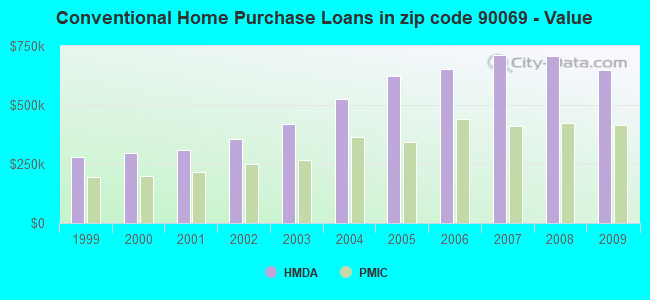
B) Conventional Home Purchase Loans
C) Refinancings
D) Home Improvement Loans
E) Loans on Dwellings For 5+ Families
F) Non-occupant Loans on < 5 Family Dwellings (A B C & D)
Number
Average Value
Number
Average Value
Number
Average Value
Number
Average Value
Number
Average Value
Number
Average Value
LOANS ORIGINATED
58
$405,182
361
$648,382
1,114
$491,484
34
$344,976
18
$1,568,162
155
$611,242
APPLICATIONS APPROVED, NOT ACCEPTED
5
$390,514
52
$673,508
144
$457,999
3
$243,810
0
$0
24
$338,654
APPLICATIONS DENIED
14
$413,523
111
$800,642
501
$533,970
28
$440,148
5
$1,200,538
68
$523,301
APPLICATIONS WITHDRAWN
16
$539,037
91
$585,249
276
$470,356
11
$268,728
2
$1,669,150
30
$395,998
FILES CLOSED FOR INCOMPLETENESS
2
$213,785
13
$585,552
82
$592,145
1
$412,250
0
$0
21
$380,911
Aggregated Statistics For Year 2008 (Based on 2 full and 10 partial tracts)
A) FHA, FSA/RHS & VA Home Purchase Loans
B) Conventional Home Purchase Loans
C) Refinancings
D) Home Improvement Loans
E) Loans on Dwellings For 5+ Families
F) Non-occupant Loans on < 5 Family Dwellings (A B C & D)
Number
Average Value
Number
Average Value
Number
Average Value
Number
Average Value
Number
Average Value
Number
Average Value
LOANS ORIGINATED
14
$450,981
465
$706,548
650
$635,490
36
$339,913
48
$2,213,448
146
$581,228
APPLICATIONS APPROVED, NOT ACCEPTED
11
$468,997
119
$616,866
147
$545,848
6
$372,840
5
$1,654,314
54
$431,765
APPLICATIONS DENIED
4
$353,362
191
$1,005,035
362
$812,173
27
$693,929
8
$2,402,708
72
$767,374
APPLICATIONS WITHDRAWN
4
$574,810
102
$626,377
148
$584,359
20
$493,708
3
$2,738,320
32
$603,015
FILES CLOSED FOR INCOMPLETENESS
0
$0
41
$1,391,150
58
$728,269
7
$398,753
0
$0
13
$1,880,020
Aggregated Statistics For Year 2007 (Based on 2 full and 10 partial tracts)
B) Conventional Home Purchase Loans
C) Refinancings
D) Home Improvement Loans
E) Loans on Dwellings For 5+ Families
F) Non-occupant Loans on < 5 Family Dwellings (A B C & D)
Number
Average Value
Number
Average Value
Number
Average Value
Number
Average Value
Number
Average Value
LOANS ORIGINATED
965
$711,270
1,066
$756,611
104
$644,512
67
$2,626,504
298
$731,874
APPLICATIONS APPROVED, NOT ACCEPTED
211
$716,797
284
$657,584
20
$296,492
2
$971,250
65
$577,486
APPLICATIONS DENIED
345
$971,991
578
$901,417
48
$456,247
8
$1,080,012
122
$579,167
APPLICATIONS WITHDRAWN
166
$948,670
218
$822,284
26
$689,886
3
$1,325,843
57
$889,111
FILES CLOSED FOR INCOMPLETENESS
39
$890,054
70
$875,290
5
$239,926
3
$2,850,173
13
$968,872
Aggregated Statistics For Year 2006 (Based on 2 full and 10 partial tracts)
B) Conventional Home Purchase Loans
C) Refinancings
D) Home Improvement Loans
E) Loans on Dwellings For 5+ Families
F) Non-occupant Loans on < 5 Family Dwellings (A B C & D)
G) Loans On Manufactured Home Dwelling (A B C & D)
Number
Average Value
Number
Average Value
Number
Average Value
Number
Average Value
Number
Average Value
Number
Average Value
LOANS ORIGINATED
1,053
$654,127
1,305
$677,164
151
$577,417
39
$1,916,572
344
$657,692
1
$12,050
APPLICATIONS APPROVED, NOT ACCEPTED
234
$571,268
233
$617,624
14
$586,304
1
$180,780
50
$888,048
0
$0
APPLICATIONS DENIED
380
$715,094
528
$777,778
60
$454,659
2
$1,209,635
128
$821,343
3
$154,150
APPLICATIONS WITHDRAWN
257
$707,150
365
$696,689
40
$635,861
0
$0
59
$787,945
0
$0
FILES CLOSED FOR INCOMPLETENESS
37
$710,416
73
$649,734
10
$826,742
0
$0
13
$1,109,025
0
$0
Aggregated Statistics For Year 2005 (Based on 2 full and 10 partial tracts)
B) Conventional Home Purchase Loans
C) Refinancings
D) Home Improvement Loans
E) Loans on Dwellings For 5+ Families
F) Non-occupant Loans on < 5 Family Dwellings (A B C & D)
G) Loans On Manufactured Home Dwelling (A B C & D)
Number
Average Value
Number
Average Value
Number
Average Value
Number
Average Value
Number
Average Value
Number
Average Value
LOANS ORIGINATED
1,400
$622,561
1,703
$566,969
177
$459,548
63
$1,776,151
402
$572,559
0
$0
APPLICATIONS APPROVED, NOT ACCEPTED
208
$597,264
272
$507,534
26
$560,540
2
$658,810
58
$647,761
1
$158,060
APPLICATIONS DENIED
324
$644,246
565
$568,677
100
$252,029
2
$807,720
115
$593,700
0
$0
APPLICATIONS WITHDRAWN
246
$658,954
434
$497,863
39
$561,767
2
$913,845
68
$687,122
2
$140,745
FILES CLOSED FOR INCOMPLETENESS
45
$756,254
154
$515,837
12
$102,511
0
$0
19
$563,178
0
$0
Aggregated Statistics For Year 2004 (Based on 2 full and 10 partial tracts)
A) FHA, FSA/RHS & VA Home Purchase Loans
B) Conventional Home Purchase Loans
C) Refinancings
D) Home Improvement Loans
E) Loans on Dwellings For 5+ Families
F) Non-occupant Loans on < 5 Family Dwellings (A B C & D)
G) Loans On Manufactured Home Dwelling (A B C & D)
Number
Average Value
Number
Average Value
Number
Average Value
Number
Average Value
Number
Average Value
Number
Average Value
Number
Average Value
LOANS ORIGINATED
2
$181,755
1,640
$526,901
2,283
$477,344
125
$427,392
78
$2,026,574
430
$424,402
4
$57,218
APPLICATIONS APPROVED, NOT ACCEPTED
0
$0
236
$485,066
361
$488,274
23
$480,379
0
$0
54
$428,594
0
$0
APPLICATIONS DENIED
0
$0
396
$563,827
581
$503,832
73
$238,501
0
$0
111
$522,031
0
$0
APPLICATIONS WITHDRAWN
0
$0
264
$517,823
363
$449,572
27
$247,385
9
$2,149,218
41
$458,532
0
$0
FILES CLOSED FOR INCOMPLETENESS
0
$0
61
$466,762
151
$430,743
5
$300,098
0
$0
19
$432,074
0
$0
Aggregated Statistics For Year 2003 (Based on 2 full and 10 partial tracts)
A) FHA, FSA/RHS & VA Home Purchase Loans
B) Conventional Home Purchase Loans
C) Refinancings
D) Home Improvement Loans
E) Loans on Dwellings For 5+ Families
F) Non-occupant Loans on < 5 Family Dwellings (A B C & D)
Number
Average Value
Number
Average Value
Number
Average Value
Number
Average Value
Number
Average Value
Number
Average Value
LOANS ORIGINATED
4
$106,018
1,879
$419,420
4,521
$369,406
45
$80,637
102
$1,301,622
579
$341,987
APPLICATIONS APPROVED, NOT ACCEPTED
0
$0
298
$485,585
703
$384,098
25
$104,092
4
$999,625
72
$311,657
APPLICATIONS DENIED
2
$28,950
340
$511,804
873
$405,961
35
$101,591
6
$742,993
146
$376,704
APPLICATIONS WITHDRAWN
0
$0
245
$440,607
645
$359,152
15
$931,513
3
$5,349,330
78
$307,389
FILES CLOSED FOR INCOMPLETENESS
0
$0
50
$465,151
213
$326,712
7
$53,339
11
$2,157,538
22
$320,325
Aggregated Statistics For Year 2002 (Based on 2 full and 10 partial tracts)
A) FHA, FSA/RHS & VA Home Purchase Loans
B) Conventional Home Purchase Loans
C) Refinancings
D) Home Improvement Loans
E) Loans on Dwellings For 5+ Families
F) Non-occupant Loans on < 5 Family Dwellings (A B C & D)
Number
Average Value
Number
Average Value
Number
Average Value
Number
Average Value
Number
Average Value
Number
Average Value
LOANS ORIGINATED
13
$179,349
1,708
$354,709
3,388
$366,825
40
$68,758
81
$1,289,623
359
$283,974
APPLICATIONS APPROVED, NOT ACCEPTED
4
$74,048
204
$351,589
525
$365,812
11
$74,660
6
$557,240
51
$267,530
APPLICATIONS DENIED
0
$0
257
$431,031
582
$323,992
35
$89,305
3
$923,810
49
$339,386
APPLICATIONS WITHDRAWN
1
$99,350
219
$439,827
449
$325,076
7
$49,670
2
$4,660,310
49
$309,797
FILES CLOSED FOR INCOMPLETENESS
2
$76,960
79
$392,405
195
$341,100
0
$0
6
$2,399,977
16
$234,376
Aggregated Statistics For Year 2001 (Based on 2 full and 10 partial tracts)
A) FHA, FSA/RHS & VA Home Purchase Loans
B) Conventional Home Purchase Loans
C) Refinancings
D) Home Improvement Loans
E) Loans on Dwellings For 5+ Families
F) Non-occupant Loans on < 5 Family Dwellings (A B C & D)
Number
Average Value
Number
Average Value
Number
Average Value
Number
Average Value
Number
Average Value
Number
Average Value
LOANS ORIGINATED
23
$174,817
1,494
$307,391
2,303
$332,673
86
$67,720
66
$1,074,879
317
$241,000
APPLICATIONS APPROVED, NOT ACCEPTED
2
$153,725
208
$339,088
374
$332,607
18
$60,324
2
$1,455,505
40
$341,384
APPLICATIONS DENIED
5
$202,428
254
$376,920
619
$326,806
83
$47,703
2
$1,712,910
84
$333,068
APPLICATIONS WITHDRAWN
3
$167,407
180
$341,216
395
$303,328
32
$56,156
8
$1,433,012
45
$243,427
FILES CLOSED FOR INCOMPLETENESS
0
$0
39
$354,759
141
$279,891
3
$39,217
21
$1,539,930
16
$278,060
Aggregated Statistics For Year 2000 (Based on 2 full and 10 partial tracts)
A) FHA, FSA/RHS & VA Home Purchase Loans
B) Conventional Home Purchase Loans
C) Refinancings
D) Home Improvement Loans
E) Loans on Dwellings For 5+ Families
F) Non-occupant Loans on < 5 Family Dwellings (A B C & D)
Number
Average Value
Number
Average Value
Number
Average Value
Number
Average Value
Number
Average Value
Number
Average Value
LOANS ORIGINATED
38
$190,569
1,438
$295,487
623
$286,542
102
$87,054
28
$770,239
195
$287,335
APPLICATIONS APPROVED, NOT ACCEPTED
0
$0
228
$345,563
155
$231,394
46
$60,958
0
$0
42
$243,867
APPLICATIONS DENIED
2
$149,730
317
$324,530
365
$315,027
71
$53,346
0
$0
68
$399,068
APPLICATIONS WITHDRAWN
3
$178,650
203
$265,954
181
$198,636
29
$71,349
7
$1,794,550
32
$220,954
FILES CLOSED FOR INCOMPLETENESS
1
$171,610
82
$229,960
73
$368,805
3
$17,487
12
$773,740
12
$204,349
Aggregated Statistics For Year 1999 (Based on 1 full and 5 partial tracts)
A) FHA, FSA/RHS & VA Home Purchase Loans
B) Conventional Home Purchase Loans
C) Refinancings
D) Home Improvement Loans
E) Loans on Dwellings For 5+ Families
F) Non-occupant Loans on < 5 Family Dwellings (A B C & D)
2005 - 2018 National Fire Incident Reporting System (NFIRS) incidents
Based on the data from the years 2005 - 2018 the average number of fire incidents per year is 16. The highest number of fire incidents - 21 took place in 2010, and the least - 11 in 2013. The data has a dropping trend.
When looking into fire subcategories, the most reports belonged to: Structure Fires (55.5%), and Outside Fires (23.9%).
Fire incident types reported to NFIRS in Zip Code 90069


 Nearest zip codes: 90048, 90046, 90211, 90210, 90212, 90036.


 . Federal Facility
 Based on the data from the years 2005 - 2018 the average number of fire incidents per year is 16. The highest number of fire incidents - 21 took place in 2010, and the least - 11 in 2013. The data has a dropping trend.
 When looking into fire subcategories, the most reports belonged to: Structure Fires (55.5%), and Outside Fires (23.9%).