Estimated zip code population in 2022: 19,020 Zip code population in 2010: 21,741 Zip code population in 2000: 21,396
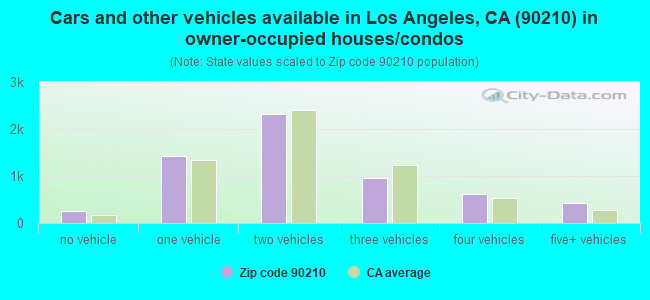
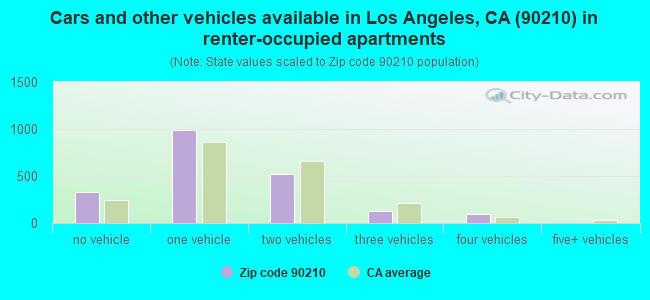
Houses and condos: 9,826 Renter-occupied apartments: 2,066
% of renters here:
26%
State:
44%
March 2022 cost of living index in zip code 90210: 144.6 (very high, U.S. average is 100)
Land area: 10.1 sq. mi. Water area: 0.1 sq. mi.
Population density: 1,878 people per square mile
(low).
OSM Map
General Map
Google Map
MSN Map
OSM Map
General Map
Google Map
MSN Map
OSM Map
General Map
Google Map
MSN Map
OSM Map
General Map
Google Map
MSN Map
Please wait while loading the map...
Real estate property taxes paid for housing units in 2022:
This zip code:
0.5% ($10,292)
California:
0.7% ($4,831)
Median real estate property taxes paid for housing units with mortgages in 2022: $10,330 (0.5%) Median real estate property taxes paid for housing units with no mortgage in 2022: $10,572 (0.5%)
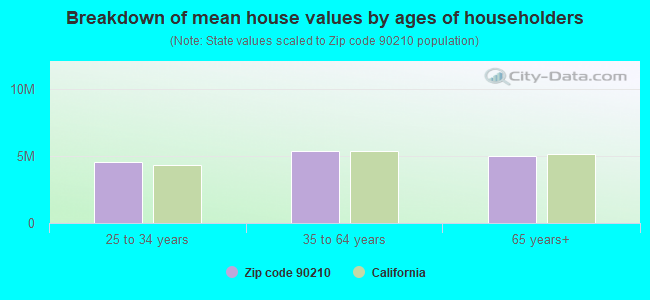
Estimated median house/condo value in 2022: $2,171,698
90210:
$2,171,698
California:
$715,900
According to our research of California and other state lists, there was 1 registered sex offender living in 90210 zip code as of April 27, 2024. The ratio of all residents to sex offenders in zip code 90210 is 21,257 to 1. The ratio of registered sex offenders to all residents in this zip code is much lower than the state average.
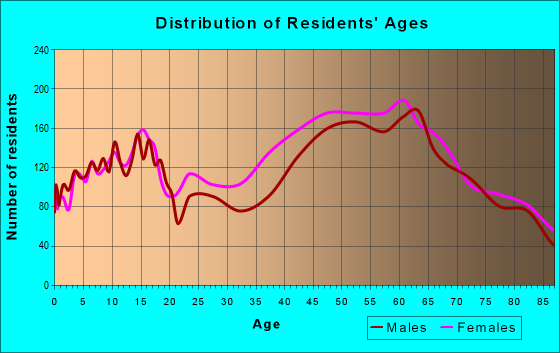
Median resident age:
This zip code:
51.7 years
California median age:
37.9 years
Average household size:
This zip code:
2.4 people
California:
2.8 people
Averages for the 2020 tax year for zip code 90210, filed in 2021:
Average Adjusted Gross Income (AGI) in 2020: $656,660 (Individual Income Tax Returns)
Here:
$656,660
State:
$95,910
Salary/wage: $249,285 (reported on 63.5% of returns)
Here:
$249,285
State:
$77,331
(% of AGI for various income ranges: 1743.1% for AGIs below $25k, 5005.1% for AGIs $25k-50k, 9493.1% for AGIs $50k-75k, 13541.4% for AGIs $75k-100k, 26310.0% for AGIs $100k-200k, 327452.8% for AGIs over 200k)
Taxable interest for individuals: $31,168 (reported on 64.0% of returns)
This zip code:
$31,168
California:
$2,294
(% of AGI for various income ranges: 241.0% for AGIs below $25k, 478.6% for AGIs $25k-50k, 633.4% for AGIs $50k-75k, 1079.0% for AGIs $75k-100k, 2384.3% for AGIs $100k-200k, 42938.2% for AGIs over 200k)
Ordinary dividends: $96,184 (reported on 53.6% of returns)
Here:
$96,184
State:
$10,949
(% of AGI for various income ranges: 334.0% for AGIs below $25k, 649.3% for AGIs $25k-50k, 830.7% for AGIs $50k-75k, 2725.2% for AGIs $75k-100k, 3918.0% for AGIs $100k-200k, 114942.3% for AGIs over 200k)
Net capital gain/loss in AGI: +$349,606 (reported on 55.3% of returns)
Here:
+$349,606
State:
+$49,306
(% of AGI for various income ranges: 297.8% for AGIs below $25k, 742.1% for AGIs $25k-50k, 1806.2% for AGIs $50k-75k, 1437.6% for AGIs $75k-100k, 4446.6% for AGIs $100k-200k, 448842.8% for AGIs over 200k)
Profit/loss from business: +$65,067 (reported on 26.9% of returns)
Here:
+$65,067
State:
+$15,671
(% of AGI for various income ranges: 507.5% for AGIs below $25k, 1143.0% for AGIs $25k-50k, 1273.4% for AGIs $50k-75k, 1776.2% for AGIs $75k-100k, 3762.6% for AGIs $100k-200k, 33964.1% for AGIs over 200k)
Taxable individual retirement arrangement distribution: $64,825 (reported on 9.1% of returns)
90210:
$64,825
California:
$23,505
(% of AGI for various income ranges: 47.6% for AGIs below $25k, 168.8% for AGIs $25k-50k, 337.9% for AGIs $50k-75k, 673.3% for AGIs $75k-100k, 2083.4% for AGIs $100k-200k, 11210.8% for AGIs over 200k)
Self-employed (Keogh) retirement plans: $52,039 (reported on 4.1% of returns)
90210:
$52,039
California:
$30,163
(% of AGI for various income ranges: 164.5% for AGIs $50k-75k, 278.9% for AGIs $100k-200k, 4697.9% for AGIs over 200k)
Total itemized deductions: $114,112 (reported on 41.6% of returns)
Here:
$114,112
State:
$39,517
(% of AGI for various income ranges: 742.8% for AGIs below $25k, 1612.6% for AGIs $25k-50k, 2636.9% for AGIs $50k-75k, 4248.6% for AGIs $75k-100k, 7733.7% for AGIs $100k-200k, 97820.8% for AGIs over 200k)
Charity contributions: $61,282 (reported on 36.2% of returns)
Here:
$61,282
State:
$12,598
(% of AGI for various income ranges: 34.3% for AGIs below $25k, 129.8% for AGIs $25k-50k, 242.4% for AGIs $50k-75k, 476.2% for AGIs $75k-100k, 1260.6% for AGIs $100k-200k, 50555.1% for AGIs over 200k)
Taxes paid: $9,537 (reported on 41.5% of returns)
90210:
$9,537
State:
$8,807
(% of AGI for various income ranges: 172.8% for AGIs below $25k, 299.3% for AGIs $25k-50k, 526.2% for AGIs $50k-75k, 930.0% for AGIs $75k-100k, 1616.9% for AGIs $100k-200k, 6371.8% for AGIs over 200k)
Earned income credit: $986 (reported on 4.7% of returns)
Here:
$986
State:
$2,074
(% of AGI for various income ranges: 41.8% for AGIs below $25k, 33.5% for AGIs $25k-50k)
Percentage of individuals using paid preparers for their 2020 taxes: 92.8%
Here:
93%
State:
92%
(% for various income ranges: 89.9% for AGIs below $25k, 91.6% for AGIs $25k-50k, 93.6% for AGIs $50k-75k, 95.1% for AGIs $75k-100k, 93.2% for AGIs $100k-200k, 94.3% for AGIs over 200k)
Averages for the 2012 tax year for zip code 90210, filed in 2013:
Average Adjusted Gross Income (AGI) in 2012: $590,681 (Individual Income Tax Returns)
Here:
$590,681
State:
$72,726
Salary/wage: $242,803 (reported on 64.2% of returns)
Here:
$242,803
State:
$59,079
(% of AGI for various income ranges: 57.4% for AGIs below $25k, 64.5% for AGIs $25k-50k, 54.4% for AGIs $50k-75k, 51.0% for AGIs $75k-100k, 43.7% for AGIs $100k-200k, 24.7% for AGIs over 200k)
Taxable interest for individuals: $50,074 (reported on 66.8% of returns)
This zip code:
$50,074
California:
$2,146
(% of AGI for various income ranges: 6.6% for AGIs below $25k, 4.0% for AGIs $25k-50k, 4.4% for AGIs $50k-75k, 5.1% for AGIs $75k-100k, 4.8% for AGIs $100k-200k, 5.7% for AGIs over 200k)
Ordinary dividends: $109,678 (reported on 50.8% of returns)
Here:
$109,678
State:
$9,308
(% of AGI for various income ranges: 9.3% for AGIs below $25k, 6.5% for AGIs $25k-50k, 6.8% for AGIs $50k-75k, 5.9% for AGIs $75k-100k, 6.1% for AGIs $100k-200k, 9.7% for AGIs over 200k)
Net capital gain/loss in AGI: +$294,439 (reported on 52.9% of returns)
Here:
+$294,439
State:
+$30,460
(% of AGI for various income ranges: 0.7% for AGIs below $25k, 6.2% for AGIs $25k-50k, 1.7% for AGIs $50k-75k, 4.6% for AGIs $75k-100k, 4.7% for AGIs $100k-200k, 28.0% for AGIs over 200k)
Profit/loss from business: +$62,418 (reported on 27.5% of returns)
Here:
+$62,418
State:
+$17,064
(% of AGI for various income ranges: 22.4% for AGIs below $25k, 9.8% for AGIs $25k-50k, 11.7% for AGIs $50k-75k, 5.8% for AGIs $75k-100k, 8.0% for AGIs $100k-200k, 2.5% for AGIs over 200k)
Taxable individual retirement arrangement distribution: $75,325 (reported on 13.5% of returns)
90210:
$75,325
California:
$19,557
(% of AGI for various income ranges: 3.5% for AGIs below $25k, 2.1% for AGIs $25k-50k, 3.9% for AGIs $50k-75k, 3.6% for AGIs $75k-100k, 5.9% for AGIs $100k-200k, 1.5% for AGIs over 200k)
Self-employment retirement plans: $43,821 (reported on 4.5% of returns)
90210:
$43,821
California:
$24,530
(% of AGI for various income ranges: 1.9% for AGIs $50k-75k, 0.9% for AGIs $100k-200k, 0.3% for AGIs over 200k)
Total itemized deductions: $191,814 (21% of AGI, reported on 64.7% of returns)
Here:
$191,814
State:
$34,004
Here:
21.4% of AGI
State:
22.7% of AGI
(% of AGI for various income ranges: 46.1% for AGIs below $25k, 26.9% for AGIs $25k-50k, 30.8% for AGIs $50k-75k, 33.1% for AGIs $75k-100k, 32.6% for AGIs $100k-200k, 20.2% for AGIs over 200k)
Charity contributions: $58,996 (reported on 55.8% of returns)
Here:
$58,996
State:
$4,659
(% of AGI for various income ranges: 1.8% for AGIs below $25k, 1.7% for AGIs $25k-50k, 2.0% for AGIs $50k-75k, 2.8% for AGIs $75k-100k, 2.9% for AGIs $100k-200k, 5.8% for AGIs over 200k)
Taxes paid: $93,668 (reported on 64.5% of returns)
90210:
$93,668
State:
$14,448
(% of AGI for various income ranges: 14.0% for AGIs below $25k, 8.5% for AGIs $25k-50k, 9.3% for AGIs $50k-75k, 11.5% for AGIs $75k-100k, 12.1% for AGIs $100k-200k, 10.1% for AGIs over 200k)
Earned income credit: $1,192 (reported on 5.3% of returns)
Here:
$1,192
State:
$2,286
(% of AGI for various income ranges: 2.0% for AGIs below $25k, 0.3% for AGIs $25k-50k)
Percentage of individuals using paid preparers for their 2012 taxes: 85.8%
Here:
86%
State:
64%
(% for various income ranges: 78.3% for AGIs below $25k, 78.2% for AGIs $25k-50k, 79.7% for AGIs $50k-75k, 82.5% for AGIs $75k-100k, 88.9% for AGIs $100k-200k, 95.0% for AGIs over 200k)
Averages for the 2004 tax year for zip code 90210, filed in 2005:
Average Adjusted Gross Income (AGI) in 2004: $408,901 (Individual Income Tax Returns)
Here:
$408,901
State:
$58,600
Salary/wage: $221,495 (reported on 60.5% of returns)
Here:
$221,495
State:
$49,455
(% of AGI for various income ranges: 55.6% for AGIs $10k-25k, 59.0% for AGIs $25k-50k, 46.9% for AGIs $50k-75k, 45.7% for AGIs $75k-100k, 30.1% for AGIs over 100k)
Taxable interest for individuals: $37,109 (reported on 74.8% of returns)
This zip code:
$37,109
California:
$2,365
(% of AGI for various income ranges: 10.0% for AGIs $10k-25k, 7.6% for AGIs $25k-50k, 7.9% for AGIs $50k-75k, 6.9% for AGIs $75k-100k, 5.9% for AGIs over 100k)
Taxable dividends: $41,719 (reported on 58.0% of returns)
Here:
$41,719
State:
$4,746
(% of AGI for various income ranges: 7.6% for AGIs $10k-25k, 6.0% for AGIs $25k-50k, 5.4% for AGIs $50k-75k, 5.6% for AGIs $75k-100k, 5.5% for AGIs over 100k)
Net capital gain/loss: +$192,069 (reported on 59.5% of returns)
Here:
+$192,069
State:
+$23,418
(% of AGI for various income ranges: 0.9% for AGIs $10k-25k, 3.4% for AGIs $25k-50k, 4.5% for AGIs $50k-75k, 4.6% for AGIs $75k-100k, 27.2% for AGIs over 100k)
Profit/loss from business: +$57,884 (reported on 26.9% of returns)
Here:
+$57,884
State:
+$16,826
(% of AGI for various income ranges: 14.7% for AGIs $10k-25k, 12.0% for AGIs $25k-50k, 11.5% for AGIs $50k-75k, 8.4% for AGIs $75k-100k, 3.4% for AGIs over 100k)
IRA payment deduction: $4,316 (reported on 4.4% of returns)
90210:
$4,316
California:
$3,192
(% of AGI for various income ranges: 0.4% for AGIs $10k-25k, 0.5% for AGIs $25k-50k, 0.4% for AGIs $50k-75k, 0.1% for AGIs $75k-100k, 0.0% for AGIs over 100k)
Self-employed pension: $32,582 (reported on 5.2% of returns)
Here:
$32,582
California:
$17,688
(% of AGI for various income ranges: 0.4% for AGIs $25k-50k, 0.6% for AGIs $50k-75k, 1.5% for AGIs $75k-100k, 0.4% for AGIs over 100k)
Total itemized deductions: $135,697 (20% of AGI, reported on 61.6% of returns)
Here:
$135,697
State:
$28,113
Here:
19.9% of AGI
State:
25.3% of AGI
(% of AGI for various income ranges: 34.2% for AGIs $10k-25k, 31.9% for AGIs $25k-50k, 34.4% for AGIs $50k-75k, 36.2% for AGIs $75k-100k, 18.8% for AGIs over 100k)
Charity contributions deductions: $38,792 (5% of AGI, reported on 55.1% of returns)
Here:
$38,792
State:
$3,923
Here:
5.3% of AGI
State:
3.3% of AGI
(% of AGI for various income ranges: 1.9% for AGIs $10k-25k, 2.5% for AGIs $25k-50k, 3.1% for AGIs $50k-75k, 3.8% for AGIs $75k-100k, 5.1% for AGIs over 100k)
Total tax: $125,051 (reported on 81.2% of returns)
90210:
$125,051
State:
$10,761
(% of AGI for various income ranges: 6.8% for AGIs $10k-25k, 8.9% for AGIs $25k-50k, 11.4% for AGIs $50k-75k, 11.4% for AGIs $75k-100k, 24.2% for AGIs over 100k)
Earned income credit: $1,084 (reported on 4.3% of returns)
Here:
$1,084
State:
$1,763
Percentage of individuals using paid preparers for their 2004 taxes: 87.8%
Here:
88%
State:
66%
(% for various income ranges: 83.0% for AGIs below $10k, 80.7% for AGIs $10k-25k, 80.5% for AGIs $25k-50k, 86.0% for AGIs $50k-75k, 89.8% for AGIs $75k-100k, 94.2% for AGIs over 100k)
Likely homosexual households (counted as self-reported same-sex unmarried-partner households)
Lesbian couples: 0.0% of all households
Gay men: 0.2% of all households
Household received Food Stamps/SNAP in the past 12 months: 256 Household did not receive Food Stamps/SNAP in the past 12 months: 7,612
Women who had a birth in the past 12 months: 161 (147 now married, 13 unmarried) Women who did not have a birth in the past 12 months: 3,485 (1,360 now married, 2,126 unmarried)
Housing units in zip code 90210 with a mortgage: 3,697 (780 second mortgage, 101 home equity loan, 549 both second mortgage and home equity loan) Houses without a mortgage: 65
Median monthly owner costs for units with a mortgage: $3,876 Median monthly owner costs for units without a mortgage: $1,556
Residents with income below the poverty level in 2022:
This zip code:
9.2%
Whole state:
12.2%
Residents with income below 50% of the poverty level in 2022:
This zip code:
4.1%
Whole state:
6.2%
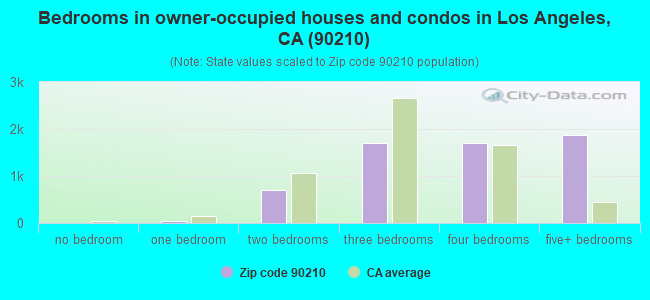
Median number of rooms in houses and condos:
Here:
7.8
State:
6.0
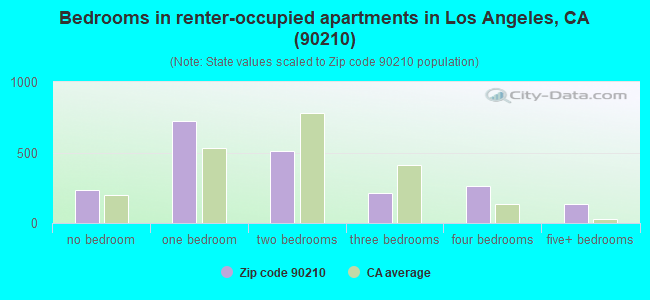
Median number of rooms in apartments:
Here:
4.1
State:
3.9
Notable locations in this zip code not listed on our city pages
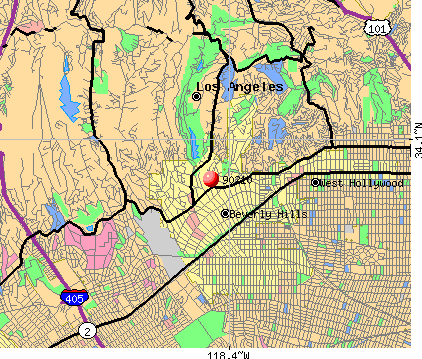
Notable locations in zip code 90210: Greystone Mansion (A), Beverly Hills Public Library (B), Beverly Hills City Hall (C), Sterling Plaza (D), Museum of Television and Radio (E), City of Beverly Hills Fire Department Station 2 (F), City of Beverly Hills Fire Department Station 1 Headquarters (G), City of Los Angeles Fire Department Station 108 (H). Display/hide their locations on the map
Churches in zip code 90210 include: Church of the Good Shepherd (A), Beverly Hills Community Presbyterian Church (B), All Saints Episcopal Church (C). Display/hide their locations on the map
In group quarters: 9 (-1 institutionalized population)
Size of family households: 2,278 2-persons, 1,036 3-persons, 845 4-persons, 516 5-persons, 139 6-persons, 36 7-or-more-persons
Size of nonfamily households: 2,638 1-person, 515 2-persons, 61 3-persons
2,807 married couples with children.
360 single-parent households (103 men, 257 women).
61.8% of residents of 90210 zip code speak English at home.
4.8% of residents speak Spanish at home (81% very well, 8% well, 8% not well, 4% not at all).
25.7% of residents speak other Indo-European language at home (77% very well, 15% well, 7% not well).
4.5% of residents speak Asian or Pacific Island language at home (46% very well, 23% well, 22% not well, 8% not at all).
5.0% of residents speak other language at home (98% very well, 2% well).
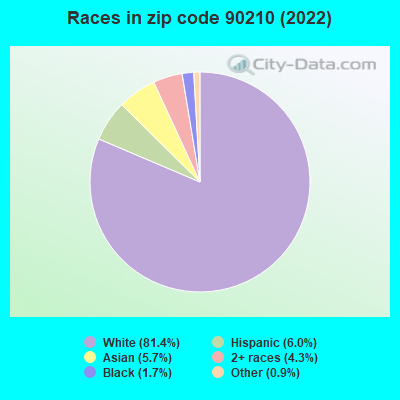
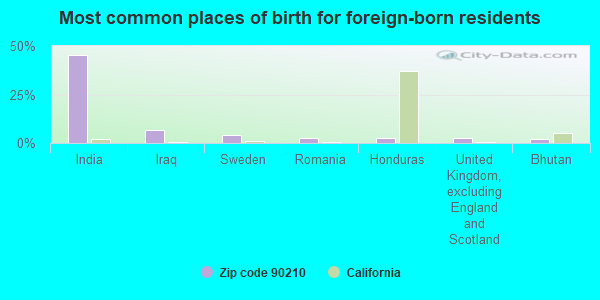
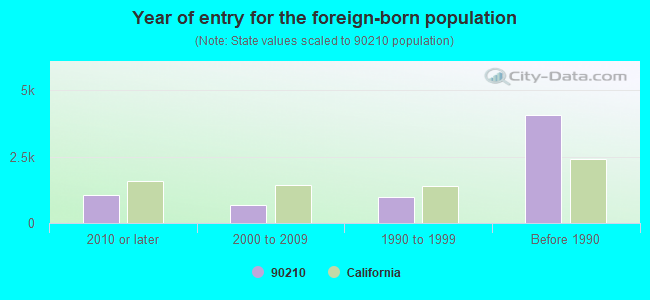
Foreign born population: 6,567 (34.5%) (76.3% of them are naturalized citizens)
Facilities with environmental interests located in this zip code:
LADWP FRANKLIN RESERVOIR FACILITY (1300 N BEVERLY DR in BEVERLY HILLS, CA)
STATE MASTER (California - Hazardous Waste Tracking) - HAZARDOU WASTE PROGRAM Small Quantity Generators, between 100 kg and 1000 kg of hazardous waste/month (Resource Conservation and Recovery Act (tracking hazardous waste)) Organizations: LA DEPT OF WATER AND POWER (CONTACT/OPERATOR)
Alternative names: LA DEPT OF WATER & POWER
LOS ANGELES FIRE STATION 99 (14145 MULHOLLAND DRIVE in BEVERLY HILLS, CA)
STATE MASTER (California - Hazardous Waste Tracking) - HAZARDOU WASTE PROGRAM Small Quantity Generators, between 100 kg and 1000 kg of hazardous waste/month (Resource Conservation and Recovery Act (tracking hazardous waste)) - notification Organizations: CITY OF LOS ANGELES (CONTACT/OWNER)
Alternative names: CITY OF LA GENERAL SERVICES, LA FIRE STATION 99
EDWARD M INES D D S (416 N BEDFORD DR STE 304 in BEVERLY HILLS, CA)
STATE MASTER (California - Hazardous Waste Tracking) - HAZARDOU WASTE PROGRAM Small Quantity Generators, between 100 kg and 1000 kg of hazardous waste/month (Resource Conservation and Recovery Act (tracking hazardous waste)) - notification Organizations: EDWARD INES (CONTACT/OWNER)
Alternative names: EDWARD M INES DDS
ALTERNA INCORPORATED (9100 WILSHIRE BOULEVARD in BEVERLY HILLS, CA)
(Integrated Compliance Information System) - ICIS-09-1998-0157, FORMAL ENFORCEMENT ACTION COMPLIANCE ACTIVITY (Tracking inspections of insecticide, fungicide, and rodenticide, and toxic substances)
EL RODEO ELEMENTARY (605 WHITTIER DR. in BEVERLY HILLS, CA)
(National Center for Education Statistics) - STATE ID-6011753 Organizations: BEVERLY HILLS UNIFIED (SCHOOL DISTRICT)
HAWTHORNE ELEMENTARY (624 N. REXFORD DR. in BEVERLY HILLS, CA)
(National Center for Education Statistics) - STATE ID-6011761 Organizations: BEVERLY HILLS UNIFIED (SCHOOL DISTRICT)
MOLDWASH (9601 WILSHIRE BOULEVARD in BEVERLY HILLS, CA)
INA'S 14K SHOP INC (309 N BEVERLY DR in BEVERLY HILLS, CA)
Small Quantity Generators, between 100 kg and 1000 kg of hazardous waste/month (Resource Conservation and Recovery Act (tracking hazardous waste)) Business NAICS classification: JEWELRY (EXCEPT COSTUME) MANUFACTURING.
LARRY FLYNT PUBLICATIONS (9171 WILSHIRE BLVD SUITE 300 in BEVERLY HILLS, CA)
Small Quantity Generators, between 100 kg and 1000 kg of hazardous waste/month (Resource Conservation and Recovery Act (tracking hazardous waste)) Organizations: LARRY C FLYNT (CONTACT/OWNER)
MAPLE PLAZA LTD (345 N MAPLE DRIVE in BEVERLY HILLS, CA)
Small Quantity Generators, between 100 kg and 1000 kg of hazardous waste/month (Resource Conservation and Recovery Act (tracking hazardous waste)) - notification
MILLER DM INC (9250 BEVERLY BLVD in BEVERLY HILLS, CA)
Small Quantity Generators, between 100 kg and 1000 kg of hazardous waste/month (Resource Conservation and Recovery Act (tracking hazardous waste)) Organizations: TMW REAL ESTATE MGMT (CONTACT/OWNER)
Alternative names: BEVERLY HILLS LTD
MAC DONALD ISLAND (111 ZUCKERMAN ROAD, MAC DONALD in BEVERLY HILLS, CA)
CRITERIA AND HAZARDOUS AIR POLLUTANT INVENTORY (Inventory of air pollution sources) Business SIC classification: REFUSE SYSTEMS Business NAICS classification: SOLID WASTE LANDFILL.
CHRISTINE CHRISTAL (270 N CANON DR STE 1419 in BEVERLY HILLS, CA)
COMPLIANCE ACTIVITY (Tracking inspections of insecticide, fungicide, and rodenticide, and toxic substances)
Housing units lacking complete plumbing facilities: 1.1% Housing units lacking complete kitchen facilities: 3.2%
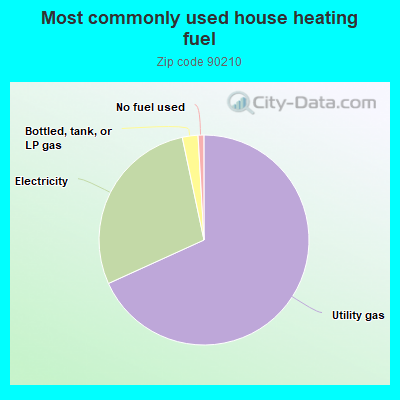
68.0%Utility gas
28.4%Electricity
2.4%Bottled, tank, or LP gas
0.9%No fuel used
Population in 1990: 20,700. Population change in the 1990s: +696 (+3.4%).
Place of birth for U.S.-born residents:
This state: 8,013
Northeast: 1,835
Midwest: 951
South: 929
West: 335
65% of the 90210 zip code residents lived in the same house 5 years ago. Out of people who lived in different houses, 82% lived in this county. Out of people who lived in different counties, 50% lived in California.
94% of the 90210 zip code residents lived in the same house 1 year ago. Out of people who lived in different houses, 63% moved from this county. Out of people who lived in different houses, 10% moved from different county within same state. Out of people who lived in different houses, 20% moved from different state. Out of people who lived in different houses, 11% moved from abroad.
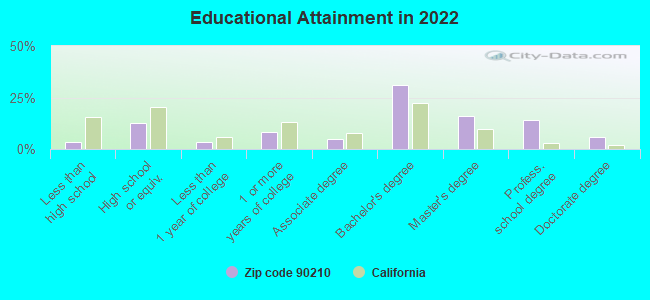
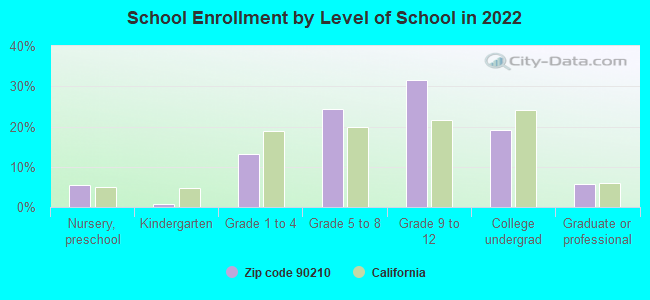
Private vs. public school enrollment:
Students in private schools in grades 1 to 8 (elementary and middle school): 788
Here:
50.1%
California:
10.5%
Students in private schools in grades 9 to 12 (high school): 503
Here:
39.2%
California:
8.5%
Students in private undergraduate colleges: 198
Here:
25.4%
California:
15.9%
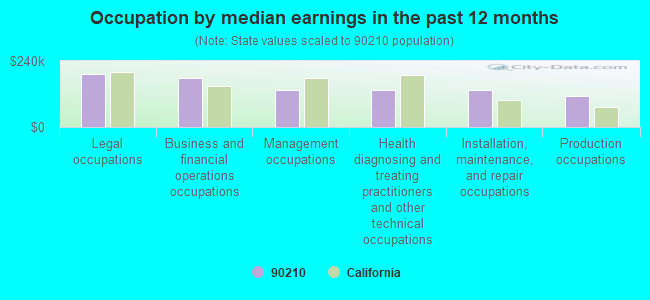
Occupation by median earnings in the past 12 months ($)
193,515Legal occupations
178,180Business and financial operations occupations
134,856Management occupations
134,747Health diagnosing and treating practitioners and other technical occupations
133,437Installation, maintenance, and repair occupations
113,047Production occupations
Companies with federal contracts located in this zip code:
WILTON JC, LLC ( in Beverly Hills, CA) : $1,019,855 in 23 contractsfrom 2003 to 2006
Contracts for Lease or Rental of Facilities -- Office Buildings by Public Buildings Service Signed by year:2000: $0; 2001: $0; 2002: $0; 2003: $308,632; 2004: $133,204; 2005: $400,167; 2006: $177,852.
Biggest contracts:
$44,463 with Public Buildings Service for Lease or Rental of Facilities -- Office Buildings. Signed on 2006-04-01. Completion date: 2006-09-30.
$44,463, same as above.Signed on 2006-07-01. Completion date: 2006-09-30.
$44,463, same as above.Signed on 2006-01-01. Completion date: 2006-09-30.
$44,463, same as above.Signed on 2006-04-01. Completion date: 2006-09-30.
LIEBERMAN SOFTWARE CORPORATION (9107 WILSHIRE BOULEVARD SU in BEVERLY HILLS, CA; small business) : $410,155 in 36 contractsfrom 2001 to 2006
Contracts for Other ADP and Telecommunications Services (includes data storage on tapes, compact disks, etc.), ADP Software, Office Supplies, Other Professional Services, and moreby Minerals Management Service, Department of Veterans Affairs, Army, Public Buildings Service, and others Signed by year:2000: $0; 2001: $52,000; 2002: $36,603; 2003: $49,666; 2004: $93,961; 2005: $89,831; 2006: $88,094.
Biggest contracts:
$52,000 with Minerals Management Service for Other ADP and Telecommunications Services (includes data storage on tapes, compact disks, etc.). Signed on 2001-03-15. Completion date: 2002-03-15.
$36,863 with Department of Veterans Affairs for ADP Software. Signed on 2005-08-29. Completion date: 2005-09-28.
$32,066, same as above.Signed on 2004-12-20. Completion date: 2005-12-20.
$26,516 with Army for Office Supplies. Taking place in UT. Signed on 2006-03-14. Completion date: 2006-04-12.
ROE & ROE INC ( in BEVERLY HILLS, CA; small business) : $407,467 in 70 contractsfrom 2003 to 2006
Contracts for Lease or Rental of Facilities -- Office Buildings by Public Buildings Service Signed by year:2000: $0; 2001: $0; 2002: $0; 2003: $151,998; 2004: $31,869; 2005: $121,199; 2006: $102,401.
Biggest contracts:
$18,991 with Public Buildings Service for Lease or Rental of Facilities -- Office Buildings. Signed on 2003-09-15. Completion date: 2003-09-15.
$18,991, same as above.Signed on 2003-06-15. Completion date: 2003-06-15.
$6,398, same as above.Signed on 2006-04-01. Completion date: 2006-06-15.
$6,398, same as above.Signed on 2006-01-01. Completion date: 2006-05-15.
MIG MAGIC, INC (11 BEVERLY PARK in BEVERLY HILLS, CA; small business) : $67,604 in 10 contractsfrom 2003 to 2006
Contracts for Other Professional Services, Recreational Services, Other Social Services, Personal Services Contracts by Air Force, Army Signed by year:2000: $0; 2001: $0; 2002: $0; 2003: $9,000; 2004: $14,000; 2005: $28,604; 2006: $16,000.
Biggest contracts:
$9,829 with Air Force for Other Professional Services. Taking place in AZ. Signed on 2005-02-25. Completion date: 2005-03-20.
$9,000 with Army for Other Professional Services. Taking place in AR. Signed on 2003-04-29. Completion date: 2003-10-10.
$9,000 with Air Force for Recreational Services. Taking place in VA. Signed on 2006-03-31. Completion date: 2006-05-07.
$9,000 with Air Force for Other Professional Services. Taking place in VA. Signed on 2005-03-16. Completion date: 2005-05-15.
DENTAL WORKERS INC (9507 SANTA MONICA BLVD STE in BEVERLY HILLS, CA; small business)
$6,108 with Navy for Advertising Services. Signed on 2005-09-28. Completion date: 2006-09-30.
CHARMED COM, INC (9601 WILSHIRE BLVD STE 735 in BEVERLY HILLS, CA; small business)
$5,315 with Army for ADP Central Processing Unit (CPU, Computer), Analog. Taking place in GA. Signed on 2002-12-31. Completion date: 2003-01-30.
Top industries in this zip code by the number of employees in 2005:
Health Care and Social Assistance: Offices of Physicians (except Mental Health Specialists) (50-99: 1, 20-49: 6, 10-19: 16, 5-9: 40, 1-4: 176)
Professional, Scientific, and Technical Services: Offices of Lawyers (20-49: 5, 10-19: 13, 5-9: 17, 1-4: 104)
Arts, Entertainment, and Recreation: Agents and Managers for Artists, Athletes, Entertainers, and Other Public Figures (100-249: 3, 50-99: 1, 10-19: 1, 5-9: 5, 1-4: 35)
2005 - 2018 National Fire Incident Reporting System (NFIRS) incidents
Based on the data from the years 2005 - 2018 the average number of fire incidents per year is 48. The highest number of fire incidents - 137 took place in 2006, and the least - 10 in 2008. The data has a dropping trend.
When looking into fire subcategories, the most reports belonged to: Outside Fires (37.3%), and Structure Fires (36.4%).
Fire incident types reported to NFIRS in Zip Code 90210


 Nearest zip codes: 90069, 90024, 90077, 90095, 90212, 91604.
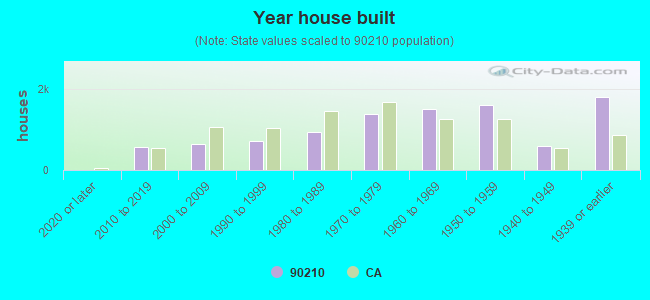


 Based on the data from the years 2005 - 2018 the average number of fire incidents per year is 48. The highest number of fire incidents - 137 took place in 2006, and the least - 10 in 2008. The data has a dropping trend.
 When looking into fire subcategories, the most reports belonged to: Outside Fires (37.3%), and Structure Fires (36.4%).