Estimated zip code population in 2022: 49,973 Zip code population in 2010: 47,452 Zip code population in 2000: 44,141
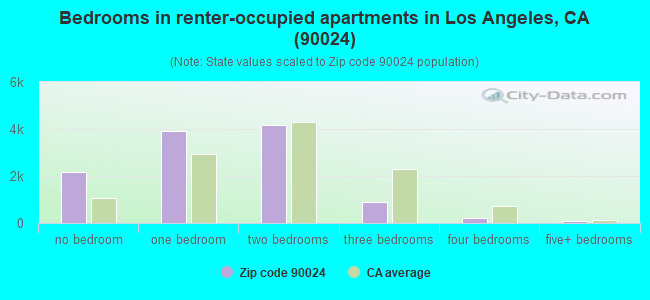
Houses and condos: 20,598 Renter-occupied apartments: 11,386
% of renters here:
67%
State:
44%
March 2022 cost of living index in zip code 90024: 156.6 (very high, U.S. average is 100)
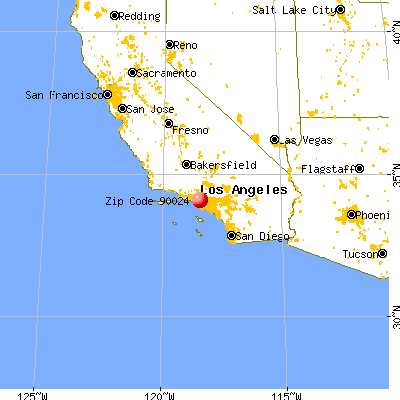
Land area: 2.9 sq. mi. Water area: 0.0 sq. mi.
Population density: 17,077 people per square mile
(very high).
OSM Map
General Map
Google Map
MSN Map
OSM Map
General Map
Google Map
MSN Map
OSM Map
General Map
Google Map
MSN Map
OSM Map
General Map
Google Map
MSN Map
Please wait while loading the map...
Real estate property taxes paid for housing units in 2022:
This zip code:
0.7% ($10,292)
California:
0.7% ($4,831)
Median real estate property taxes paid for housing units with mortgages in 2022: $10,330 (0.7%) Median real estate property taxes paid for housing units with no mortgage in 2022: $10,572 (0.6%)
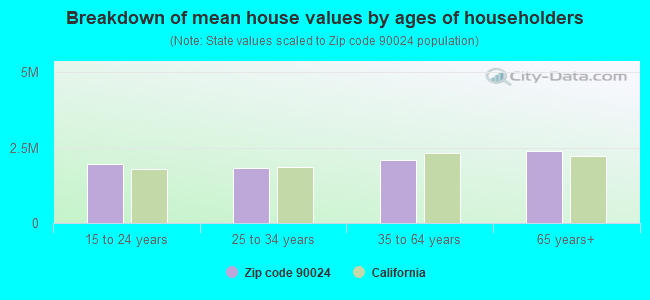
Estimated median house/condo value in 2022: $1,575,784
90024:
$1,575,784
California:
$715,900
According to our research of California and other state lists, there were 9 registered sex offenders living in 90024 zip code as of April 27, 2024. The ratio of all residents to sex offenders in zip code 90024 is 5,606 to 1. The ratio of registered sex offenders to all residents in this zip code is much lower than the state average.
Median resident age:
This zip code:
23.3 years
California median age:
37.9 years
Average household size:
This zip code:
2.0 people
California:
2.8 people
Averages for the 2020 tax year for zip code 90024, filed in 2021:
Average Adjusted Gross Income (AGI) in 2020: $398,127 (Individual Income Tax Returns)
Here:
$398,127
State:
$95,910
Salary/wage: $223,852 (reported on 71.8% of returns)
Here:
$223,852
State:
$77,331
(% of AGI for various income ranges: 1287.1% for AGIs below $25k, 4434.6% for AGIs $25k-50k, 7982.2% for AGIs $50k-75k, 12364.9% for AGIs $75k-100k, 22404.0% for AGIs $100k-200k, 353500.4% for AGIs over 200k)
Taxable interest for individuals: $15,008 (reported on 53.3% of returns)
This zip code:
$15,008
California:
$2,294
(% of AGI for various income ranges: 65.2% for AGIs below $25k, 166.1% for AGIs $25k-50k, 233.4% for AGIs $50k-75k, 429.5% for AGIs $75k-100k, 1002.6% for AGIs $100k-200k, 18337.1% for AGIs over 200k)
Ordinary dividends: $34,325 (reported on 45.4% of returns)
Here:
$34,325
State:
$10,949
(% of AGI for various income ranges: 158.8% for AGIs below $25k, 262.7% for AGIs $25k-50k, 542.6% for AGIs $50k-75k, 828.7% for AGIs $75k-100k, 1923.8% for AGIs $100k-200k, 35664.9% for AGIs over 200k)
Net capital gain/loss in AGI: +$206,030 (reported on 45.5% of returns)
Here:
+$206,030
State:
+$49,306
(% of AGI for various income ranges: 75.2% for AGIs below $25k, 255.7% for AGIs $25k-50k, 539.9% for AGIs $50k-75k, 605.8% for AGIs $75k-100k, 2386.2% for AGIs $100k-200k, 244751.5% for AGIs over 200k)
Profit/loss from business: +$75,458 (reported on 24.6% of returns)
Here:
+$75,458
State:
+$15,671
(% of AGI for various income ranges: 208.5% for AGIs below $25k, 496.3% for AGIs $25k-50k, 624.3% for AGIs $50k-75k, 1090.9% for AGIs $75k-100k, 1827.0% for AGIs $100k-200k, 42722.2% for AGIs over 200k)
Taxable individual retirement arrangement distribution: $49,130 (reported on 8.3% of returns)
90024:
$49,130
California:
$23,505
(% of AGI for various income ranges: 51.5% for AGIs below $25k, 122.1% for AGIs $25k-50k, 208.7% for AGIs $50k-75k, 534.5% for AGIs $75k-100k, 1195.7% for AGIs $100k-200k, 7601.6% for AGIs over 200k)
Self-employed (Keogh) retirement plans: $42,072 (reported on 2.7% of returns)
90024:
$42,072
California:
$30,163
(% of AGI for various income ranges: 69.1% for AGIs $50k-75k, 150.2% for AGIs $100k-200k, 2703.3% for AGIs over 200k)
Total itemized deductions: $81,851 (reported on 28.2% of returns)
Here:
$81,851
State:
$39,517
(% of AGI for various income ranges: 250.2% for AGIs below $25k, 525.3% for AGIs $25k-50k, 1188.6% for AGIs $50k-75k, 1961.5% for AGIs $75k-100k, 4080.2% for AGIs $100k-200k, 49116.2% for AGIs over 200k)
Charity contributions: $43,233 (reported on 24.5% of returns)
Here:
$43,233
State:
$12,598
(% of AGI for various income ranges: 10.0% for AGIs below $25k, 45.6% for AGIs $25k-50k, 129.7% for AGIs $50k-75k, 251.8% for AGIs $75k-100k, 603.6% for AGIs $100k-200k, 26787.3% for AGIs over 200k)
Taxes paid: $9,275 (reported on 27.9% of returns)
90024:
$9,275
State:
$8,807
(% of AGI for various income ranges: 47.7% for AGIs below $25k, 100.8% for AGIs $25k-50k, 245.7% for AGIs $50k-75k, 454.4% for AGIs $75k-100k, 898.2% for AGIs $100k-200k, 4209.1% for AGIs over 200k)
Earned income credit: $839 (reported on 5.1% of returns)
Here:
$839
State:
$2,074
(% of AGI for various income ranges: 21.4% for AGIs below $25k, 15.5% for AGIs $25k-50k)
Percentage of individuals using paid preparers for their 2020 taxes: 93.1%
Here:
93%
State:
92%
(% for various income ranges: 92.1% for AGIs below $25k, 93.5% for AGIs $25k-50k, 92.6% for AGIs $50k-75k, 92.4% for AGIs $75k-100k, 93.0% for AGIs $100k-200k, 94.6% for AGIs over 200k)
Averages for the 2012 tax year for zip code 90024, filed in 2013:
Average Adjusted Gross Income (AGI) in 2012: $326,661 (Individual Income Tax Returns)
Here:
$326,661
State:
$72,726
Salary/wage: $192,463 (reported on 71.9% of returns)
Here:
$192,463
State:
$59,079
(% of AGI for various income ranges: 64.9% for AGIs below $25k, 69.7% for AGIs $25k-50k, 69.2% for AGIs $50k-75k, 63.8% for AGIs $75k-100k, 60.1% for AGIs $100k-200k, 38.9% for AGIs over 200k)
Taxable interest for individuals: $21,232 (reported on 56.0% of returns)
This zip code:
$21,232
California:
$2,146
(% of AGI for various income ranges: 4.1% for AGIs below $25k, 2.6% for AGIs $25k-50k, 2.3% for AGIs $50k-75k, 2.7% for AGIs $75k-100k, 2.7% for AGIs $100k-200k, 3.8% for AGIs over 200k)
Ordinary dividends: $33,336 (reported on 41.9% of returns)
Here:
$33,336
State:
$9,308
(% of AGI for various income ranges: 6.5% for AGIs below $25k, 3.9% for AGIs $25k-50k, 4.2% for AGIs $50k-75k, 4.3% for AGIs $75k-100k, 4.5% for AGIs $100k-200k, 4.2% for AGIs over 200k)
Net capital gain/loss in AGI: +$188,203 (reported on 40.0% of returns)
Here:
+$188,203
State:
+$30,460
(% of AGI for various income ranges: 0.3% for AGIs $25k-50k, 1.1% for AGIs $50k-75k, 1.6% for AGIs $75k-100k, 3.0% for AGIs $100k-200k, 26.4% for AGIs over 200k)
Profit/loss from business: +$64,650 (reported on 25.3% of returns)
Here:
+$64,650
State:
+$17,064
(% of AGI for various income ranges: 16.2% for AGIs below $25k, 10.2% for AGIs $25k-50k, 6.0% for AGIs $50k-75k, 7.4% for AGIs $75k-100k, 6.7% for AGIs $100k-200k, 4.6% for AGIs over 200k)
Taxable individual retirement arrangement distribution: $46,716 (reported on 12.1% of returns)
90024:
$46,716
California:
$19,557
(% of AGI for various income ranges: 3.2% for AGIs below $25k, 2.7% for AGIs $25k-50k, 3.1% for AGIs $50k-75k, 3.0% for AGIs $75k-100k, 4.2% for AGIs $100k-200k, 1.4% for AGIs over 200k)
Self-employment retirement plans: $35,758 (reported on 3.5% of returns)
90024:
$35,758
California:
$24,530
(% of AGI for various income ranges: 0.5% for AGIs $25k-50k, 0.2% for AGIs $50k-75k, 0.4% for AGIs $75k-100k, 0.7% for AGIs $100k-200k, 0.4% for AGIs over 200k)
Total itemized deductions: $121,453 (21% of AGI, reported on 52.8% of returns)
Here:
$121,453
State:
$34,004
Here:
20.7% of AGI
State:
22.7% of AGI
(% of AGI for various income ranges: 28.6% for AGIs below $25k, 16.6% for AGIs $25k-50k, 20.0% for AGIs $50k-75k, 21.2% for AGIs $75k-100k, 23.0% for AGIs $100k-200k, 19.3% for AGIs over 200k)
Charity contributions: $32,277 (reported on 44.5% of returns)
Here:
$32,277
State:
$4,659
(% of AGI for various income ranges: 1.3% for AGIs below $25k, 1.3% for AGIs $25k-50k, 1.8% for AGIs $50k-75k, 2.1% for AGIs $75k-100k, 2.4% for AGIs $100k-200k, 4.8% for AGIs over 200k)
Taxes paid: $63,682 (reported on 52.5% of returns)
90024:
$63,682
State:
$14,448
(% of AGI for various income ranges: 7.2% for AGIs below $25k, 4.3% for AGIs $25k-50k, 5.8% for AGIs $50k-75k, 7.3% for AGIs $75k-100k, 9.7% for AGIs $100k-200k, 10.6% for AGIs over 200k)
Earned income credit: $1,030 (reported on 6.2% of returns)
Here:
$1,030
State:
$2,286
(% of AGI for various income ranges: 1.8% for AGIs below $25k, 0.2% for AGIs $25k-50k)
Percentage of individuals using paid preparers for their 2012 taxes: 68.1%
Here:
68%
State:
64%
(% for various income ranges: 56.3% for AGIs below $25k, 57.4% for AGIs $25k-50k, 64.8% for AGIs $50k-75k, 65.5% for AGIs $75k-100k, 75.5% for AGIs $100k-200k, 90.3% for AGIs over 200k)
Averages for the 2004 tax year for zip code 90024, filed in 2005:
Average Adjusted Gross Income (AGI) in 2004: $153,850 (Individual Income Tax Returns)
Here:
$153,850
State:
$58,600
Salary/wage: $112,077 (reported on 69.9% of returns)
Here:
$112,077
State:
$49,455
(% of AGI for various income ranges: 68.4% for AGIs $10k-25k, 71.2% for AGIs $25k-50k, 68.0% for AGIs $50k-75k, 66.3% for AGIs $75k-100k, 42.6% for AGIs over 100k)
Taxable interest for individuals: $14,163 (reported on 62.2% of returns)
This zip code:
$14,163
California:
$2,365
(% of AGI for various income ranges: 6.0% for AGIs $10k-25k, 4.8% for AGIs $25k-50k, 4.3% for AGIs $50k-75k, 4.1% for AGIs $75k-100k, 4.6% for AGIs over 100k)
Taxable dividends: $18,271 (reported on 45.6% of returns)
Here:
$18,271
State:
$4,746
(% of AGI for various income ranges: 4.7% for AGIs $10k-25k, 3.9% for AGIs $25k-50k, 3.5% for AGIs $50k-75k, 4.2% for AGIs $75k-100k, 4.8% for AGIs over 100k)
Net capital gain/loss: +$81,356 (reported on 44.0% of returns)
Here:
+$81,356
State:
+$23,418
(% of AGI for various income ranges: 1.0% for AGIs $10k-25k, 0.7% for AGIs $25k-50k, 1.8% for AGIs $50k-75k, 2.7% for AGIs $75k-100k, 23.8% for AGIs over 100k)
Profit/loss from business: +$36,210 (reported on 24.3% of returns)
Here:
+$36,210
State:
+$16,826
(% of AGI for various income ranges: 13.1% for AGIs $10k-25k, 8.3% for AGIs $25k-50k, 6.8% for AGIs $50k-75k, 5.6% for AGIs $75k-100k, 4.8% for AGIs over 100k)
IRA payment deduction: $3,307 (reported on 3.9% of returns)
90024:
$3,307
California:
$3,192
(% of AGI for various income ranges: 0.5% for AGIs $10k-25k, 0.3% for AGIs $25k-50k, 0.2% for AGIs $50k-75k, 0.2% for AGIs $75k-100k, 0.0% for AGIs over 100k)
Self-employed pension: $28,742 (reported on 3.7% of returns)
Here:
$28,742
California:
$17,688
(% of AGI for various income ranges: 0.4% for AGIs $10k-25k, 0.3% for AGIs $25k-50k, 0.4% for AGIs $50k-75k, 0.5% for AGIs $75k-100k, 0.7% for AGIs over 100k)
Total itemized deductions: $58,403 (19% of AGI, reported on 51.3% of returns)
Here:
$58,403
State:
$28,113
Here:
19.4% of AGI
State:
25.3% of AGI
(% of AGI for various income ranges: 23.9% for AGIs $10k-25k, 20.4% for AGIs $25k-50k, 22.9% for AGIs $50k-75k, 24.0% for AGIs $75k-100k, 17.0% for AGIs over 100k)
Charity contributions deductions: $14,096 (4% of AGI, reported on 44.3% of returns)
Here:
$14,096
State:
$3,923
Here:
4.2% of AGI
State:
3.3% of AGI
(% of AGI for various income ranges: 1.8% for AGIs $10k-25k, 1.9% for AGIs $25k-50k, 2.7% for AGIs $50k-75k, 3.0% for AGIs $75k-100k, 3.9% for AGIs over 100k)
Total tax: $46,749 (reported on 80.9% of returns)
90024:
$46,749
State:
$10,761
(% of AGI for various income ranges: 6.2% for AGIs $10k-25k, 9.3% for AGIs $25k-50k, 12.2% for AGIs $50k-75k, 13.0% for AGIs $75k-100k, 24.5% for AGIs over 100k)
Earned income credit: $684 (reported on 5.2% of returns)
Here:
$684
State:
$1,763
Percentage of individuals using paid preparers for their 2004 taxes: 68.3%
Here:
68%
State:
66%
(% for various income ranges: 57.6% for AGIs below $10k, 57.0% for AGIs $10k-25k, 62.3% for AGIs $25k-50k, 70.0% for AGIs $50k-75k, 73.3% for AGIs $75k-100k, 85.3% for AGIs over 100k)
Likely homosexual households (counted as self-reported same-sex unmarried-partner households)
Lesbian couples: 0.1% of all households
Gay men: 0.0% of all households
Household received Food Stamps/SNAP in the past 12 months: 788 Household did not receive Food Stamps/SNAP in the past 12 months: 16,053
Women who had a birth in the past 12 months: 225 (196 now married, 28 unmarried) Women who did not have a birth in the past 12 months: 20,750 (2,236 now married, 18,763 unmarried)
Housing units in zip code 90024 with a mortgage: 3,233 (346 second mortgage, 331 both second mortgage and home equity loan) Houses without a mortgage: 23
Median monthly owner costs for units with a mortgage: $3,876 Median monthly owner costs for units without a mortgage: $1,556
Residents with income below the poverty level in 2022:
This zip code:
27.7%
Whole state:
12.2%
Residents with income below 50% of the poverty level in 2022:
This zip code:
7.5%
Whole state:
6.2%
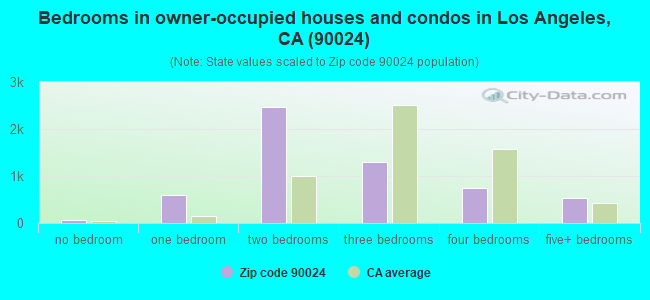
Median number of rooms in houses and condos:
Here:
5.1
State:
6.0
Median number of rooms in apartments:
Here:
3.3
State:
3.9
Notable locations in this zip code not listed on our city pages
Notable locations in zip code 90024: Los Angeles Country Club (A), Blumenthal Library (B), Doheny Memorial Dormitory for Girls (C), Armand Hammer Museum (D), Maxxam Building (E), Lewis Center (F), Hershey Hall (G), Hedrick Hall (H), Gayley Center (I), Dykstra Hall (J), Broxton Plaza (K), Weyburn Building (L), Westwood Center (M), Warren Hall (N), Unisys Building (O), Tishman Building (P), Taper Center (Q), Sunset Canyon Recreation Center (R), Southern Regional Library Facility (S), Rieber Hall (T). Display/hide their locations on the map
Churches in zip code 90024 include: Church of Jesus Christ of Latter Day Saints (A), Westwood United Methodist Church (B), Westwood Presbyterian Church (C), Westwood Hills Christian Church (D), University Lutheran Chapel (E), University Bible Church (F), Twentyeighth Church of Christ Scientist (G), Sinai Temple (H), Sephardic Temple Tifereth Israel (I). Display/hide their locations on the map
2,644 married couples with children.
305 single-parent households (64 men, 241 women).
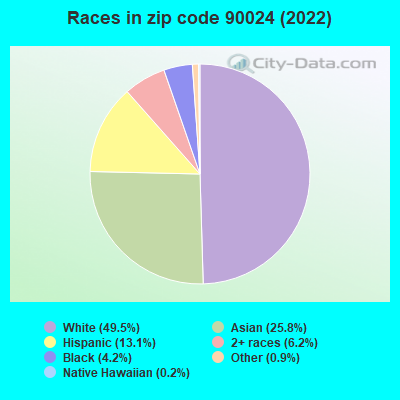
52.9% of residents of 90024 zip code speak English at home.
9.9% of residents speak Spanish at home (93% very well, 3% well, 3% not well, 1% not at all).
18.7% of residents speak other Indo-European language at home (72% very well, 20% well, 6% not well, 2% not at all).
15.9% of residents speak Asian or Pacific Island language at home (80% very well, 16% well, 4% not well, 1% not at all).
2.9% of residents speak other language at home (81% very well, 17% well, 2% not well).
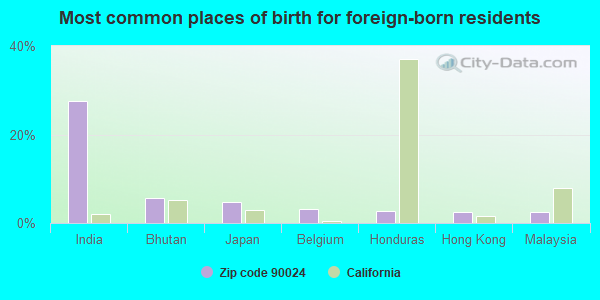
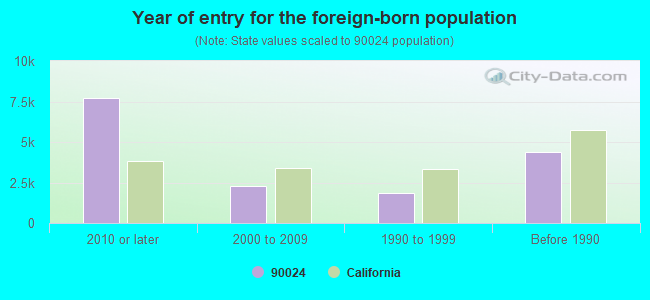
Foreign born population: 14,850 (29.7%) (53.9% of them are naturalized citizens)
Major facilities with environmental interests located in this zip code:
LA USD FAIRBURN EL (1403 FAIRBURN AVE in LOS ANGELES, CA)
STATE MASTER (California - Hazardous Waste Tracking) - HAZARDOU WASTE PROGRAM (Resource Conservation and Recovery Act (tracking hazardous waste)) Alternative names: FAIRBURN AVENUE ELEMENTARY, LAUSD/ FAIRBURN AVE ELEM
INTERNAL MEDICINE (100 UCLA MEDICAL PLAZA STE 490 in LOS ANGELES, CA)
STATE MASTER (California - Hazardous Waste Tracking) - HAZARDOU WASTE PROGRAM Small Quantity Generators, between 100 kg and 1000 kg of hazardous waste/month (Resource Conservation and Recovery Act (tracking hazardous waste)) - notification Organizations: DENNIS EVANGELATOS MD PATRICIA JACOBS MD (CONTACT/OWNER)
LONDON CLEANERS (1073 GAYLEY AVE in LOS ANGELES, CA)
STATE MASTER (California - Hazardous Waste Tracking) - HAZARDOU WASTE PROGRAM Small Quantity Generators, between 100 kg and 1000 kg of hazardous waste/month (Resource Conservation and Recovery Act (tracking hazardous waste))
CHEVRON STATION NO 93100 (10984 LE CONTE AVE in LOS ANGELES, CA)
STATE MASTER (California - Hazardous Waste Tracking) - HAZARDOU WASTE PROGRAM Small Quantity Generators, between 100 kg and 1000 kg of hazardous waste/month (Resource Conservation and Recovery Act (tracking hazardous waste)) - notification Organizations: CHEVRON PRODUCTS CO (CONTACT/OWNER)
EMERSON (RALPH WALDO) MIDDLE (1650 SELBY AVE. in LOS ANGELES, CA)
(National Center for Education Statistics) - STATE ID-6057988 Organizations: LOS ANGELES UNIFIED (SCHOOL DISTRICT)
LUZ ENGINEERING CORP (924 WESTWOOD BLVD in LOS ANGELES, CA)
(Integrated Compliance Information System) - ICIS-09-1988-0011, FORMAL ENFORCEMENT ACTION Business SIC classification: ENGINEERING SERVICES
30 MIN FOTO QUICK (1145 WESTWOOD BLVD in LOS ANGELES, CA)
Small Quantity Generators, between 100 kg and 1000 kg of hazardous waste/month (Resource Conservation and Recovery Act (tracking hazardous waste)) - notification Organizations: HAMID REZA SHEKARCHIAN (CONTACT/OWNER)
HOME DEPOT USA INC HD 1051 (10861 WEYBURN AVE in LOS ANGELES, CA)
Small Quantity Generators, between 100 kg and 1000 kg of hazardous waste/month (Resource Conservation and Recovery Act (tracking hazardous waste)) Alternative names: HOME DEPOT USA HD 1051
KAUFMAN & BROAD HOME CORP (10990 WILSHIRE BLVD in LOS ANGELES, CA)
AIR MINOR (AIRS/AFS) Business SIC classification: GENERAL CONTRACTORS-SINGLE-FAMILY HOUSES
NU ART DRY CLEANING (1769 WESTWOOD BLVD in LOS ANGELES, CA)
Small Quantity Generators, between 100 kg and 1000 kg of hazardous waste/month (Resource Conservation and Recovery Act (tracking hazardous waste)) - notification Organizations: VAHID FARROKH (CONTACT/OWNER)
ALTERNA INC (10877 WILSHIRE BLVD in LOS ANGELES, CA)
COMPLIANCE ACTIVITY (Tracking inspections of insecticide, fungicide, and rodenticide, and toxic substances)
FAULTLINE CLEANERS (1550 WESTWOOD BLVD in LOS ANGELES, CA)
Small Quantity Generators, between 100 kg and 1000 kg of hazardous waste/month (Resource Conservation and Recovery Act (tracking hazardous waste)) - notification Organizations: JAY SHAH (CONTACT/OWNER)
FEDERAL BUREAU OF INVESTIGATION (1260 S SEPULVEDA BLVD in LOS ANGELES, CA) . Federal Facility. DEPARTMENT OF JUSTICE
Small Quantity Generators, between 100 kg and 1000 kg of hazardous waste/month (Resource Conservation and Recovery Act (tracking hazardous waste)) - notification
Housing units lacking complete plumbing facilities: 0.7% Housing units lacking complete kitchen facilities: 3.0%
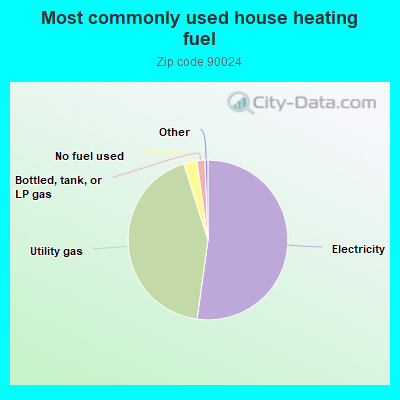
52.2%Electricity
42.9%Utility gas
2.7%No fuel used
1.6%Bottled, tank, or LP gas
Population in 1990: 38,370. Population change in the 1990s: +5,771 (+15.0%).
Place of birth for U.S.-born residents:
This state: 23,027
Northeast: 3,708
Midwest: 2,967
South: 3,027
West: 1,597
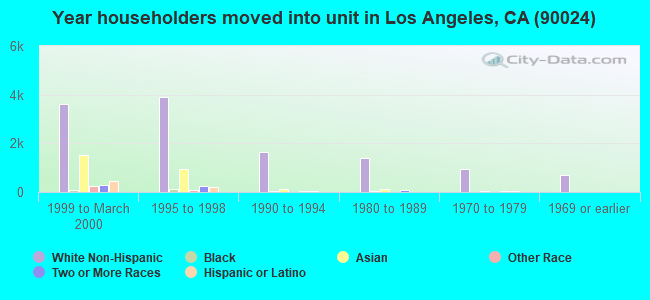
30% of the 90024 zip code residents lived in the same house 5 years ago. Out of people who lived in different houses, 48% lived in this county. Out of people who lived in different counties, 50% lived in California.
79% of the 90024 zip code residents lived in the same house 1 year ago. Out of people who lived in different houses, 61% moved from this county. Out of people who lived in different houses, 11% moved from different county within same state. Out of people who lived in different houses, 10% moved from different state. Out of people who lived in different houses, 15% moved from abroad.
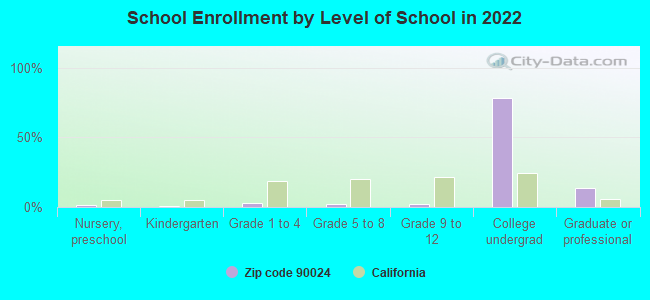
Private vs. public school enrollment:
Students in private schools in grades 1 to 8 (elementary and middle school): 570
Here:
44.3%
California:
10.5%
Students in private schools in grades 9 to 12 (high school): 258
Here:
51.3%
California:
8.5%
Students in private undergraduate colleges: 3,057
Here:
14.6%
California:
15.9%
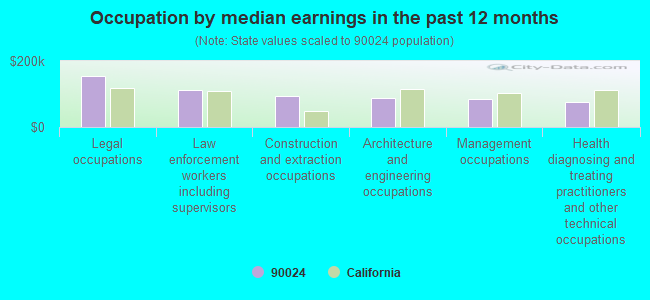
Occupation by median earnings in the past 12 months ($)
153,684Legal occupations
110,702Law enforcement workers including supervisors
92,765Construction and extraction occupations
87,437Architecture and engineering occupations
84,584Management occupations
76,861Health diagnosing and treating practitioners and other technical occupations
Companies with biggest federal contracts located in this zip code:
UNIVERSITY OF CALIFORNIA LOS A (6291 BOELTER HALL in LOS ANGELES, CA) : $9,064,018 in 15 contractsfrom 2000 to 2006
Contracts for Biomedical -- Basic Research (R&D), Other Medical Services by National Institutes of Health Signed by year:2000: $2,004,000; 2001: $1,313,000; 2002: $1,598,000; 2003: $1,120,869; 2004: $170,939; 2005: $0; 2006: $2,857,210.
Biggest contracts:
$2,857,210 with National Institutes of Health for Biomedical -- Basic Research (R&D). Signed on 2006-03-23. Completion date: 2008-08-14.
$1,358,000, same as above.Signed on 2002-08-15. Completion date: 2009-01-15.
$1,120,869, same as above.Signed on 2003-06-15. Completion date: 2009-01-15.
$743,000, same as above.Signed on 2001-05-15. Completion date: 2009-01-15.
REGENTS OF THE UNIVERSITY OF C (10920 WILSHIRE BLVD # 1200 in LOS ANGELES, CA) : $4,203,209 in 21 contractsfrom 2002 to 2005
Contracts for Biomedical -- Basic Research (R&D), Biomedical -- Applied Research and Exploratory Development (R&D) by National Institutes of Health Signed by year:2000: $0; 2001: $0; 2002: $183,000; 2003: $760,508; 2004: $2,111,226; 2005: $1,148,475; 2006: $0.
Biggest contracts:
$700,000 with National Institutes of Health for Biomedical -- Basic Research (R&D). Signed on 2004-08-20. Completion date: 2008-01-16.
$520,000, same as above.Signed on 2005-03-18. Completion date: 2008-01-16.
$398,933, same as above.Signed on 2004-06-25. Completion date: 2008-01-16.
$359,466, same as above.Signed on 2004-09-30. Completion date: 2008-01-16.
STANLEY BLACK & ROSE KAPLAN (9350 WLSHIRE BLVD STE 302 in LOS ANGELES, CA; small business) : $1,630,719 in 20 contractsfrom 1999 to 2003
Contracts for Lease or Rental of Facilities -- Office Buildings by Public Buildings Service Signed by year:2000: $276,000; 2001: $302,000; 2002: $458,556; 2003: $525,163; 2004: $0; 2005: $0; 2006: $0.
Biggest contracts:
$98,785 with Public Buildings Service for Lease or Rental of Facilities -- Office Buildings. Signed on 2003-06-15. Completion date: 2003-06-15.
$98,785, same as above.Signed on 2003-09-15. Completion date: 2003-09-15.
$98,278, same as above.Signed on 2002-12-15. Completion date: 2002-12-15.
$98,278, same as above.Signed on 2002-12-15. Completion date: 2002-12-15.
ROBBINS ACCESSORY SERVICE INC (1440 VETERAN AVE APT 535 in LOS ANGELES, CA; small business) : $823,769 in 19 contractsfrom 2001 to 2006
Contracts for Aircraft Hydraulic, Vacuum, and De-icing System Components, Miscellaneous Aircraft Accessories and Components, Gas Turbines and Jet Engines, Aircraft; Prime Moving, and Components, Engine Instruments, and moreby Air Force, Navy Signed by year:2000: $0; 2001: $262,328; 2002: $359,035; 2003: $195,466; 2004: $1,500; 2005: $0; 2006: $5,440.
Biggest contracts:
$99,540 with Air Force for Aircraft Hydraulic, Vacuum, and De-icing System Components. Signed on 2002-08-15. Completion date: 2002-12-23.
$98,766, same as above.Signed on 2003-05-08. Completion date: 2003-09-23.
$75,350 with Air Force for Miscellaneous Aircraft Accessories and Components. Signed on 2003-03-27. Completion date: 2003-07-28.
$72,000, same as above.Signed on 2001-11-14. Completion date: 2001-11-19.
FALCON CABLEVISION A CALIFORNI (10900 WILSHIRE BLVD 15TH F in LOS ANGELES, CA; small business) : $387,642 in 7 contractsfrom 1999 to 2005
Contracts for Telecommunications Network Management Services, Audio/Visual Services, Communications Services by Air Force Signed by year:2000: $53,255; 2001: $53,960; 2002: $53,632; 2003: $56,140; 2004: $57,700; 2005: $59,431; 2006: $0.
Biggest contracts:
$59,431 with Air Force for Telecommunications Network Management Services. Taking place in MO. Signed on 2005-10-01. Completion date: 2005-10-01.
$57,700 with Air Force for Audio/Visual Services. Taking place in MO. Signed on 2004-10-01. Completion date: 2005-09-30.
$56,140 with Air Force for Communications Services. Taking place in MO. Signed on 2003-10-01. Completion date: 2004-09-30.
$53,960, same as above.Signed on 2001-10-01. Completion date: 2002-09-30.
max william a.v. clark (1314 comstock avenue in los angeles, ca; small business) : $311,200 in 7 contractsfrom 2002 to 2006
Contracts for Expert Witness by Offices, Boards and Divisions (includes Attorney General, Deputy Attorney General, etc.), Federal Trade Commission Signed by year:2000: $0; 2001: $0; 2002: $20,000; 2003: $0; 2004: $0; 2005: $275,200; 2006: $16,000.
Biggest contracts:
$93,800 with Offices, Boards and Divisions (includes Attorney General, Deputy Attorney General, etc.) for Expert Witness. Taking place in MA. Signed on 2005-03-17. Completion date: 2005-12-31.
$83,200, same as above.Signed on 2005-04-26. Completion date: 2005-12-31.
$58,200 with Offices, Boards and Divisions (includes Attorney General, Deputy Attorney General, etc.) for Expert Witness. Signed on 2005-03-25. Completion date: 2005-12-31.
$40,000 with Offices, Boards and Divisions (includes Attorney General, Deputy Attorney General, etc.) for Expert Witness. Taking place in MA. Signed on 2005-06-10. Completion date: 2005-12-31.
MENTAT INC (1145 GAYLEY AVE , SUITE 31 in LOS ANGELES, CA; small business) : $157,362 in 7 contractsfrom 2003 to 2004
Contracts for ADP Input/Output and Storage Devices, ADP Support Equipment, ADP Software, Radar Equipment, Except Airborne, and moreby Army, EXECUTIVE OFFICE OF THE PRESIDENT, Federal Technology Service Signed by year:2000: $0; 2001: $0; 2002: $0; 2003: $88,667; 2004: $68,695; 2005: $0; 2006: $0.
Biggest contracts:
$45,165 with Army for ADP Input/Output and Storage Devices. Signed on 2004-02-26. Completion date: 2004-03-31.
$41,424 with Army for ADP Support Equipment. Signed on 2003-09-22. Completion date: 2003-09-10.
$27,000 with EXECUTIVE OFFICE OF THE PRESIDENT for ADP Software. Signed on 2003-09-15. Completion date: 2003-10-15.
$15,180 with Army for Radar Equipment, Except Airborne. Signed on 2004-09-09. Completion date: 2004-09-30.
MAGNETEK INC (10900 WILSHIRE BLVD #850 in LOS ANGELES, CA) : $108,348 in 28 contractsfrom 1999 to 2005
Contracts for Electrical Hardware and Supplies by Bureau of Prisoners/Federal Prison System, Navy Signed by year:2000: $54,000; 2001: $26,000; 2002: $0; 2003: $0; 2004: $0; 2005: $15,348; 2006: $0.
Biggest contracts:
$30,000 with Bureau of Prisoners/Federal Prison System for Electrical Hardware and Supplies. Taking place in MD. Signed on 2000-10-15. Completion date: 2002-06-15.
$15,348 with Navy for Electrical Hardware and Supplies. Signed on 2005-03-01. Completion date: 2005-06-07.
$7,000 with Bureau of Prisoners/Federal Prison System for Electrical Hardware and Supplies. Taking place in MD. Signed on 1999-11-15. Completion date: 2002-06-15.
$6,000, same as above.Signed on 1999-11-15. Completion date: 2002-06-15.
PC AND YOU INC (1321 WESTWOOD BLVD STE 201 in LOS ANGELES, CA; small business)
$83,040 with Navy for ADPE System Configuration. Signed on 2002-04-25. Completion date: 2002-06-04.
METALOGIC TECHNOLOGIES, INC (1743 GLENDON AVENUE in LOS ANGELES, CA; small business)
$27,150 with Air Force for Nuts and Washers. Signed on 2003-08-18. Completion date: 2003-08-18.
Top industries in this zip code by the number of employees in 2005:
Health Care and Social Assistance: General Medical and Surgical Hospitals (over 1000: 1)
Management of Companies and Enterprises: Corporate, Subsidiary, and Regional Managing Offices (500-999: 1, 250-499: 1, 100-249: 2, 20-49: 1, 5-9: 3, 1-4: 2)
Professional, Scientific, and Technical Services: Offices of Lawyers (100-249: 1, 50-99: 2, 20-49: 5, 10-19: 7, 5-9: 22, 1-4: 89)
Administrative and Support and Waste Management and Remediation Services: Temporary Help Services (250-499: 1, 100-249: 3, 20-49: 1, 1-4: 3)
Finance and Insurance: Real Estate Credit (500-999: 1, 50-99: 1, 10-19: 1, 1-4: 1)
Arts, Entertainment, and Recreation: Independent Artists, Writers, and Performers (50-99: 2, 20-49: 2, 10-19: 4, 5-9: 5, 1-4: 225)
Other Services (except Public Administration): Other Similar Organizations (except Business, Professional, Labor, and Political Organizations) (20-49: 20, 10-19: 3, 5-9: 2, 1-4: 7)
Accommodation and Food Services: Hotels (except Casino Hotels) and Motels (100-249: 3, 50-99: 1, 20-49: 1, 10-19: 2, 1-4: 1)
Other Services (except Public Administration): Religious Organizations (250-499: 1, 20-49: 4, 5-9: 3, 1-4: 4)
People in group quarters in 2010:
11,078 people in college/university student housing
81 people in other noninstitutional facilities
6 people in group homes intended for adults
6 people in workers' group living quarters and job corps centers
People in group quarters in 2000:
10,405 people in college dormitories (includes college quarters off campus)
335 people in nursing homes
169 people in other group homes
93 people in other nonhousehold living situations
65 people in mental (psychiatric) hospitals or wards
30 people in other noninstitutional group quarters
8 people in religious group quarters
Fatal accident statistics in 2014:
Fatal accident count: 2
Vehicles involved in fatal accidents: 4
Fatal accidents caused by drunken drivers: 1
Fatalities: 2
Persons involved in fatal accidents: 7
Pedestrians involved in fatal accidents: 0
Fatal accident statistics in 2013:
Fatal accident count: 1
Vehicles involved in fatal accidents: 3
Fatal accidents caused by drunken drivers: 0
Fatalities: 1
Persons involved in fatal accidents: 1
Pedestrians involved in fatal accidents: 1
Home Mortgage Disclosure Act Aggregated Statistics For Year 2009 (Based on 12 full and 6 partial tracts)
A) FHA, FSA/RHS & VA Home Purchase Loans
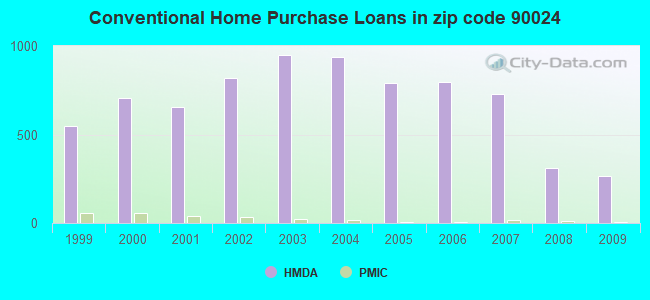
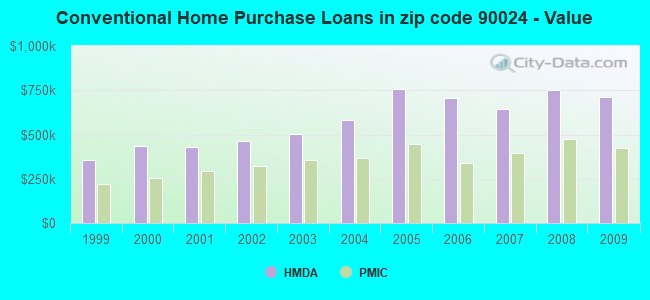
B) Conventional Home Purchase Loans
C) Refinancings
D) Home Improvement Loans
E) Loans on Dwellings For 5+ Families
F) Non-occupant Loans on < 5 Family Dwellings (A B C & D)
Number
Average Value
Number
Average Value
Number
Average Value
Number
Average Value
Number
Average Value
Number
Average Value
LOANS ORIGINATED
12
$494,557
265
$711,566
1,144
$525,731
28
$329,684
13
$2,900,782
128
$529,296
APPLICATIONS APPROVED, NOT ACCEPTED
0
$0
44
$704,383
147
$501,376
6
$355,348
0
$0
36
$381,930
APPLICATIONS DENIED
5
$644,304
68
$822,984
401
$621,016
10
$478,078
1
$7,161,000
57
$375,589
APPLICATIONS WITHDRAWN
9
$423,731
61
$740,428
236
$597,470
14
$213,461
1
$7,300,000
29
$971,856
FILES CLOSED FOR INCOMPLETENESS
0
$0
8
$820,316
73
$758,463
0
$0
0
$0
4
$285,622
Aggregated Statistics For Year 2008 (Based on 12 full and 6 partial tracts)
A) FHA, FSA/RHS & VA Home Purchase Loans
B) Conventional Home Purchase Loans
C) Refinancings
D) Home Improvement Loans
E) Loans on Dwellings For 5+ Families
F) Non-occupant Loans on < 5 Family Dwellings (A B C & D)
Number
Average Value
Number
Average Value
Number
Average Value
Number
Average Value
Number
Average Value
Number
Average Value
LOANS ORIGINATED
8
$548,780
310
$752,295
426
$782,008
20
$554,207
33
$3,624,419
113
$585,658
APPLICATIONS APPROVED, NOT ACCEPTED
1
$486,000
65
$817,701
101
$939,718
3
$620,000
4
$1,513,285
24
$395,189
APPLICATIONS DENIED
4
$633,180
110
$862,534
205
$605,963
26
$1,088,270
0
$0
60
$375,961
APPLICATIONS WITHDRAWN
0
$0
70
$724,866
130
$580,142
4
$313,650
6
$2,213,980
25
$542,861
FILES CLOSED FOR INCOMPLETENESS
0
$0
22
$718,571
52
$540,288
5
$457,888
0
$0
12
$232,027
Aggregated Statistics For Year 2007 (Based on 12 full and 6 partial tracts)
B) Conventional Home Purchase Loans
C) Refinancings
D) Home Improvement Loans
E) Loans on Dwellings For 5+ Families
F) Non-occupant Loans on < 5 Family Dwellings (A B C & D)
G) Loans On Manufactured Home Dwelling (A B C & D)
Number
Average Value
Number
Average Value
Number
Average Value
Number
Average Value
Number
Average Value
Number
Average Value
LOANS ORIGINATED
729
$645,780
725
$748,493
71
$875,707
52
$3,952,182
218
$451,789
0
$0
APPLICATIONS APPROVED, NOT ACCEPTED
184
$665,869
190
$688,049
14
$1,267,761
0
$0
51
$497,114
0
$0
APPLICATIONS DENIED
229
$708,551
366
$790,655
22
$707,332
1
$5,700,000
85
$594,943
2
$38,790
APPLICATIONS WITHDRAWN
129
$831,131
142
$754,518
10
$584,629
4
$1,716,720
28
$757,079
0
$0
FILES CLOSED FOR INCOMPLETENESS
32
$1,175,285
43
$706,995
2
$795,680
0
$0
7
$479,530
0
$0
Aggregated Statistics For Year 2006 (Based on 12 full and 6 partial tracts)
B) Conventional Home Purchase Loans
C) Refinancings
D) Home Improvement Loans
E) Loans on Dwellings For 5+ Families
F) Non-occupant Loans on < 5 Family Dwellings (A B C & D)
Number
Average Value
Number
Average Value
Number
Average Value
Number
Average Value
Number
Average Value
LOANS ORIGINATED
795
$703,881
860
$698,227
77
$847,207
44
$3,637,354
304
$634,611
APPLICATIONS APPROVED, NOT ACCEPTED
164
$717,065
194
$732,150
15
$562,579
0
$0
54
$559,277
APPLICATIONS DENIED
288
$907,135
293
$751,787
43
$822,269
3
$702,440
104
$668,204
APPLICATIONS WITHDRAWN
181
$1,338,957
175
$581,487
11
$762,413
1
$2,640,000
53
$887,183
FILES CLOSED FOR INCOMPLETENESS
33
$665,908
36
$1,129,116
3
$149,907
0
$0
5
$589,602
Aggregated Statistics For Year 2005 (Based on 12 full and 6 partial tracts)
A) FHA, FSA/RHS & VA Home Purchase Loans
B) Conventional Home Purchase Loans
C) Refinancings
D) Home Improvement Loans
E) Loans on Dwellings For 5+ Families
F) Non-occupant Loans on < 5 Family Dwellings (A B C & D)
G) Loans On Manufactured Home Dwelling (A B C & D)
Number
Average Value
Number
Average Value
Number
Average Value
Number
Average Value
Number
Average Value
Number
Average Value
Number
Average Value
LOANS ORIGINATED
0
$0
793
$755,884
1,088
$622,104
97
$474,890
61
$2,539,532
228
$584,938
2
$398,080
APPLICATIONS APPROVED, NOT ACCEPTED
2
$162,690
180
$718,884
186
$611,412
13
$833,858
0
$0
26
$648,914
0
$0
APPLICATIONS DENIED
0
$0
204
$797,917
333
$676,780
43
$440,987
6
$1,501,827
53
$599,605
0
$0
APPLICATIONS WITHDRAWN
0
$0
122
$1,070,911
235
$746,116
12
$401,168
1
$4,000,000
31
$630,535
4
$358,272
FILES CLOSED FOR INCOMPLETENESS
0
$0
41
$671,243
65
$636,610
5
$719,508
0
$0
16
$646,962
0
$0
Aggregated Statistics For Year 2004 (Based on 12 full and 6 partial tracts)
B) Conventional Home Purchase Loans
C) Refinancings
D) Home Improvement Loans
E) Loans on Dwellings For 5+ Families
F) Non-occupant Loans on < 5 Family Dwellings (A B C & D)
G) Loans On Manufactured Home Dwelling (A B C & D)
Number
Average Value
Number
Average Value
Number
Average Value
Number
Average Value
Number
Average Value
Number
Average Value
LOANS ORIGINATED
940
$579,469
1,787
$538,837
48
$630,707
76
$3,363,200
301
$439,519
0
$0
APPLICATIONS APPROVED, NOT ACCEPTED
206
$635,594
289
$485,159
11
$390,936
1
$3,934,940
61
$463,526
2
$40,920
APPLICATIONS DENIED
165
$646,211
357
$523,408
37
$254,421
8
$2,387,788
42
$420,457
0
$0
APPLICATIONS WITHDRAWN
137
$604,163
254
$660,453
9
$232,552
2
$1,510,000
33
$347,401
0
$0
FILES CLOSED FOR INCOMPLETENESS
20
$646,292
71
$499,219
3
$681,113
0
$0
8
$378,212
0
$0
Aggregated Statistics For Year 2003 (Based on 12 full and 6 partial tracts)
A) FHA, FSA/RHS & VA Home Purchase Loans
B) Conventional Home Purchase Loans
C) Refinancings
D) Home Improvement Loans
E) Loans on Dwellings For 5+ Families
F) Non-occupant Loans on < 5 Family Dwellings (A B C & D)
Number
Average Value
Number
Average Value
Number
Average Value
Number
Average Value
Number
Average Value
Number
Average Value
LOANS ORIGINATED
1
$273,360
947
$501,227
3,938
$441,376
15
$185,202
79
$1,445,983
411
$326,149
APPLICATIONS APPROVED, NOT ACCEPTED
0
$0
156
$574,530
599
$406,768
18
$306,182
2
$1,382,495
67
$290,154
APPLICATIONS DENIED
0
$0
180
$463,866
611
$406,098
16
$74,179
3
$1,696,293
98
$336,947
APPLICATIONS WITHDRAWN
0
$0
139
$462,375
520
$406,952
6
$397,388
4
$847,320
58
$279,918
FILES CLOSED FOR INCOMPLETENESS
0
$0
52
$572,576
186
$455,749
1
$20,760
0
$0
17
$241,622
Aggregated Statistics For Year 2002 (Based on 9 full tracts)
A) FHA, FSA/RHS & VA Home Purchase Loans
B) Conventional Home Purchase Loans
C) Refinancings
D) Home Improvement Loans
E) Loans on Dwellings For 5+ Families
F) Non-occupant Loans on < 5 Family Dwellings (A B C & D)
Number
Average Value
Number
Average Value
Number
Average Value
Number
Average Value
Number
Average Value
Number
Average Value
LOANS ORIGINATED
0
$0
817
$463,471
2,652
$493,522
11
$193,635
19
$3,513,707
234
$316,110
APPLICATIONS APPROVED, NOT ACCEPTED
0
$0
131
$499,355
499
$445,101
5
$211,126
4
$4,771,140
36
$260,292
APPLICATIONS DENIED
0
$0
130
$525,952
335
$447,759
13
$75,054
2
$885,195
52
$402,418
APPLICATIONS WITHDRAWN
2
$132,745
103
$473,064
302
$473,642
6
$43,188
2
$2,645,635
41
$375,697
FILES CLOSED FOR INCOMPLETENESS
0
$0
51
$451,284
96
$411,383
0
$0
0
$0
15
$346,895
Aggregated Statistics For Year 2001 (Based on 9 full tracts)
A) FHA, FSA/RHS & VA Home Purchase Loans
B) Conventional Home Purchase Loans
C) Refinancings
D) Home Improvement Loans
E) Loans on Dwellings For 5+ Families
F) Non-occupant Loans on < 5 Family Dwellings (A B C & D)
Number
Average Value
Number
Average Value
Number
Average Value
Number
Average Value
Number
Average Value
Number
Average Value
LOANS ORIGINATED
2
$111,500
655
$431,232
1,284
$481,170
41
$106,960
17
$1,137,051
161
$379,707
APPLICATIONS APPROVED, NOT ACCEPTED
0
$0
110
$463,343
253
$378,732
8
$55,969
0
$0
30
$236,365
APPLICATIONS DENIED
2
$28,945
136
$426,873
256
$415,749
29
$54,954
6
$1,706,215
28
$322,186
APPLICATIONS WITHDRAWN
0
$0
119
$415,427
209
$409,149
7
$46,959
5
$3,050,264
22
$334,488
FILES CLOSED FOR INCOMPLETENESS
0
$0
24
$401,673
100
$417,042
2
$99,460
6
$6,398,080
5
$212,722
Aggregated Statistics For Year 2000 (Based on 9 full tracts)
A) FHA, FSA/RHS & VA Home Purchase Loans
B) Conventional Home Purchase Loans
C) Refinancings
D) Home Improvement Loans
E) Loans on Dwellings For 5+ Families
F) Non-occupant Loans on < 5 Family Dwellings (A B C & D)
Number
Average Value
Number
Average Value
Number
Average Value
Number
Average Value
Number
Average Value
Number
Average Value
LOANS ORIGINATED
0
$0
706
$436,607
281
$426,320
60
$101,448
37
$1,527,853
78
$364,058
APPLICATIONS APPROVED, NOT ACCEPTED
0
$0
165
$487,996
53
$422,194
14
$100,069
0
$0
22
$272,814
APPLICATIONS DENIED
0
$0
180
$478,606
147
$372,978
42
$76,159
10
$1,191,174
45
$452,362
APPLICATIONS WITHDRAWN
2
$102,000
117
$402,290
95
$363,080
6
$58,175
7
$3,881,836
30
$649,912
FILES CLOSED FOR INCOMPLETENESS
0
$0
51
$451,710
46
$406,850
2
$29,840
4
$2,130,930
16
$334,286
Aggregated Statistics For Year 1999 (Based on 4 full and 4 partial tracts)
A) FHA, FSA/RHS & VA Home Purchase Loans
B) Conventional Home Purchase Loans
C) Refinancings
D) Home Improvement Loans
E) Loans on Dwellings For 5+ Families
F) Non-occupant Loans on < 5 Family Dwellings (A B C & D)
2005 - 2018 National Fire Incident Reporting System (NFIRS) incidents
According to the data from the years 2005 - 2018 the average number of fires per year is 72. The highest number of fire incidents - 99 took place in 2005, and the least - 47 in 2014. The data has a decreasing trend.
When looking into fire subcategories, the most incidents belonged to: Structure Fires (59.6%), and Outside Fires (20.5%).
Fire incident types reported to NFIRS in Zip Code 90024


 Nearest zip codes: 90095, 90067, 90025, 90073, 90064, 90212.


 According to the data from the years 2005 - 2018 the average number of fires per year is 72. The highest number of fire incidents - 99 took place in 2005, and the least - 47 in 2014. The data has a decreasing trend.
 When looking into fire subcategories, the most incidents belonged to: Structure Fires (59.6%), and Outside Fires (20.5%).