Estimated zip code population in 2022: 2,630 Zip code population in 2010: 2,424 Zip code population in 2000: 2,524
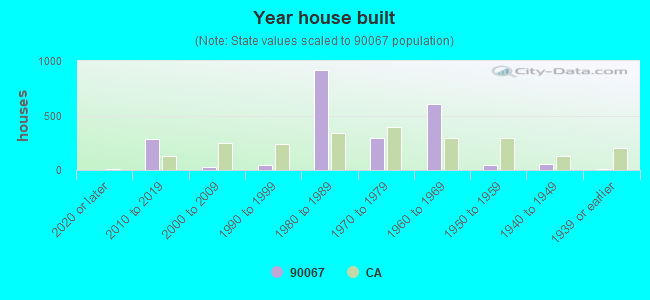
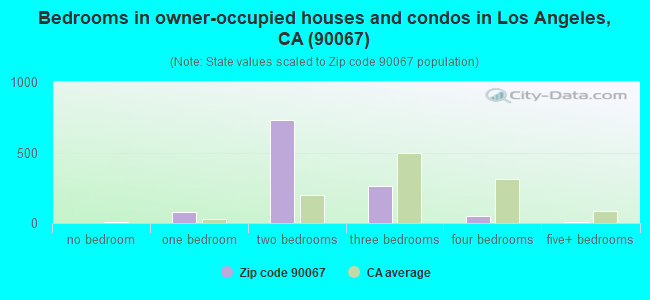
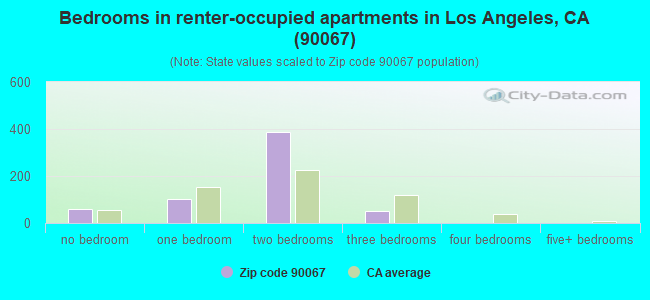
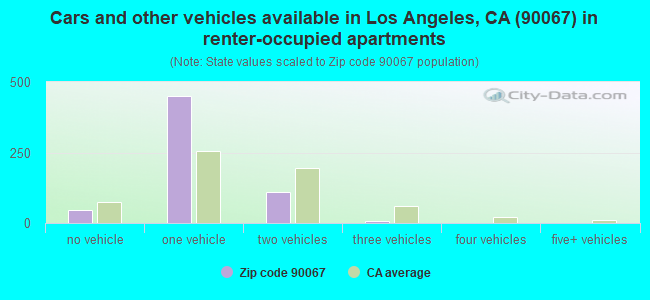
Houses and condos: 2,281 Renter-occupied apartments: 606
% of renters here:
35%
State:
44%
March 2022 cost of living index in zip code 90067: 146.9 (very high, U.S. average is 100)
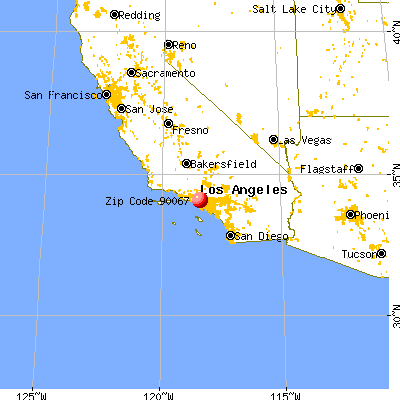
Land area: 0.3 sq. mi. Water area: 0.0 sq. mi.
Population density: 8,015 people per square mile
(high).
OSM Map
General Map
Google Map
MSN Map
OSM Map
General Map
Google Map
MSN Map
OSM Map
General Map
Google Map
MSN Map
OSM Map
General Map
Google Map
MSN Map
Please wait while loading the map...
Real estate property taxes paid for housing units in 2022:
This zip code:
0.6% ($10,292)
California:
0.7% ($4,831)
Median real estate property taxes paid for housing units with mortgages in 2022: $10,330 (0.6%) Median real estate property taxes paid for housing units with no mortgage in 2022: $10,572 (0.6%)
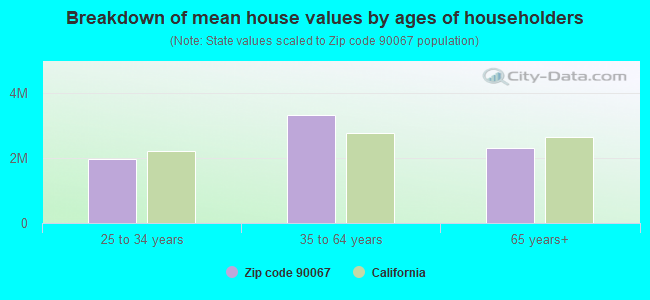
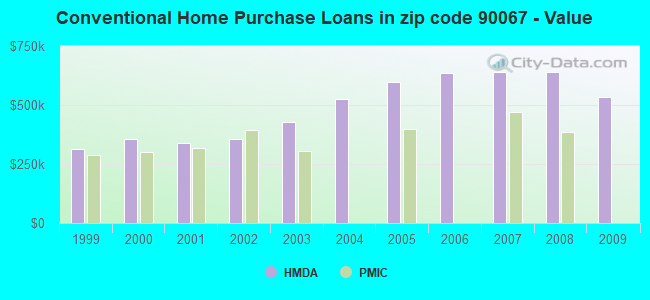
Estimated median house/condo value in 2022: $1,660,480
90067:
$1,660,480
California:
$715,900
According to our research of California and other state lists, there were 2 registered sex offenders living in 90067 zip code as of April 27, 2024. The ratio of all residents to sex offenders in zip code 90067 is 1,194 to 1. The ratio of registered sex offenders to all residents in this zip code is lower than the state average.
Median resident age:
This zip code:
60.7 years
California median age:
37.9 years
Average household size:
This zip code:
1.5 people
California:
2.8 people
Averages for the 2020 tax year for zip code 90067, filed in 2021:
Average Adjusted Gross Income (AGI) in 2020: $1,073,043 (Individual Income Tax Returns)
Here:
$1,073,043
State:
$95,910
Salary/wage: $742,788 (reported on 62.6% of returns)
Here:
$742,788
State:
$77,331
(% of AGI for various income ranges: 1259.5% for AGIs below $25k, 4229.0% for AGIs $25k-50k, 7602.0% for AGIs $50k-75k, 10242.9% for AGIs $75k-100k, 22803.6% for AGIs $100k-200k, 496325.9% for AGIs over 200k)
Taxable interest for individuals: $61,484 (reported on 72.5% of returns)
This zip code:
$61,484
California:
$2,294
(% of AGI for various income ranges: 246.3% for AGIs below $25k, 452.0% for AGIs $25k-50k, 413.0% for AGIs $50k-75k, 701.4% for AGIs $75k-100k, 1887.1% for AGIs $100k-200k, 47791.6% for AGIs over 200k)
Ordinary dividends: $79,774 (reported on 64.0% of returns)
Here:
$79,774
State:
$10,949
(% of AGI for various income ranges: 495.3% for AGIs below $25k, 1363.0% for AGIs $25k-50k, 1525.0% for AGIs $50k-75k, 2452.9% for AGIs $75k-100k, 5682.1% for AGIs $100k-200k, 52121.6% for AGIs over 200k)
Net capital gain/loss in AGI: +$381,439 (reported on 62.6% of returns)
Here:
+$381,439
State:
+$49,306
(% of AGI for various income ranges: 159.5% for AGIs below $25k, 792.0% for AGIs $25k-50k, 1386.0% for AGIs $50k-75k, 1532.9% for AGIs $75k-100k, 4227.1% for AGIs $100k-200k, 260471.6% for AGIs over 200k)
Profit/loss from business: +$194,542 (reported on 34.6% of returns)
Here:
+$194,542
State:
+$15,671
(% of AGI for various income ranges: 638.9% for AGIs below $25k, 2125.0% for AGIs $25k-50k, 3246.0% for AGIs $50k-75k, 2730.0% for AGIs $75k-100k, 6215.7% for AGIs $100k-200k, 68794.7% for AGIs over 200k)
Taxable individual retirement arrangement distribution: $73,992 (reported on 11.3% of returns)
90067:
$73,992
California:
$23,505
(% of AGI for various income ranges: 266.8% for AGIs below $25k, 424.0% for AGIs $50k-75k, 1092.9% for AGIs $75k-100k, 3299.3% for AGIs $100k-200k, 7275.6% for AGIs over 200k)
Self-employed (Keogh) retirement plans: $48,509 (reported on 6.5% of returns)
90067:
$48,509
California:
$30,163
(% of AGI for various income ranges: 208.0% for AGIs $25k-50k, 517.1% for AGIs $100k-200k, 3195.3% for AGIs over 200k)
Total itemized deductions: $133,369 (reported on 50.7% of returns)
Here:
$133,369
State:
$39,517
(% of AGI for various income ranges: 1000.5% for AGIs below $25k, 2330.0% for AGIs $25k-50k, 3208.0% for AGIs $50k-75k, 4950.0% for AGIs $75k-100k, 8605.0% for AGIs $100k-200k, 67431.2% for AGIs over 200k)
Charity contributions: $91,152 (reported on 43.9% of returns)
Here:
$91,152
State:
$12,598
(% of AGI for various income ranges: 53.2% for AGIs below $25k, 210.0% for AGIs $25k-50k, 346.0% for AGIs $50k-75k, 511.4% for AGIs $75k-100k, 1377.9% for AGIs $100k-200k, 43231.6% for AGIs over 200k)
Taxes paid: $9,344 (reported on 50.7% of returns)
90067:
$9,344
State:
$8,807
(% of AGI for various income ranges: 244.7% for AGIs below $25k, 462.0% for AGIs $25k-50k, 696.0% for AGIs $50k-75k, 911.4% for AGIs $75k-100k, 1814.3% for AGIs $100k-200k, 3726.3% for AGIs over 200k)
Earned income credit: $1,033 (reported on 2.5% of returns)
Here:
$1,033
State:
$2,074
(% of AGI for various income ranges: 48.9% for AGIs below $25k)
Percentage of individuals using paid preparers for their 2020 taxes: 95.8%
Here:
96%
State:
92%
(% for various income ranges: 96.3% for AGIs below $25k, 93.5% for AGIs $25k-50k, 96.3% for AGIs $50k-75k, 95.2% for AGIs $75k-100k, 94.5% for AGIs $100k-200k, 96.4% for AGIs over 200k)
Averages for the 2012 tax year for zip code 90067, filed in 2013:
Average Adjusted Gross Income (AGI) in 2012: $856,955 (Individual Income Tax Returns)
Here:
$856,955
State:
$72,726
Salary/wage: $558,138 (reported on 62.2% of returns)
Here:
$558,138
State:
$59,079
(% of AGI for various income ranges: 43.0% for AGIs below $25k, 49.9% for AGIs $25k-50k, 45.8% for AGIs $50k-75k, 43.6% for AGIs $75k-100k, 38.9% for AGIs $100k-200k, 40.4% for AGIs over 200k)
Taxable interest for individuals: $51,269 (reported on 72.0% of returns)
This zip code:
$51,269
California:
$2,146
(% of AGI for various income ranges: 11.2% for AGIs below $25k, 4.6% for AGIs $25k-50k, 5.2% for AGIs $50k-75k, 5.5% for AGIs $75k-100k, 3.1% for AGIs $100k-200k, 4.3% for AGIs over 200k)
Ordinary dividends: $58,989 (reported on 60.0% of returns)
Here:
$58,989
State:
$9,308
(% of AGI for various income ranges: 17.2% for AGIs below $25k, 6.9% for AGIs $25k-50k, 8.0% for AGIs $50k-75k, 9.0% for AGIs $75k-100k, 7.2% for AGIs $100k-200k, 3.9% for AGIs over 200k)
Net capital gain/loss in AGI: +$286,703 (reported on 60.0% of returns)
Here:
+$286,703
State:
+$30,460
(% of AGI for various income ranges: 2.8% for AGIs below $25k, 2.3% for AGIs $25k-50k, 3.7% for AGIs $50k-75k, 3.9% for AGIs $75k-100k, 4.7% for AGIs $100k-200k, 20.9% for AGIs over 200k)
Profit/loss from business: +$213,217 (reported on 29.5% of returns)
Here:
+$213,217
State:
+$17,064
(% of AGI for various income ranges: 15.4% for AGIs below $25k, 12.4% for AGIs $25k-50k, 9.7% for AGIs $50k-75k, 10.4% for AGIs $75k-100k, 9.4% for AGIs $100k-200k, 7.2% for AGIs over 200k)
Taxable individual retirement arrangement distribution: $87,022 (reported on 17.8% of returns)
90067:
$87,022
California:
$19,557
(% of AGI for various income ranges: 3.3% for AGIs below $25k, 4.6% for AGIs $25k-50k, 4.6% for AGIs $50k-75k, 8.1% for AGIs $75k-100k, 7.7% for AGIs $100k-200k, 1.6% for AGIs over 200k)
Self-employment retirement plans: $44,716 (reported on 5.8% of returns)
90067:
$44,716
California:
$24,530
Total itemized deductions: $237,379 (21% of AGI, reported on 73.5% of returns)
Here:
$237,379
State:
$34,004
Here:
20.6% of AGI
State:
22.7% of AGI
(% of AGI for various income ranges: 55.3% for AGIs below $25k, 32.0% for AGIs $25k-50k, 32.0% for AGIs $50k-75k, 29.1% for AGIs $75k-100k, 28.7% for AGIs $100k-200k, 19.9% for AGIs over 200k)
Charity contributions: $61,660 (reported on 62.8% of returns)
Here:
$61,660
State:
$4,659
(% of AGI for various income ranges: 2.7% for AGIs below $25k, 1.8% for AGIs $25k-50k, 2.6% for AGIs $50k-75k, 2.4% for AGIs $75k-100k, 2.9% for AGIs $100k-200k, 4.6% for AGIs over 200k)
Taxes paid: $138,065 (reported on 73.5% of returns)
90067:
$138,065
State:
$14,448
(% of AGI for various income ranges: 15.5% for AGIs below $25k, 7.0% for AGIs $25k-50k, 8.6% for AGIs $50k-75k, 10.1% for AGIs $75k-100k, 10.3% for AGIs $100k-200k, 11.9% for AGIs over 200k)
Earned income credit: $810 (reported on 3.1% of returns)
Here:
$810
State:
$2,286
(% of AGI for various income ranges: 1.4% for AGIs below $25k)
Percentage of individuals using paid preparers for their 2012 taxes: 88.9%
Here:
89%
State:
64%
(% for various income ranges: 84.7% for AGIs below $25k, 78.1% for AGIs $25k-50k, 80.0% for AGIs $50k-75k, 87.5% for AGIs $75k-100k, 89.1% for AGIs $100k-200k, 95.4% for AGIs over 200k)
Averages for the 2004 tax year for zip code 90067, filed in 2005:
Average Adjusted Gross Income (AGI) in 2004: $595,927 (Individual Income Tax Returns)
Here:
$595,927
State:
$58,600
Salary/wage: $430,651 (reported on 57.0% of returns)
Here:
$430,651
State:
$49,455
(% of AGI for various income ranges: 38.7% for AGIs $10k-25k, 49.5% for AGIs $25k-50k, 39.1% for AGIs $50k-75k, 43.7% for AGIs $75k-100k, 38.3% for AGIs over 100k)
Taxable interest for individuals: $51,511 (reported on 79.9% of returns)
This zip code:
$51,511
California:
$2,365
(% of AGI for various income ranges: 12.6% for AGIs $10k-25k, 8.7% for AGIs $25k-50k, 8.1% for AGIs $50k-75k, 7.8% for AGIs $75k-100k, 6.2% for AGIs over 100k)
Taxable dividends: $44,187 (reported on 66.2% of returns)
Here:
$44,187
State:
$4,746
(% of AGI for various income ranges: 9.8% for AGIs $10k-25k, 8.4% for AGIs $25k-50k, 8.4% for AGIs $50k-75k, 6.8% for AGIs $75k-100k, 4.5% for AGIs over 100k)
Net capital gain/loss: +$263,637 (reported on 65.5% of returns)
Here:
+$263,637
State:
+$23,418
(% of AGI for various income ranges: 6.8% for AGIs $10k-25k, 1.8% for AGIs $25k-50k, 3.0% for AGIs $50k-75k, 4.1% for AGIs $75k-100k, 27.3% for AGIs over 100k)
Profit/loss from business: +$126,263 (reported on 27.1% of returns)
Here:
+$126,263
State:
+$16,826
(% of AGI for various income ranges: 25.9% for AGIs $10k-25k, 8.8% for AGIs $25k-50k, 8.3% for AGIs $50k-75k, 10.8% for AGIs $75k-100k, 5.2% for AGIs over 100k)
IRA payment deduction: $3,603 (reported on 2.6% of returns)
90067:
$3,603
California:
$3,192
Self-employed pension: $42,801 (reported on 5.0% of returns)
Here:
$42,801
California:
$17,688
(% of AGI for various income ranges: 1.4% for AGIs $50k-75k, 0.8% for AGIs $75k-100k, 0.3% for AGIs over 100k)
Total itemized deductions: $168,418 (19% of AGI, reported on 71.7% of returns)
Here:
$168,418
State:
$28,113
Here:
19.3% of AGI
State:
25.3% of AGI
(% of AGI for various income ranges: 55.6% for AGIs $10k-25k, 35.7% for AGIs $25k-50k, 42.8% for AGIs $50k-75k, 30.4% for AGIs $75k-100k, 18.5% for AGIs over 100k)
Charity contributions deductions: $50,177 (5% of AGI, reported on 62.3% of returns)
Here:
$50,177
State:
$3,923
Here:
5.1% of AGI
State:
3.3% of AGI
(% of AGI for various income ranges: 3.1% for AGIs $10k-25k, 2.8% for AGIs $25k-50k, 4.4% for AGIs $50k-75k, 3.4% for AGIs $75k-100k, 5.0% for AGIs over 100k)
Total tax: $175,585 (reported on 84.4% of returns)
90067:
$175,585
State:
$10,761
(% of AGI for various income ranges: 8.2% for AGIs $10k-25k, 8.5% for AGIs $25k-50k, 10.9% for AGIs $50k-75k, 12.8% for AGIs $75k-100k, 23.7% for AGIs over 100k)
Earned income credit: $667 (reported on 2.5% of returns)
Here:
$667
State:
$1,763
Percentage of individuals using paid preparers for their 2004 taxes: 89.0%
Here:
89%
State:
66%
(% for various income ranges: 84.6% for AGIs below $10k, 84.9% for AGIs $10k-25k, 84.0% for AGIs $25k-50k, 87.6% for AGIs $50k-75k, 86.7% for AGIs $75k-100k, 93.2% for AGIs over 100k)
Likely homosexual households (counted as self-reported same-sex unmarried-partner households)
Lesbian couples: 0.0% of all households
Gay men: 0.5% of all households
Household received Food Stamps/SNAP in the past 12 months: 0 Household did not receive Food Stamps/SNAP in the past 12 months: 1,701
Women who had a birth in the past 12 months: 11 (11 now married, 0 unmarried) Women who did not have a birth in the past 12 months: 469 (139 now married, 331 unmarried)
Housing units in zip code 90067 with a mortgage: 585 (121 second mortgage, 126 both second mortgage and home equity loan) Houses without a mortgage: 14
Median monthly owner costs for units with a mortgage: $3,876 Median monthly owner costs for units without a mortgage: $1,556
Residents with income below the poverty level in 2022:
This zip code:
6.7%
Whole state:
12.2%
Residents with income below 50% of the poverty level in 2022:
This zip code:
3.0%
Whole state:
6.2%
Median number of rooms in houses and condos:
Here:
4.8
State:
6.0
Median number of rooms in apartments:
Here:
3.8
State:
3.9
Notable locations in this zip code not listed on our city pages
Tourist attractions (not listed on the city page) : Queensland Tourism (Tourism Consultants; 1800 Century Park East), Australian Tourist Commission (2049 Century Park East Suite 1920).
In group quarters: 15 (-1 institutionalized population)
Size of family households: 410 2-persons, 75 3-persons, 68 4-persons, 8 5-persons
Size of nonfamily households: 1,120 1-person, 89 2-persons
175 married couples with children.
107 single-parent households (26 men, 81 women).
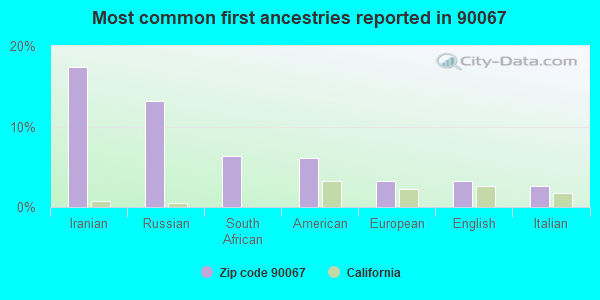
66.4% of residents of 90067 zip code speak English at home.
0.8% of residents speak Spanish at home (100% very well).
19.6% of residents speak other Indo-European language at home (85% very well, 7% well, 7% not well).
15.2% of residents speak Asian or Pacific Island language at home (65% very well, 13% well, 22% not well).
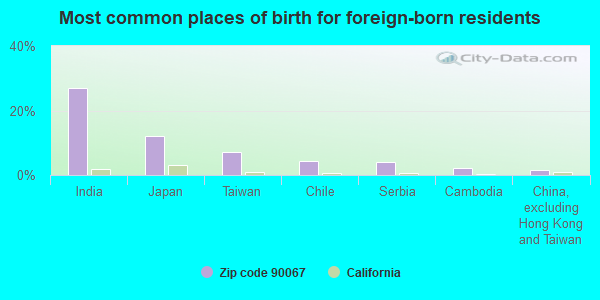
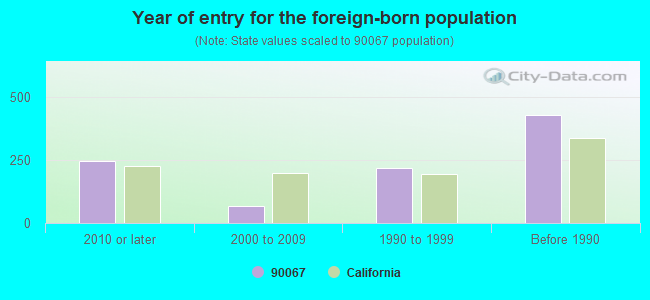
Foreign born population: 957 (36.4%) (84.5% of them are naturalized citizens)
Major facilities with environmental interests located in this zip code:
NORTHROP GRUMMAN SYSTEMS CORP. (1840 CENTURY PARK EAST in LOS ANGELES,, CA)
ENFORCEMENT/COMPLIANCE ACTIVITY (Integrated Compliance Information System) - ICIS-HQ-2001-5020, FORMAL ENFORCEMENT ACTION (Integrated Compliance Information System) - ICIS-HQ-2001-5020, FORMAL ENFORCEMENT ACTION (Tracking inspections of insecticide, fungicide, and rodenticide, and toxic substances) - ICIS-, ENFORCEMENT/COMPLIANCE ACTIVITY COMPLIANCE ACTIVITY (Tracking inspections of insecticide, fungicide, and rodenticide, and toxic substances) Small Quantity Generators, between 100 kg and 1000 kg of hazardous waste/month (Resource Conservation and Recovery Act (tracking hazardous waste)) Business NAICS classification: AIRCRAFT MANUFACTURING. Alternative names: NORTHROP CORP
CENTRAL PLANTS INCORPORATED (2052 CENTURY PARK EAST in LOS ANGELES, CA)
AIR MAJOR (AIRS/AFS) STATE MASTER (California - Hazardous Waste Tracking) - HAZARDOU WASTE PROGRAM CRITERIA AND HAZARDOUS AIR POLLUTANT INVENTORY (Inventory of air pollution sources) HAZARDOUS WASTE BIENNIAL REPORTER (Resource Conservation and Recovery Act (tracking hazardous waste)) Small Quantity Generators, between 100 kg and 1000 kg of hazardous waste/month (Resource Conservation and Recovery Act (tracking hazardous waste)) Business SIC and NAICS classification: STEAM AND AIR-CONDITIONING SUPPLY Alternative names: CENCITY ASC CENTURY CTY CNTRL PLT
ENTERTAINMENT CENTER LLC (2020 AVE OF THE STARS in CENTURY CITY, CA)
STATE MASTER (California - Hazardous Waste Tracking) - HAZARDOU WASTE PROGRAM Large Quantity Generators, more that 1000 kg of hazardous waste/month (Resource Conservation and Recovery Act (tracking hazardous waste))
CENTURY CITY HOSPITAL (2070 CENTURY PARK EAST in LOS ANGELES, CA)
STATE MASTER (California - Hazardous Waste Tracking) - HAZARDOU WASTE PROGRAM Small Quantity Generators, between 100 kg and 1000 kg of hazardous waste/month (Resource Conservation and Recovery Act (tracking hazardous waste)) - notification Organizations: SALUS SURGICAL GROUP LLC (CONTACT/OPERATOR)
, CENTURY CITY MEDICAL PLAZA (CONTACT/OWNER)
AMERICAN BROADCASTING CORPORATION (ABC) (2040 AVENUE OF THE STARS in CENTURY CITY, CA)
AGFA GEVAERT INC (1801 CENTURY PARK EAST in LOS ANGELES, CA)
(Resource Conservation and Recovery Act (tracking hazardous waste)) Organizations: JMB GROUP INC (CONTACT/OWNER)
CENTURY CITY NORTH OFFICE BLDG (10100 SANTA MONICA BLVD in LOS ANGELES, CA)
Large Quantity Generators, more that 1000 kg of hazardous waste/month (Resource Conservation and Recovery Act (tracking hazardous waste)) Organizations: JMB INCOME PROPERTIES LTD (CONTACT/OWNER)
GESTETNER CORP (3000 BEVERLY BLVD in LOS ANGELES, CA)
Small Quantity Generators, between 100 kg and 1000 kg of hazardous waste/month (Resource Conservation and Recovery Act (tracking hazardous waste)) - notification Organizations: KBW BUILDINGS (CONTACT/OWNER)
KIPER LASCU LTD (1925 CENTURY PARK EAST STE2310 in LOS ANGELES, CA)
Small Quantity Generators, between 100 kg and 1000 kg of hazardous waste/month (Resource Conservation and Recovery Act (tracking hazardous waste)) - notification Organizations: CYNTHIA KIPER (CONTACT/OWNER)
CENTURY PARK PLAZA (1801 CENTURY E #820 in LOS ANGELES, CA)
Small Quantity Generators, between 100 kg and 1000 kg of hazardous waste/month (Resource Conservation and Recovery Act (tracking hazardous waste)) Organizations: JMB GROUP TRUST (CONTACT/OWNER)
1900/1901 AVE OF THE STARS #675 (1901 AVE OF THE STARS in LOS ANGELES, CA)
Small Quantity Generators, between 100 kg and 1000 kg of hazardous waste/month (Resource Conservation and Recovery Act (tracking hazardous waste))
M R INSTITUTE OF CENTURY CITY (2070 CENTURY PARK EAST in LOS ANGELES, CA)
Small Quantity Generators, between 100 kg and 1000 kg of hazardous waste/month (Resource Conservation and Recovery Act (tracking hazardous waste)) - notification Organizations: MOBILE M R INC (CONTACT/OWNER)
CENTURY CITY CAR CARE (1800 AVE OF THE STARS LVL B in CENTURY CITY, CA)
Small Quantity Generators, between 100 kg and 1000 kg of hazardous waste/month (Resource Conservation and Recovery Act (tracking hazardous waste)) - notification Organizations: ROY ELISHMERNI (CONTACT/OWNER)
Housing units lacking complete kitchen facilities: 0.5%
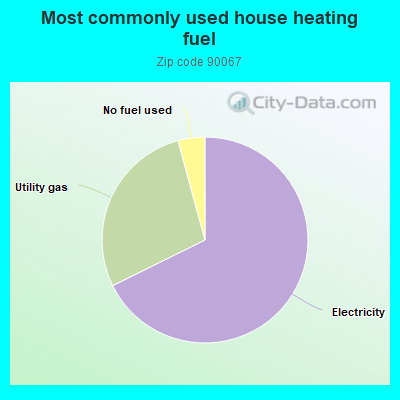
67.7%Electricity
28.1%Utility gas
4.2%No fuel used
Population in 1990: 2,731.
Place of birth for U.S.-born residents:
This state: 638
Northeast: 499
Midwest: 265
South: 166
West: 84
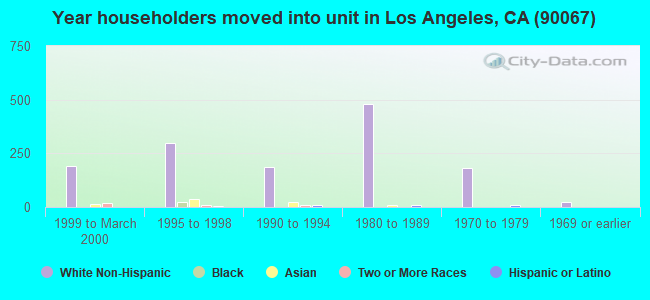
64% of the 90067 zip code residents lived in the same house 5 years ago. Out of people who lived in different houses, 81% lived in this county. Out of people who lived in different counties, 50% lived in California.
92% of the 90067 zip code residents lived in the same house 1 year ago. Out of people who lived in different houses, 76% moved from this county. Out of people who lived in different houses, 14% moved from different county within same state. Out of people who lived in different houses, 9% moved from abroad.
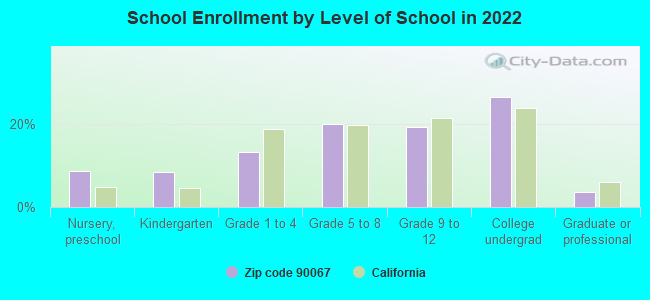
Private vs. public school enrollment:
Students in private schools in grades 1 to 8 (elementary and middle school): 61
Here:
52.7%
California:
10.5%
Students in private schools in grades 9 to 12 (high school): 51
Here:
77.5%
California:
8.5%
Students in private undergraduate colleges: 70
Here:
75.2%
California:
15.9%
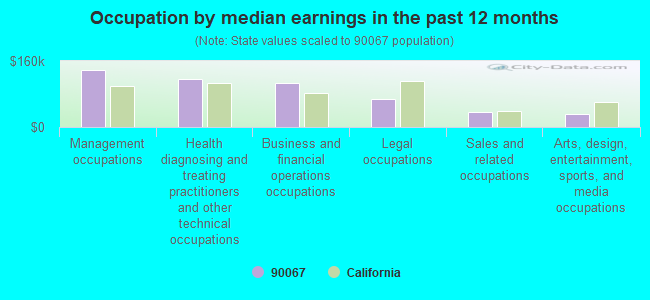
Occupation by median earnings in the past 12 months ($)
137,843Management occupations
115,238Health diagnosing and treating practitioners and other technical occupations
106,610Business and financial operations occupations
68,399Legal occupations
35,875Sales and related occupations
32,701Arts, design, entertainment, sports, and media occupations
Companies with federal contracts located in this zip code:
NORTHROP GRUMMAN SYSTEMS CORPO (1840 CENTURY PARK E in LOS ANGELES, CA) : $100,942,382 in 392 contractsfrom 1999 to 2006
Contracts for ADP Support Equipment, Aircraft Gunnery Fire Control Components, Systems Engineering Services, Other Defense -- Applied Research and Exploratory Development (R&D), and moreby Internal Revenue Service, Air Force, Office of Policy, Management and Budget/Chief Financial Officer, Army, and others Signed by year:2000: $37,871,096; 2001: $10,076,529; 2002: $2,488,180; 2003: $3,309,433; 2004: $22,212,700; 2005: $18,229,160; 2006: $1,930,143.
Biggest contracts:
$16,243,069 with Internal Revenue Service for ADP Support Equipment. Taking place in DC. Signed on 2004-07-09. Effective on 2004-05-26. Completion date: 2004-12-26.
$7,326,544 with Air Force for Aircraft Gunnery Fire Control Components. Taking place in MD. Signed on 2000-03-28. Completion date: 2002-05-31.
$4,300,000 with Air Force for Systems Engineering Services. Taking place in MD. Signed on 2000-03-16. Completion date: 2001-04-01.
$3,683,756 with Air Force for Aircraft Gunnery Fire Control Components. Taking place in MD. Signed on 2000-08-25. Completion date: 2002-05-31.
RON V BROWN INTERNATIONAL (2122 CENTURY PARK LANE, SU in LOS ANGELES, CA; small business) : $1,272,356 in 30 contractsfrom 2000 to 2005
Contracts for Miscellaneous Items by Department of Defense, American Forces Information Service Signed by year:2000: $120,112; 2001: $346,611; 2002: $254,319; 2003: $202,115; 2004: $151,044; 2005: $198,155; 2006: $0.
Biggest contracts:
$186,173 with Department of Defense for Miscellaneous Items. Signed on 2001-09-26. Completion date: 2001-07-01.
$162,630 with American Forces Information Service for Miscellaneous Items. Signed on 2003-11-17. Completion date: 2004-07-02.
$155,985 with Department of Defense for Miscellaneous Items. Signed on 2001-01-24. Completion date: 2001-07-31.
$102,224 with American Forces Information Service for Miscellaneous Items. Signed on 2005-05-25. Completion date: 2005-07-01.
SAMS VENTURE LLC (1900AVE OF THE STARS#320 in LOS ANGELES, CA) : $380,231 in 2 contractsin 2004
$365,231 with Air Force for Installation of Equipment -- Recreational and Athletic Equipment. Signed on 2004-08-20. Completion date: 2004-11-15.
$15,000, same as above.Signed on 2004-09-30. Completion date: 2004-11-15.
alix partners,llc (1999 Avenue of the Stars in Los Angeles, CA; small business) : $110,036 in 2 contractsfrom 2005 to 2006
$55,018 with Offices, Boards and Divisions (includes Attorney General, Deputy Attorney General, etc.) for Expert Witness. Taking place in VA. Signed on 2006-01-01. Completion date: 2006-10-31.
$55,018, same as above.Signed on 2005-07-01. Completion date: 2005-12-31.
LOU RAWLS PRODUCTION INC (1880 CENTURY PARK E STE 16 in LOS ANGELES, CA; small business) : $45,000 in 2 contractsin 2003
$35,000 with Army for Communications Services. Taking place in VA. Signed on 2003-10-21. Completion date: 2003-12-14.
$10,000, same as above.Signed on 2003-09-23. Completion date: 2003-12-11.
HENRY WINKLER PRODUCTIONS INC (1801 CENTURY PARK E in LOS ANGELES, CA; small business) : $37,039 in 3 contractsfrom 2001 to 2005
$24,079 with Public Buildings Service for A&E Inspection Services (non-construction). Taking place in OH. Signed on 2001-10-15. Completion date: 2002-10-15.
$8,000, same as above.Signed on 2002-03-15. Completion date: 2002-10-15.
$4,960 with Navy for Electrical and Electronic Properties Measuring and Testing Instruments. Signed on 2005-03-28. Completion date: 2005-04-06.
ECOMPUTERIZED PHYSICIAN RECORD (2160 CENTURY PARK E APT 21 in LOS ANGELES, CA; small business) : $14,541 in 2 contractsfrom 2005 to 2006
$24,927 with Navy for Communications Services. Signed on 2005-12-16. Completion date: 2006-12-18.
-$10,386, same as above.Signed on 2006-06-14. Effective on 2006-06-07. Completion date: 2006-06-30.
Top industries in this zip code by the number of employees in 2005:


 Nearest zip codes: 90212, 90064, 90024, 90034, 90035, 90211.