Estimated zip code population in 2022: 54,603 Zip code population in 2010: 57,964 Zip code population in 2000: 58,199
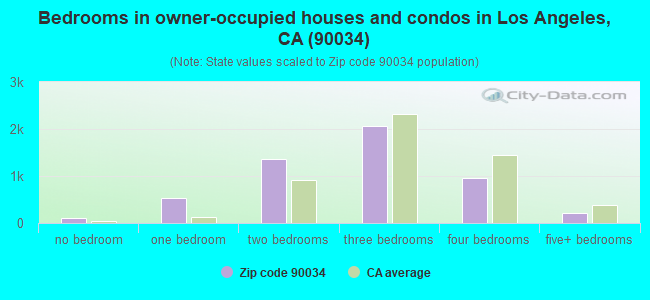
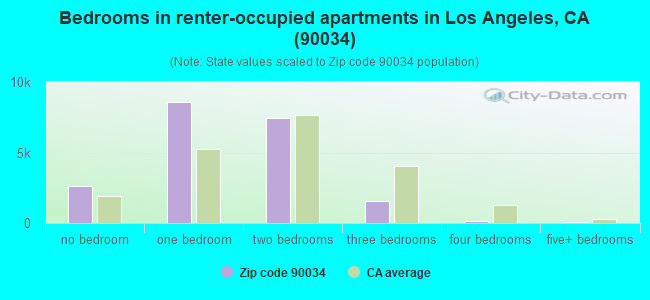
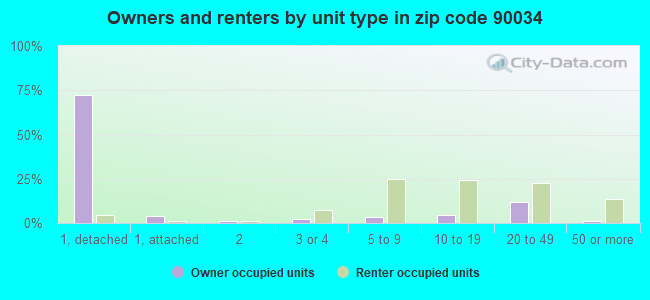
Houses and condos: 29,252 Renter-occupied apartments: 20,384
% of renters here:
80%
State:
44%
March 2022 cost of living index in zip code 90034: 145.0 (very high, U.S. average is 100)
Land area: 3.1 sq. mi. Water area: 0.0 sq. mi.
Population density: 17,553 people per square mile
(very high).
OSM Map
General Map
Google Map
MSN Map
OSM Map
General Map
Google Map
MSN Map
OSM Map
General Map
Google Map
MSN Map
OSM Map
General Map
Google Map
MSN Map
Please wait while loading the map...
Real estate property taxes paid for housing units in 2022:
This zip code:
0.5% ($6,739)
California:
0.7% ($4,831)
Median real estate property taxes paid for housing units with mortgages in 2022: $9,145 (0.6%) Median real estate property taxes paid for housing units with no mortgage in 2022: $3,152 (0.2%)
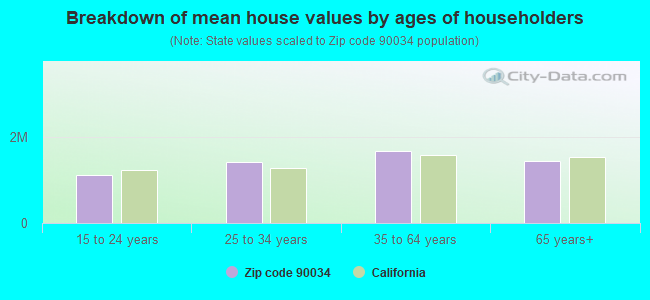
Estimated median house/condo value in 2022: $1,429,085
90034:
$1,429,085
California:
$715,900
According to our research of California and other state lists, there were 24 registered sex offenders living in 90034 zip code as of April 27, 2024. The ratio of all residents to sex offenders in zip code 90034 is 2,428 to 1. The ratio of registered sex offenders to all residents in this zip code is much lower than the state average.
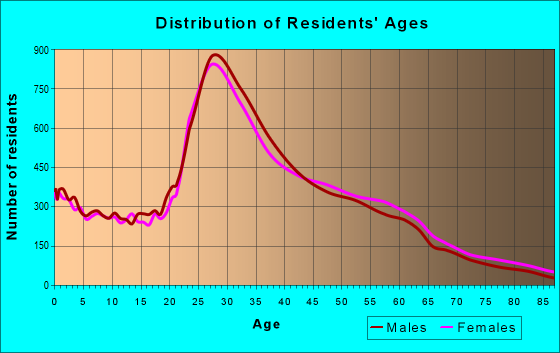
Median resident age:
This zip code:
35.3 years
California median age:
37.9 years
Average household size:
This zip code:
2.1 people
California:
2.8 people
Averages for the 2020 tax year for zip code 90034, filed in 2021:
Average Adjusted Gross Income (AGI) in 2020: $87,298 (Individual Income Tax Returns)
Here:
$87,298
State:
$95,910
Salary/wage: $76,056 (reported on 83.0% of returns)
Here:
$76,056
State:
$77,331
(% of AGI for various income ranges: 1140.8% for AGIs below $25k, 4246.7% for AGIs $25k-50k, 7657.8% for AGIs $50k-75k, 11953.5% for AGIs $75k-100k, 21507.7% for AGIs $100k-200k, 112697.9% for AGIs over 200k)
Taxable interest for individuals: $1,664 (reported on 30.7% of returns)
This zip code:
$1,664
California:
$2,294
(% of AGI for various income ranges: 16.7% for AGIs below $25k, 23.1% for AGIs $25k-50k, 42.1% for AGIs $50k-75k, 64.8% for AGIs $75k-100k, 124.0% for AGIs $100k-200k, 1378.1% for AGIs over 200k)
Ordinary dividends: $5,786 (reported on 24.8% of returns)
Here:
$5,786
State:
$10,949
(% of AGI for various income ranges: 26.1% for AGIs below $25k, 48.1% for AGIs $25k-50k, 77.8% for AGIs $50k-75k, 137.8% for AGIs $75k-100k, 316.7% for AGIs $100k-200k, 4723.7% for AGIs over 200k)
Net capital gain/loss in AGI: +$18,565 (reported on 24.4% of returns)
Here:
+$18,565
State:
+$49,306
(% of AGI for various income ranges: 20.1% for AGIs below $25k, 52.5% for AGIs $25k-50k, 70.4% for AGIs $50k-75k, 209.9% for AGIs $75k-100k, 539.1% for AGIs $100k-200k, 20056.8% for AGIs over 200k)
Profit/loss from business: +$12,701 (reported on 24.6% of returns)
Here:
+$12,701
State:
+$15,671
(% of AGI for various income ranges: 294.1% for AGIs below $25k, 279.9% for AGIs $25k-50k, 277.0% for AGIs $50k-75k, 330.4% for AGIs $75k-100k, 788.8% for AGIs $100k-200k, 5648.2% for AGIs over 200k)
Taxable individual retirement arrangement distribution: $18,551 (reported on 4.1% of returns)
90034:
$18,551
California:
$23,505
(% of AGI for various income ranges: 26.1% for AGIs below $25k, 44.2% for AGIs $25k-50k, 72.3% for AGIs $50k-75k, 119.1% for AGIs $75k-100k, 278.0% for AGIs $100k-200k, 1396.1% for AGIs over 200k)
Self-employed (Keogh) retirement plans: $29,397 (reported on 1.2% of returns)
90034:
$29,397
California:
$30,163
(% of AGI for various income ranges: 5.4% for AGIs $25k-50k, 8.6% for AGIs $50k-75k, 14.2% for AGIs $75k-100k, 90.1% for AGIs $100k-200k, 1285.8% for AGIs over 200k)
Total itemized deductions: $37,550 (reported on 10.5% of returns)
Here:
$37,550
State:
$39,517
(% of AGI for various income ranges: 67.3% for AGIs below $25k, 151.6% for AGIs $25k-50k, 245.7% for AGIs $50k-75k, 481.3% for AGIs $75k-100k, 1258.0% for AGIs $100k-200k, 10699.5% for AGIs over 200k)
Charity contributions: $11,220 (reported on 8.9% of returns)
Here:
$11,220
State:
$12,598
(% of AGI for various income ranges: 4.6% for AGIs below $25k, 18.0% for AGIs $25k-50k, 35.2% for AGIs $50k-75k, 77.9% for AGIs $75k-100k, 220.5% for AGIs $100k-200k, 3703.0% for AGIs over 200k)
Taxes paid: $8,646 (reported on 10.5% of returns)
90034:
$8,646
State:
$8,807
(% of AGI for various income ranges: 12.8% for AGIs below $25k, 30.9% for AGIs $25k-50k, 61.5% for AGIs $50k-75k, 130.7% for AGIs $75k-100k, 369.9% for AGIs $100k-200k, 2073.0% for AGIs over 200k)
Earned income credit: $1,408 (reported on 10.7% of returns)
Here:
$1,408
State:
$2,074
(% of AGI for various income ranges: 61.2% for AGIs below $25k, 32.6% for AGIs $25k-50k, 0.3% for AGIs $50k-75k)
Percentage of individuals using paid preparers for their 2020 taxes: 92.8%
Here:
93%
State:
92%
(% for various income ranges: 90.0% for AGIs below $25k, 93.1% for AGIs $25k-50k, 93.7% for AGIs $50k-75k, 93.9% for AGIs $75k-100k, 94.2% for AGIs $100k-200k, 95.5% for AGIs over 200k)
Averages for the 2012 tax year for zip code 90034, filed in 2013:
Average Adjusted Gross Income (AGI) in 2012: $58,560 (Individual Income Tax Returns)
Here:
$58,560
State:
$72,726
Salary/wage: $52,898 (reported on 85.4% of returns)
Here:
$52,898
State:
$59,079
(% of AGI for various income ranges: 74.7% for AGIs below $25k, 88.1% for AGIs $25k-50k, 88.0% for AGIs $50k-75k, 85.8% for AGIs $75k-100k, 80.1% for AGIs $100k-200k, 57.3% for AGIs over 200k)
Taxable interest for individuals: $1,426 (reported on 29.5% of returns)
This zip code:
$1,426
California:
$2,146
(% of AGI for various income ranges: 0.8% for AGIs below $25k, 0.4% for AGIs $25k-50k, 0.4% for AGIs $50k-75k, 0.6% for AGIs $75k-100k, 0.7% for AGIs $100k-200k, 1.1% for AGIs over 200k)
Ordinary dividends: $4,731 (reported on 17.0% of returns)
Here:
$4,731
State:
$9,308
(% of AGI for various income ranges: 1.3% for AGIs below $25k, 0.7% for AGIs $25k-50k, 0.8% for AGIs $50k-75k, 0.9% for AGIs $75k-100k, 1.3% for AGIs $100k-200k, 2.5% for AGIs over 200k)
Net capital gain/loss in AGI: +$9,857 (reported on 14.6% of returns)
Here:
+$9,857
State:
+$30,460
(% of AGI for various income ranges: 0.1% for AGIs $25k-50k, 0.2% for AGIs $50k-75k, 0.4% for AGIs $75k-100k, 1.3% for AGIs $100k-200k, 8.1% for AGIs over 200k)
Profit/loss from business: +$12,773 (reported on 23.1% of returns)
Here:
+$12,773
State:
+$17,064
(% of AGI for various income ranges: 16.5% for AGIs below $25k, 5.3% for AGIs $25k-50k, 3.2% for AGIs $50k-75k, 3.4% for AGIs $75k-100k, 4.2% for AGIs $100k-200k, 3.9% for AGIs over 200k)
Taxable individual retirement arrangement distribution: $15,524 (reported on 4.6% of returns)
90034:
$15,524
California:
$19,557
(% of AGI for various income ranges: 1.3% for AGIs below $25k, 0.9% for AGIs $25k-50k, 1.0% for AGIs $50k-75k, 1.5% for AGIs $75k-100k, 1.5% for AGIs $100k-200k, 1.2% for AGIs over 200k)
Self-employment retirement plans: $23,217 (reported on 1.0% of returns)
90034:
$23,217
California:
$24,530
(% of AGI for various income ranges: 0.1% for AGIs $25k-50k, 0.2% for AGIs $75k-100k, 0.4% for AGIs $100k-200k, 1.0% for AGIs over 200k)
Total itemized deductions: $28,507 (23% of AGI, reported on 27.6% of returns)
Here:
$28,507
State:
$34,004
Here:
22.8% of AGI
State:
22.7% of AGI
(% of AGI for various income ranges: 8.2% for AGIs below $25k, 7.3% for AGIs $25k-50k, 9.8% for AGIs $50k-75k, 13.7% for AGIs $75k-100k, 17.3% for AGIs $100k-200k, 18.4% for AGIs over 200k)
Charity contributions: $4,142 (reported on 22.7% of returns)
Here:
$4,142
State:
$4,659
(% of AGI for various income ranges: 0.5% for AGIs below $25k, 0.8% for AGIs $25k-50k, 1.2% for AGIs $50k-75k, 1.6% for AGIs $75k-100k, 1.8% for AGIs $100k-200k, 2.6% for AGIs over 200k)
Taxes paid: $11,912 (reported on 27.5% of returns)
90034:
$11,912
State:
$14,448
(% of AGI for various income ranges: 1.9% for AGIs below $25k, 1.4% for AGIs $25k-50k, 2.7% for AGIs $50k-75k, 5.2% for AGIs $75k-100k, 7.3% for AGIs $100k-200k, 10.1% for AGIs over 200k)
Earned income credit: $1,706 (reported on 14.5% of returns)
Here:
$1,706
State:
$2,286
(% of AGI for various income ranges: 4.2% for AGIs below $25k, 0.5% for AGIs $25k-50k)
Percentage of individuals using paid preparers for their 2012 taxes: 58.4%
Here:
58%
State:
64%
(% for various income ranges: 59.1% for AGIs below $25k, 54.8% for AGIs $25k-50k, 54.3% for AGIs $50k-75k, 60.0% for AGIs $75k-100k, 64.6% for AGIs $100k-200k, 79.0% for AGIs over 200k)
Averages for the 2004 tax year for zip code 90034, filed in 2005:
Average Adjusted Gross Income (AGI) in 2004: $43,638 (Individual Income Tax Returns)
Here:
$43,638
State:
$58,600
Salary/wage: $40,514 (reported on 86.3% of returns)
Here:
$40,514
State:
$49,455
(% of AGI for various income ranges: 175.3% for AGIs below $10k, 83.9% for AGIs $10k-25k, 91.1% for AGIs $25k-50k, 88.7% for AGIs $50k-75k, 83.4% for AGIs $75k-100k, 63.2% for AGIs over 100k)
Taxable interest for individuals: $1,513 (reported on 37.7% of returns)
This zip code:
$1,513
California:
$2,365
(% of AGI for various income ranges: 9.1% for AGIs below $10k, 1.5% for AGIs $10k-25k, 0.8% for AGIs $25k-50k, 0.9% for AGIs $50k-75k, 1.4% for AGIs $75k-100k, 1.6% for AGIs over 100k)
Taxable dividends: $2,537 (reported on 18.1% of returns)
Here:
$2,537
State:
$4,746
(% of AGI for various income ranges: 7.4% for AGIs below $10k, 0.8% for AGIs $10k-25k, 0.6% for AGIs $25k-50k, 0.8% for AGIs $50k-75k, 1.0% for AGIs $75k-100k, 1.5% for AGIs over 100k)
Net capital gain/loss: +$9,521 (reported on 15.9% of returns)
Here:
+$9,521
State:
+$23,418
(% of AGI for various income ranges: -4.9% for AGIs below $10k, -0.5% for AGIs $10k-25k, 0.1% for AGIs $25k-50k, 0.3% for AGIs $50k-75k, 1.2% for AGIs $75k-100k, 9.6% for AGIs over 100k)
Profit/loss from business: +$10,188 (reported on 21.1% of returns)
Here:
+$10,188
State:
+$16,826
(% of AGI for various income ranges: 26.1% for AGIs below $10k, 9.0% for AGIs $10k-25k, 3.3% for AGIs $25k-50k, 3.2% for AGIs $50k-75k, 4.1% for AGIs $75k-100k, 5.4% for AGIs over 100k)
IRA payment deduction: $2,802 (reported on 3.2% of returns)
90034:
$2,802
California:
$3,192
(% of AGI for various income ranges: 0.6% for AGIs below $10k, 0.2% for AGIs $10k-25k, 0.2% for AGIs $25k-50k, 0.2% for AGIs $50k-75k, 0.2% for AGIs $75k-100k, 0.1% for AGIs over 100k)
Self-employed pension: $16,636 (reported on 1.2% of returns)
Here:
$16,636
California:
$17,688
(% of AGI for various income ranges: 0.1% for AGIs $10k-25k, 0.1% for AGIs $25k-50k, 0.1% for AGIs $50k-75k, 0.3% for AGIs $75k-100k, 1.1% for AGIs over 100k)
Total itemized deductions: $22,061 (25% of AGI, reported on 28.3% of returns)
Here:
$22,061
State:
$28,113
Here:
24.9% of AGI
State:
25.3% of AGI
(% of AGI for various income ranges: 25.2% for AGIs below $10k, 7.4% for AGIs $10k-25k, 10.3% for AGIs $25k-50k, 13.8% for AGIs $50k-75k, 17.7% for AGIs $75k-100k, 18.0% for AGIs over 100k)
Charity contributions deductions: $3,413 (4% of AGI, reported on 24.1% of returns)
Here:
$3,413
State:
$3,923
Here:
3.6% of AGI
State:
3.3% of AGI
(% of AGI for various income ranges: 1.0% for AGIs below $10k, 0.7% for AGIs $10k-25k, 1.3% for AGIs $25k-50k, 1.8% for AGIs $50k-75k, 2.3% for AGIs $75k-100k, 2.6% for AGIs over 100k)
Total tax: $7,085 (reported on 78.7% of returns)
90034:
$7,085
State:
$10,761
(% of AGI for various income ranges: 9.0% for AGIs below $10k, 5.1% for AGIs $10k-25k, 8.2% for AGIs $25k-50k, 11.4% for AGIs $50k-75k, 12.3% for AGIs $75k-100k, 19.3% for AGIs over 100k)
Earned income credit: $1,420 (reported on 14.5% of returns)
Here:
$1,420
State:
$1,763
Percentage of individuals using paid preparers for their 2004 taxes: 60.4%
Here:
60%
State:
66%
(% for various income ranges: 56.0% for AGIs below $10k, 60.7% for AGIs $10k-25k, 58.1% for AGIs $25k-50k, 60.1% for AGIs $50k-75k, 66.1% for AGIs $75k-100k, 74.8% for AGIs over 100k)
Likely homosexual households (counted as self-reported same-sex unmarried-partner households)
Lesbian couples: 0.3% of all households
Gay men: 0.3% of all households
Household received Food Stamps/SNAP in the past 12 months: 1,905 Household did not receive Food Stamps/SNAP in the past 12 months: 23,508
Women who had a birth in the past 12 months: 388 (255 now married, 133 unmarried) Women who did not have a birth in the past 12 months: 16,202 (4,966 now married, 11,296 unmarried)
Housing units in zip code 90034 with a mortgage: 3,252 (416 second mortgage, 71 home equity loan, 362 both second mortgage and home equity loan) Median monthly owner costs for units with a mortgage: $3,711 Median monthly owner costs for units without a mortgage: $811
Residents with income below the poverty level in 2022:
This zip code:
9.0%
Whole state:
12.2%
Residents with income below 50% of the poverty level in 2022:
This zip code:
4.5%
Whole state:
6.2%
Median number of rooms in houses and condos:
Here:
5.6
State:
6.0
Median number of rooms in apartments:
Here:
3.1
State:
3.9
Notable locations in this zip code not listed on our city pages
Churches in zip code 90034 include: Saint Marys Episcopal Church (A), First Lutheran Church (B), Congregation Adat Shalom (C). Display/hide their locations on the map
5,492 married couples with children.
1,054 single-parent households (238 men, 816 women).
55.6% of residents of 90034 zip code speak English at home.
21.4% of residents speak Spanish at home (66% very well, 19% well, 11% not well, 4% not at all).
9.1% of residents speak other Indo-European language at home (81% very well, 11% well, 6% not well, 1% not at all).
11.4% of residents speak Asian or Pacific Island language at home (68% very well, 23% well, 9% not well, 1% not at all).
2.4% of residents speak other language at home (76% very well, 18% well, 6% not well, 1% not at all).
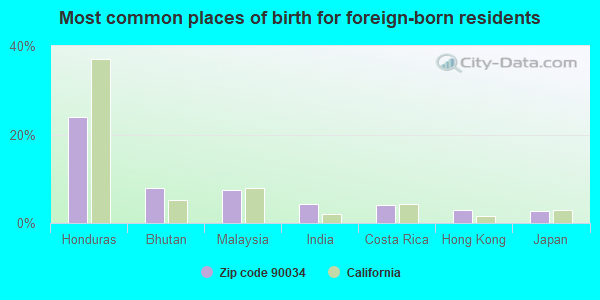
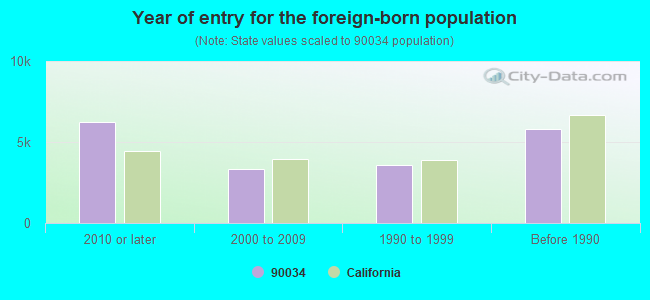
Foreign born population: 17,503 (32.1%) (52.6% of them are naturalized citizens)
Major facilities with environmental interests located in this zip code:
CHEVRON STATION NO 90561 (3775 SOUTH SEPULEVDA BOULEVARD in LOS ANGELES, CA)
STATE MASTER (California - Hazardous Waste Tracking) - HAZARDOU WASTE PROGRAM (Integrated Compliance Information System) - ICIS-09-2000-0043, FORMAL ENFORCEMENT ACTION, ICIS-09-2001-0025, Small Quantity Generators, between 100 kg and 1000 kg of hazardous waste/month (Resource Conservation and Recovery Act (tracking hazardous waste)) - notification Business SIC classification: GASOLINE SERVICE STATIONS Organizations: CHEVRON PRODUCTS CO (CONTACT/OWNER)
Alternative names: CHEVRON SERVICE STATION 9-0561
ABBOTT ELECTRONICS INCORPORATED (2727 SOUTH LA CIENEGA BOULEVARD in LOS ANGELES, CA)
(Integrated Compliance Information System) - ICIS-09-1998-0066, FORMAL ENFORCEMENT ACTION COMPLIANCE ACTIVITY (Tracking inspections of insecticide, fungicide, and rodenticide, and toxic substances) CRITERIA AND HAZARDOUS AIR POLLUTANT INVENTORY (Inventory of air pollution sources) Small Quantity Generators, between 100 kg and 1000 kg of hazardous waste/month (Resource Conservation and Recovery Act (tracking hazardous waste)) TRI REPORTER (Tracking of toxic chemicals releasing facilities) Business SIC classification: ELECTRONIC COMPONENTS Organizations: JOHN T BATTE (CONTACT/OWNER)
Alternative names: ABBOTT TRANSISTOR LABS INC
CELEBRITY CLEANERS (2370 S ROBERTSON in LOS ANGELES, CA)
STATE MASTER (California - Hazardous Waste Tracking) - HAZARDOU WASTE PROGRAM Small Quantity Generators, between 100 kg and 1000 kg of hazardous waste/month (Resource Conservation and Recovery Act (tracking hazardous waste)) - notification Organizations: HWANG JIMMY H (CONTACT/OWNER)
CHEVIOT PALMS CLEANERS (3371 MOTOR AVE in LOS ANGELES, CA)
STATE MASTER (California - Hazardous Waste Tracking) - HAZARDOU WASTE PROGRAM Small Quantity Generators, between 100 kg and 1000 kg of hazardous waste/month (Resource Conservation and Recovery Act (tracking hazardous waste)) - notification Organizations: YOUNG MOON DEE (CONTACT/OWNER)
LA USD CASTLE HTS ELEM (9755 CATTARAUGUS AVE in LOS ANGELES, CA)
STATE MASTER (California - Hazardous Waste Tracking) - HAZARDOU WASTE PROGRAM Small Quantity Generators, between 100 kg and 1000 kg of hazardous waste/month (Resource Conservation and Recovery Act (tracking hazardous waste)) - notification Alternative names: CASTLE HEIGHTS ELEMENTARY, LAUSD/ CASTLE HEIGHT ELEM
APARTMENT HOUSE (10121 TABOR ST in LOS ANGELES, CA)
Large Quantity Generators, more that 1000 kg of hazardous waste/month (Resource Conservation and Recovery Act (tracking hazardous waste)) Large Quantity Generators, more that 1000 kg of hazardous waste/month (Resource Conservation and Recovery Act (tracking hazardous waste)) Organizations: HMH ASCIATES, INC. (CONTACT/OPERATOR)
, HMH ASSOCIATES, INC (CONTACT/OPERATOR)
, HORLICK PROPERTIES, LTD (CONTACT/OWNER)
LA USD WESTSIDE ALTERNATIVE (2985 S ROBERTSON BLVD in LOS ANGELES, CA)
STATE MASTER (California - Hazardous Waste Tracking) - HAZARDOU WASTE PROGRAM Small Quantity Generators, between 100 kg and 1000 kg of hazardous waste/month (Resource Conservation and Recovery Act (tracking hazardous waste)) - notification Alternative names: LAUSD/ WESTSIDE ALTERNATIVE
LOS ANGELES FIRE STATION 43 (10234 NATIONAL BLVD in LOS ANGELES, CA)
STATE MASTER (California - Hazardous Waste Tracking) - HAZARDOU WASTE PROGRAM Small Quantity Generators, between 100 kg and 1000 kg of hazardous waste/month (Resource Conservation and Recovery Act (tracking hazardous waste)) - notification Organizations: CITY OF LA (CONTACT/OWNER)
Alternative names: CITY OF LA GENERAL SERVICES, LA FIRE STATION 43
CHEVRON STATION NO 93691 (2065 S LA CIENEGA BLVD in LOS ANGELES, CA)
STATE MASTER (California - Hazardous Waste Tracking) - HAZARDOU WASTE PROGRAM Small Quantity Generators, between 100 kg and 1000 kg of hazardous waste/month (Resource Conservation and Recovery Act (tracking hazardous waste)) - notification Organizations: CHEVRON PRODUCTS CO (CONTACT/OWNER)
CHEVRON STATION 92324 (3029 S ROBERTSON BLVD in LOS ANGELES, CA)
STATE MASTER (California - Hazardous Waste Tracking) - HAZARDOU WASTE PROGRAM Small Quantity Generators, between 100 kg and 1000 kg of hazardous waste/month (Resource Conservation and Recovery Act (tracking hazardous waste)) - notification Organizations: CHEVRON PRODUCTS CO (CONTACT/OWNER)
CHEVIOT HILLS CONTINUATION (9200 CATTARAUGUS AVE. in LOS ANGELES, CA)
(National Center for Education Statistics) - STATE ID-1931336 Organizations: LOS ANGELES UNIFIED (SCHOOL DISTRICT)
CHARNOCK ROAD ELEMENTARY (11133 CHARNOCK ROAD in LOS ANGELES, CA)
(National Center for Education Statistics) - STATE ID-6016448 Organizations: LOS ANGELES UNIFIED (SCHOOL DISTRICT)
HAMILTON (ALEXANDER) SENIOR HI (2955 ROBERTSON BLVD. in LOS ANGELES, CA)
(National Center for Education Statistics) - STATE ID-1933852 Organizations: LOS ANGELES UNIFIED (SCHOOL DISTRICT)
Housing units lacking complete plumbing facilities: 0.3% Housing units lacking complete kitchen facilities: 2.1%
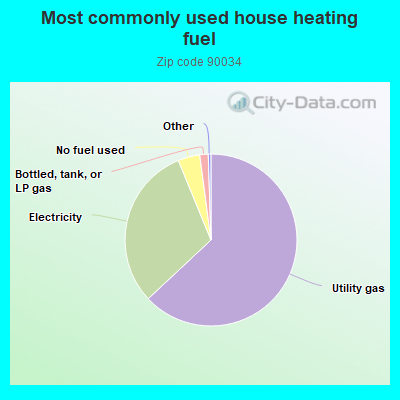
63.1%Utility gas
30.8%Electricity
4.1%No fuel used
1.6%Bottled, tank, or LP gas
Population in 1990: 53,930. Population change in the 1990s: +4,269 (+7.9%).
Place of birth for U.S.-born residents:
This state: 22,127
Northeast: 4,548
Midwest: 3,556
South: 3,670
West: 1,946
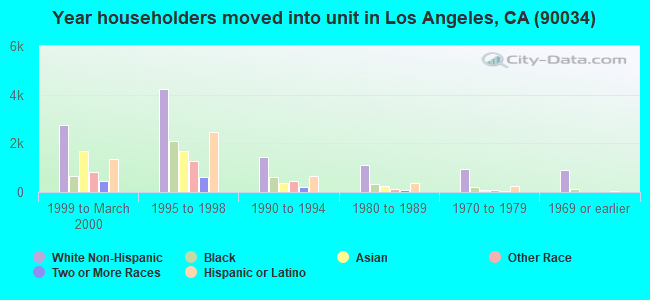
43% of the 90034 zip code residents lived in the same house 5 years ago. Out of people who lived in different houses, 77% lived in this county. Out of people who lived in different counties, 50% lived in California.
87% of the 90034 zip code residents lived in the same house 1 year ago. Out of people who lived in different houses, 62% moved from this county. Out of people who lived in different houses, 7% moved from different county within same state. Out of people who lived in different houses, 21% moved from different state. Out of people who lived in different houses, 10% moved from abroad.
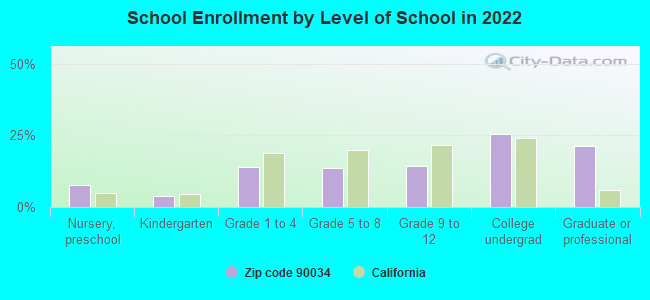
Private vs. public school enrollment:
Students in private schools in grades 1 to 8 (elementary and middle school): 791
Here:
25.9%
California:
10.5%
Students in private schools in grades 9 to 12 (high school): 268
Here:
17.2%
California:
8.5%
Students in private undergraduate colleges: 438
Here:
15.8%
California:
15.9%
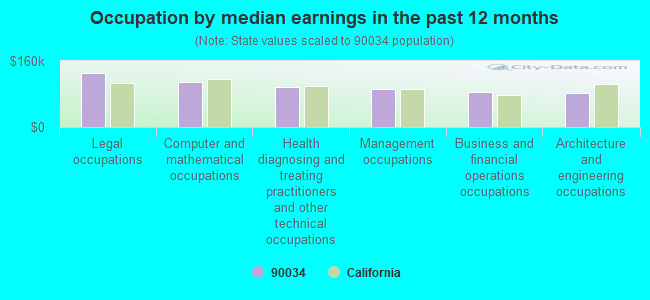
Occupation by median earnings in the past 12 months ($)
131,748Legal occupations
109,949Computer and mathematical occupations
96,632Health diagnosing and treating practitioners and other technical occupations
92,104Management occupations
84,223Business and financial operations occupations
82,759Architecture and engineering occupations
Companies with federal contracts located in this zip code (LOS ANGELES, CA):
MARTEK POWER ABBOTT INC (2727 S LA CIENEGA BLVD; small business) : $2,360,771 in 81 contractsfrom 1999 to 2006
Contracts for Electronic Modules, Guided Missile Remote Control Systems, Electrical Hardware and Supplies, Converters, Electrical, Nonrotating, and moreby Air Force, Defense Logistics Agency, Navy, Army, and others Signed by year:2000: $423,900; 2001: $254,323; 2002: $495,312; 2003: $355,904; 2004: $172,934; 2005: $545,586; 2006: $44,112.
Biggest contracts:
$137,788 with Air Force for Electronic Modules. Signed on 2000-04-04. Completion date: 2000-07-31.
$98,944 with Defense Logistics Agency for Guided Missile Remote Control Systems. Signed on 2003-12-04. Completion date: 2004-03-27.
$98,944, same as above.Signed on 2003-12-04. Completion date: 2004-03-27.
$95,585 with Navy for Electrical Hardware and Supplies. Signed on 2005-09-01. Completion date: 2005-12-21.
THE JASEC GROUP (3679 MOTOR AVE 303; small business) : $1,208,617 in 4 contractsfrom 1999 to 2001
$1,011,523 with Air Force for Maintenance, Repair or Alteration of Real Property -- Family Housing Facilities. Taking place in AZ. Signed on 1999-10-08. Completion date: 2000-09-30.
$84,062 with Air Force for Facilities Operations Support Services. Taking place in AZ. Signed on 2001-01-31. Completion date: 2000-11-30.
$76,407, same as above.Signed on 2001-01-31. Completion date: 2000-10-31.
$36,625 with Air Force for Maintenance, Repair or Alteration of Real Property -- Family Housing Facilities. Taking place in AZ. Signed on 1999-11-29. Completion date: 2000-09-30.
MCMILLAN SCIENCE ASSOCIATES IN (3736 TULLER AVENUE; small business) : $179,850 in 2 contractsfrom 1999 to 2000
$99,194 with Department of Defense for Other Defense -- Advanced Development (R&D). Signed on 1999-11-22. Completion date: 2000-07-22.
$80,656, same as above.Signed on 2000-06-19. Completion date: 2001-01-19.
AFP INTERNATIONAL, LLC (10131 NATIONAL BLVD; small business) : $151,195 in 4 contractsfrom 2002 to 2003
$64,343 with Army for Recreational and Gymnastic Equipment. Signed on 2002-09-27. Completion date: 2002-10-31.
$47,316 with Army for Recreational and Gymnastic Equipment. Taking place in NV. Signed on 2002-08-20. Completion date: 2002-11-15.
$34,889 with Army for Recreational and Gymnastic Equipment. Signed on 2002-09-23. Completion date: 2002-10-30.
$4,647, same as above.Signed on 2003-02-07. Completion date: 2003-03-06.
ONSITE STORAGE SOLUTIONS (3637 GLENDON AVE STE 101; small business) : $147,785 in 14 contractsfrom 2004 to 2006
Contracts for Miscellaneous Items, Prefabricated and Portable Buildings, Specialized Shipping and Storage Containers, Lease or Rental of Equipment -- Prefabricated Structures and Scaffolding, and moreby Navy, Army Signed by year:2000: $0; 2001: $0; 2002: $0; 2003: $0; 2004: $18,530; 2005: $114,455; 2006: $14,800.
Biggest contracts:
$21,160 with Navy for Miscellaneous Items. Signed on 2005-09-29. Completion date: 2005-11-30.
$17,600 with Army for Prefabricated and Portable Buildings. Signed on 2005-09-12. Completion date: 2005-10-07.
$15,000 with Army for Specialized Shipping and Storage Containers. Taking place in MO. Signed on 2005-04-14. Completion date: 2005-04-28.
$13,900 with Army for Specialized Shipping and Storage Containers. Signed on 2006-03-31. Completion date: 2006-04-28.
DV411 (3767 OVERLAND AVE STE 103; small business) : $114,451 in 7 contractsfrom 2000 to 2005
Contracts for ADP Central Processing Unit (CPU, Computer), Analog, ADP Components, Photographic Equipment and Accessories, ADP Support Equipment, and moreby Department of Defense, Army, Air Force Signed by year:2000: $32,655; 2001: -$100; 2002: $0; 2003: $39,853; 2004: $3,100; 2005: $38,943; 2006: $0.
Biggest contracts:
$39,853 with Department of Defense for ADP Central Processing Unit (CPU, Computer), Analog. Signed on 2003-09-11. Completion date: 2003-09-26.
$32,655 with Army for ADP Components. Signed on 2000-08-16. Completion date: 2000-09-28.
$22,622 with Air Force for Photographic Equipment and Accessories. Signed on 2005-08-17. Completion date: 2005-09-14.
$16,321 with Air Force for ADP Support Equipment. Signed on 2005-07-11. Completion date: 2005-08-12.
CHELSEA DESIGN GROUP, INC (3415 S SEPULVEDA BLVD STE; small business) : $100,000 in 4 contractsfrom 2000 to 2004
$60,000 with Public Buildings Service for Other Architect and Engineering Services. Signed on 2000-08-15. Completion date: 2001-01-15.
$20,000 with U.S. Army Corps of Engineers - civil program financing only for Other Professional Services. Signed on 2002-02-21. Completion date: 2002-05-16.
$10,000 with Army for Other Professional Services. Signed on 2004-10-26. Completion date: 2002-05-16.
$10,000 with U.S. Army Corps of Engineers - civil program financing only for Other Professional Services. Signed on 2004-10-26. Completion date: 2002-05-16.
INTEGRATED PROJECT MANAGMENT I (10008 NATIONAL BLVD STE 22; small business)
$70,000 with Army for Defense Missile and Space Systems -- Advanced Development (R&D). Signed on 2003-07-22. Completion date: 2004-01-22.
TELE NET, INC (3384 MOTOR AVE; small business) : $54,841 in 3 contractsin 2003
$28,519 with Air Force for ADP Software. Taking place in OH. Signed on 2003-08-06. Completion date: 2004-09-03.
$19,897 with Navy for ADP Supplies. Signed on 2003-04-02. Completion date: 2003-04-02.
$6,425 with Army for ADP Central Processing Unit (CPU, Computer), Analog. Taking place in VA. Signed on 2003-05-20. Completion date: 2003-06-19.
CREATIVE PRODUCERS INC (8919 WEST 24TH STREET; small business)
$4,579 with Army for Lectures For Training. Signed on 2002-03-05. Completion date: 2002-03-08.
Top industries in this zip code by the number of employees in 2005:
Health Care and Social Assistance: Offices of Physicians (except Mental Health Specialists) (over 1000 employees: 1 establishment, 20-49 employees: 2 establishments, 5-9 employees: 2 establishments, 1-4 employees: 8 establishments)
Health Care and Social Assistance: General Medical and Surgical Hospitals (over 1000: 1)
Administrative and Support and Waste Management and Remediation Services: Security Guards and Patrol Services (500-999: 1, 20-49: 1, 5-9: 1, 1-4: 1)
2005 - 2018 National Fire Incident Reporting System (NFIRS) incidents
According to the data from the years 2005 - 2018 the average number of fires per year is 88. The highest number of fire incidents - 118 took place in 2006, and the least - 55 in 2012. The data has a decreasing trend.
When looking into fire subcategories, the most incidents belonged to: Structure Fires (57.7%), and Outside Fires (19.5%).
Fire incident types reported to NFIRS in Zip Code 90034


 Nearest zip codes: 90232, 90064, 90035, 90067, 90212, 90230.


 According to the data from the years 2005 - 2018 the average number of fires per year is 88. The highest number of fire incidents - 118 took place in 2006, and the least - 55 in 2012. The data has a decreasing trend.
 When looking into fire subcategories, the most incidents belonged to: Structure Fires (57.7%), and Outside Fires (19.5%).