Estimated zip code population in 2022: 31,739 Zip code population in 2010: 31,766 Zip code population in 2000: 31,945
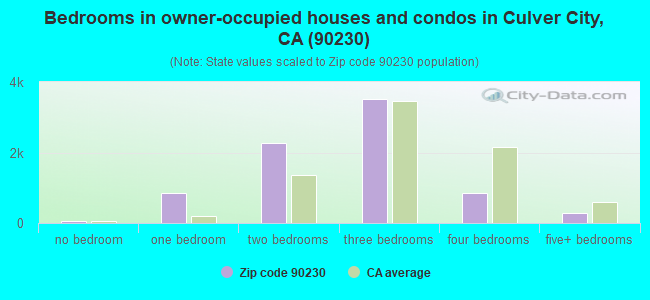
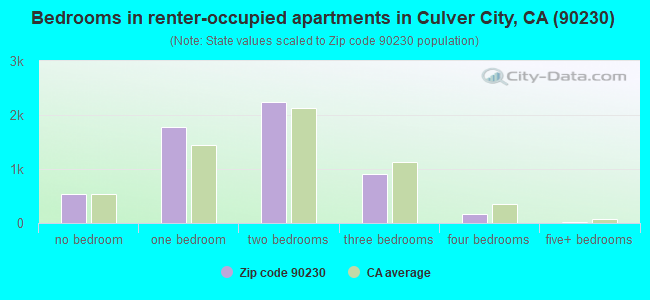
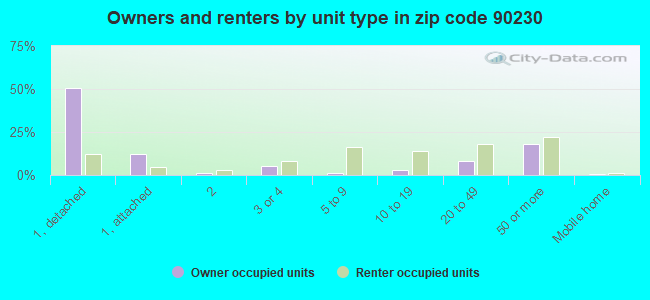
Houses and condos: 14,348 Renter-occupied apartments: 5,676
% of renters here:
42%
State:
44%
March 2022 cost of living index in zip code 90230: 138.1 (high, U.S. average is 100)
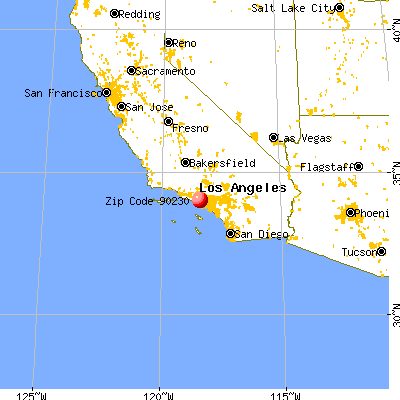
Land area: 4.5 sq. mi. Water area: 0.0 sq. mi.
Population density: 7,040 people per square mile
(high).
OSM Map
General Map
Google Map
MSN Map
OSM Map
General Map
Google Map
MSN Map
OSM Map
General Map
Google Map
MSN Map
OSM Map
General Map
Google Map
MSN Map
Please wait while loading the map...
Real estate property taxes paid for housing units in 2022:
This zip code:
0.6% ($6,403)
California:
0.7% ($4,831)
Median real estate property taxes paid for housing units with mortgages in 2022: $7,049 (0.6%) Median real estate property taxes paid for housing units with no mortgage in 2022: $5,295 (0.5%)
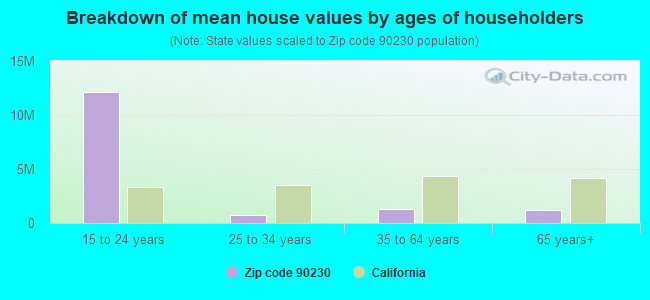
Estimated median house/condo value in 2022: $1,069,127
90230:
$1,069,127
California:
$715,900
According to our research of California and other state lists, there were 17 registered sex offenders living in 90230 zip code as of April 27, 2024. The ratio of all residents to sex offenders in zip code 90230 is 1,951 to 1. The ratio of registered sex offenders to all residents in this zip code is much lower than the state average.
Median resident age:
This zip code:
41.5 years
California median age:
37.9 years
Average household size:
This zip code:
2.3 people
California:
2.8 people
Averages for the 2020 tax year for zip code 90230, filed in 2021:
Average Adjusted Gross Income (AGI) in 2020: $112,598 (Individual Income Tax Returns)
Here:
$112,598
State:
$95,910
Salary/wage: $100,821 (reported on 77.0% of returns)
Here:
$100,821
State:
$77,331
(% of AGI for various income ranges: 1067.4% for AGIs below $25k, 3870.7% for AGIs $25k-50k, 7155.8% for AGIs $50k-75k, 11216.3% for AGIs $75k-100k, 21138.2% for AGIs $100k-200k, 104012.9% for AGIs over 200k)
Taxable interest for individuals: $2,881 (reported on 44.7% of returns)
This zip code:
$2,881
California:
$2,294
(% of AGI for various income ranges: 36.7% for AGIs below $25k, 47.2% for AGIs $25k-50k, 86.6% for AGIs $50k-75k, 106.7% for AGIs $75k-100k, 190.8% for AGIs $100k-200k, 2326.1% for AGIs over 200k)
Ordinary dividends: $6,941 (reported on 31.6% of returns)
Here:
$6,941
State:
$10,949
(% of AGI for various income ranges: 48.1% for AGIs below $25k, 80.6% for AGIs $25k-50k, 156.3% for AGIs $50k-75k, 216.2% for AGIs $75k-100k, 405.2% for AGIs $100k-200k, 3729.2% for AGIs over 200k)
Net capital gain/loss in AGI: +$23,462 (reported on 29.5% of returns)
Here:
+$23,462
State:
+$49,306
(% of AGI for various income ranges: 24.6% for AGIs below $25k, 74.0% for AGIs $25k-50k, 133.5% for AGIs $50k-75k, 234.0% for AGIs $75k-100k, 700.6% for AGIs $100k-200k, 15936.9% for AGIs over 200k)
Profit/loss from business: +$14,315 (reported on 25.3% of returns)
Here:
+$14,315
State:
+$15,671
(% of AGI for various income ranges: 320.2% for AGIs below $25k, 358.4% for AGIs $25k-50k, 385.8% for AGIs $50k-75k, 499.1% for AGIs $75k-100k, 955.5% for AGIs $100k-200k, 3200.3% for AGIs over 200k)
Taxable individual retirement arrangement distribution: $20,172 (reported on 8.9% of returns)
90230:
$20,172
California:
$23,505
(% of AGI for various income ranges: 68.6% for AGIs below $25k, 133.3% for AGIs $25k-50k, 251.6% for AGIs $50k-75k, 364.8% for AGIs $75k-100k, 639.1% for AGIs $100k-200k, 1341.2% for AGIs over 200k)
Self-employed (Keogh) retirement plans: $24,092 (reported on 1.6% of returns)
90230:
$24,092
California:
$30,163
(% of AGI for various income ranges: 5.6% for AGIs below $25k, 25.6% for AGIs $50k-75k, 71.5% for AGIs $100k-200k, 750.8% for AGIs over 200k)
Total itemized deductions: $33,749 (reported on 22.0% of returns)
Here:
$33,749
State:
$39,517
(% of AGI for various income ranges: 153.3% for AGIs below $25k, 359.6% for AGIs $25k-50k, 686.8% for AGIs $50k-75k, 1250.6% for AGIs $75k-100k, 2247.3% for AGIs $100k-200k, 8908.6% for AGIs over 200k)
Charity contributions: $6,378 (reported on 19.0% of returns)
Here:
$6,378
State:
$12,598
(% of AGI for various income ranges: 7.7% for AGIs below $25k, 36.3% for AGIs $25k-50k, 81.4% for AGIs $50k-75k, 161.1% for AGIs $75k-100k, 355.3% for AGIs $100k-200k, 1753.7% for AGIs over 200k)
Taxes paid: $8,912 (reported on 22.0% of returns)
90230:
$8,912
State:
$8,807
(% of AGI for various income ranges: 32.9% for AGIs below $25k, 84.7% for AGIs $25k-50k, 180.8% for AGIs $50k-75k, 387.4% for AGIs $75k-100k, 698.6% for AGIs $100k-200k, 2044.9% for AGIs over 200k)
Earned income credit: $1,876 (reported on 10.0% of returns)
Here:
$1,876
State:
$2,074
(% of AGI for various income ranges: 88.0% for AGIs below $25k, 50.5% for AGIs $25k-50k)
Percentage of individuals using paid preparers for their 2020 taxes: 92.0%
Here:
92%
State:
92%
(% for various income ranges: 89.3% for AGIs below $25k, 92.2% for AGIs $25k-50k, 93.0% for AGIs $50k-75k, 91.7% for AGIs $75k-100k, 92.7% for AGIs $100k-200k, 95.1% for AGIs over 200k)
Averages for the 2012 tax year for zip code 90230, filed in 2013:
Average Adjusted Gross Income (AGI) in 2012: $73,087 (Individual Income Tax Returns)
Here:
$73,087
State:
$72,726
Salary/wage: $66,128 (reported on 79.4% of returns)
Here:
$66,128
State:
$59,079
(% of AGI for various income ranges: 64.7% for AGIs below $25k, 76.8% for AGIs $25k-50k, 76.4% for AGIs $50k-75k, 75.7% for AGIs $75k-100k, 78.4% for AGIs $100k-200k, 59.9% for AGIs over 200k)
Taxable interest for individuals: $1,570 (reported on 44.8% of returns)
This zip code:
$1,570
California:
$2,146
(% of AGI for various income ranges: 1.8% for AGIs below $25k, 0.8% for AGIs $25k-50k, 0.8% for AGIs $50k-75k, 0.7% for AGIs $75k-100k, 0.8% for AGIs $100k-200k, 1.3% for AGIs over 200k)
Ordinary dividends: $4,537 (reported on 26.0% of returns)
Here:
$4,537
State:
$9,308
(% of AGI for various income ranges: 2.4% for AGIs below $25k, 1.3% for AGIs $25k-50k, 1.4% for AGIs $50k-75k, 1.4% for AGIs $75k-100k, 1.3% for AGIs $100k-200k, 2.1% for AGIs over 200k)
Net capital gain/loss in AGI: +$5,830 (reported on 21.9% of returns)
Here:
+$5,830
State:
+$30,460
(% of AGI for various income ranges: 0.2% for AGIs $25k-50k, 0.3% for AGIs $50k-75k, 0.6% for AGIs $75k-100k, 0.8% for AGIs $100k-200k, 4.9% for AGIs over 200k)
Profit/loss from business: +$15,029 (reported on 24.3% of returns)
Here:
+$15,029
State:
+$17,064
(% of AGI for various income ranges: 17.9% for AGIs below $25k, 7.1% for AGIs $25k-50k, 4.1% for AGIs $50k-75k, 3.7% for AGIs $75k-100k, 4.2% for AGIs $100k-200k, 3.7% for AGIs over 200k)
Taxable individual retirement arrangement distribution: $14,319 (reported on 10.5% of returns)
90230:
$14,319
California:
$19,557
(% of AGI for various income ranges: 3.5% for AGIs below $25k, 2.5% for AGIs $25k-50k, 2.6% for AGIs $50k-75k, 2.5% for AGIs $75k-100k, 2.2% for AGIs $100k-200k, 1.0% for AGIs over 200k)
Self-employment retirement plans: $17,426 (reported on 1.5% of returns)
90230:
$17,426
California:
$24,530
(% of AGI for various income ranges: 0.2% for AGIs $25k-50k, 0.2% for AGIs $50k-75k, 0.1% for AGIs $75k-100k, 0.3% for AGIs $100k-200k, 0.7% for AGIs over 200k)
Total itemized deductions: $28,845 (24% of AGI, reported on 45.2% of returns)
Here:
$28,845
State:
$34,004
Here:
23.9% of AGI
State:
22.7% of AGI
(% of AGI for various income ranges: 14.9% for AGIs below $25k, 14.2% for AGIs $25k-50k, 18.4% for AGIs $50k-75k, 19.0% for AGIs $75k-100k, 19.4% for AGIs $100k-200k, 17.2% for AGIs over 200k)
Charity contributions: $3,132 (reported on 38.6% of returns)
Here:
$3,132
State:
$4,659
(% of AGI for various income ranges: 1.0% for AGIs below $25k, 1.3% for AGIs $25k-50k, 1.7% for AGIs $50k-75k, 1.9% for AGIs $75k-100k, 1.9% for AGIs $100k-200k, 1.5% for AGIs over 200k)
Taxes paid: $11,547 (reported on 45.2% of returns)
90230:
$11,547
State:
$14,448
(% of AGI for various income ranges: 2.8% for AGIs below $25k, 3.3% for AGIs $25k-50k, 5.2% for AGIs $50k-75k, 6.5% for AGIs $75k-100k, 7.9% for AGIs $100k-200k, 9.7% for AGIs over 200k)
Earned income credit: $2,054 (reported on 12.8% of returns)
Here:
$2,054
State:
$2,286
(% of AGI for various income ranges: 5.6% for AGIs below $25k, 0.7% for AGIs $25k-50k)
Percentage of individuals using paid preparers for their 2012 taxes: 65.0%
Here:
65%
State:
64%
(% for various income ranges: 62.6% for AGIs below $25k, 62.7% for AGIs $25k-50k, 64.3% for AGIs $50k-75k, 65.5% for AGIs $75k-100k, 69.0% for AGIs $100k-200k, 76.5% for AGIs over 200k)
Averages for the 2004 tax year for zip code 90230, filed in 2005:
Average Adjusted Gross Income (AGI) in 2004: $55,188 (Individual Income Tax Returns)
Here:
$55,188
State:
$58,600
Salary/wage: $51,874 (reported on 79.7% of returns)
Here:
$51,874
State:
$49,455
(% of AGI for various income ranges: 137.8% for AGIs below $10k, 67.9% for AGIs $10k-25k, 79.3% for AGIs $25k-50k, 80.8% for AGIs $50k-75k, 82.0% for AGIs $75k-100k, 68.6% for AGIs over 100k)
Taxable interest for individuals: $1,905 (reported on 54.6% of returns)
This zip code:
$1,905
California:
$2,365
(% of AGI for various income ranges: 12.1% for AGIs below $10k, 3.1% for AGIs $10k-25k, 1.6% for AGIs $25k-50k, 1.5% for AGIs $50k-75k, 1.3% for AGIs $75k-100k, 2.0% for AGIs over 100k)
Taxable dividends: $2,469 (reported on 28.6% of returns)
Here:
$2,469
State:
$4,746
(% of AGI for various income ranges: 9.6% for AGIs below $10k, 1.6% for AGIs $10k-25k, 1.1% for AGIs $25k-50k, 1.0% for AGIs $50k-75k, 0.9% for AGIs $75k-100k, 1.4% for AGIs over 100k)
Net capital gain/loss: +$9,891 (reported on 24.0% of returns)
Here:
+$9,891
State:
+$23,418
(% of AGI for various income ranges: -5.9% for AGIs below $10k, -0.1% for AGIs $10k-25k, -0.1% for AGIs $25k-50k, 0.6% for AGIs $50k-75k, 0.9% for AGIs $75k-100k, 9.4% for AGIs over 100k)
Profit/loss from business: +$13,420 (reported on 23.5% of returns)
Here:
+$13,420
State:
+$16,826
(% of AGI for various income ranges: 31.2% for AGIs below $10k, 13.2% for AGIs $10k-25k, 6.4% for AGIs $25k-50k, 4.4% for AGIs $50k-75k, 4.6% for AGIs $75k-100k, 4.9% for AGIs over 100k)
IRA payment deduction: $3,142 (reported on 4.1% of returns)
90230:
$3,142
California:
$3,192
(% of AGI for various income ranges: 0.7% for AGIs below $10k, 0.3% for AGIs $10k-25k, 0.4% for AGIs $25k-50k, 0.3% for AGIs $50k-75k, 0.2% for AGIs $75k-100k, 0.1% for AGIs over 100k)
Self-employed pension: $12,987 (reported on 2.0% of returns)
Here:
$12,987
California:
$17,688
(% of AGI for various income ranges: 0.3% for AGIs $10k-25k, 0.3% for AGIs $25k-50k, 0.2% for AGIs $50k-75k, 0.3% for AGIs $75k-100k, 0.8% for AGIs over 100k)
Total itemized deductions: $23,496 (27% of AGI, reported on 47.3% of returns)
Here:
$23,496
State:
$28,113
Here:
26.8% of AGI
State:
25.3% of AGI
(% of AGI for various income ranges: 43.3% for AGIs below $10k, 16.2% for AGIs $10k-25k, 18.7% for AGIs $25k-50k, 22.0% for AGIs $50k-75k, 22.4% for AGIs $75k-100k, 19.4% for AGIs over 100k)
Charity contributions deductions: $2,889 (3% of AGI, reported on 43.1% of returns)
Here:
$2,889
State:
$3,923
Here:
3.2% of AGI
State:
3.3% of AGI
(% of AGI for various income ranges: 2.5% for AGIs below $10k, 1.4% for AGIs $10k-25k, 2.1% for AGIs $25k-50k, 2.8% for AGIs $50k-75k, 2.5% for AGIs $75k-100k, 2.2% for AGIs over 100k)
Total tax: $8,670 (reported on 80.9% of returns)
90230:
$8,670
State:
$10,761
(% of AGI for various income ranges: 9.1% for AGIs below $10k, 4.9% for AGIs $10k-25k, 7.6% for AGIs $25k-50k, 10.3% for AGIs $50k-75k, 11.4% for AGIs $75k-100k, 17.2% for AGIs over 100k)
Earned income credit: $1,670 (reported on 11.9% of returns)
Here:
$1,670
State:
$1,763
Percentage of individuals using paid preparers for their 2004 taxes: 67.7%
Here:
68%
State:
66%
(% for various income ranges: 60.4% for AGIs below $10k, 67.9% for AGIs $10k-25k, 67.3% for AGIs $25k-50k, 68.9% for AGIs $50k-75k, 70.4% for AGIs $75k-100k, 72.9% for AGIs over 100k)
Likely homosexual households (counted as self-reported same-sex unmarried-partner households)
Lesbian couples: 0.2% of all households
Gay men: 0.3% of all households
Household received Food Stamps/SNAP in the past 12 months: 1,493 Household did not receive Food Stamps/SNAP in the past 12 months: 11,981
Women who had a birth in the past 12 months: 309 (236 now married, 72 unmarried) Women who did not have a birth in the past 12 months: 7,274 (3,035 now married, 4,233 unmarried)
Housing units in zip code 90230 with a mortgage: 5,611 (526 second mortgage, 498 both second mortgage and home equity loan) Houses without a mortgage: 135
Median monthly owner costs for units with a mortgage: $3,308 Median monthly owner costs for units without a mortgage: $985
Residents with income below the poverty level in 2022:
This zip code:
10.9%
Whole state:
12.2%
Residents with income below 50% of the poverty level in 2022:
This zip code:
6.9%
Whole state:
6.2%
Median number of rooms in houses and condos:
Here:
5.3
State:
6.0
Median number of rooms in apartments:
Here:
3.4
State:
3.9
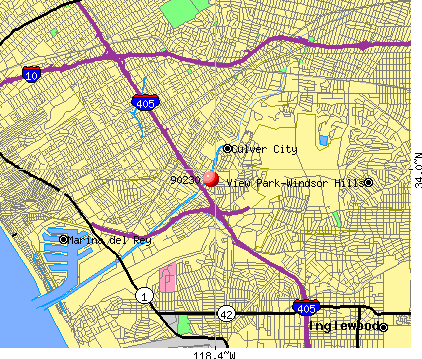
Notable locations in this zip code not listed on our city pages
Notable locations in zip code 90230: Fox Hills Country Club (A), Robert Lee Frost Auditorium (B), Culver City Branch of Los Angeles Public Library (C), Culver City Fire Department Station 3 (D), Culver City Fire Department Station 2 (E). Display/hide their locations on the map
Shopping Centers: Raintree Plaza Shopping Center (1), Fox Hills Plaza Shopping Center (2), Fox Hills Mall Shopping Center (3). Display/hide their locations on the map
Churches in zip code 90230 include: Westside Unity Church (A), Grace Lutheran Church (B), Culver City Presbyterian Church (C). Display/hide their locations on the map
Parks in zip code 90230 include: Coombs Park (1), Lindbergh Park (2), Veterans Memorial Park (3), Blanco Park (4), Culver Slauson Park (5), El Marino Park (6), Fox Hills Park (7), Mar Vista Gardens (8). Display/hide their locations on the map
5,101 married couples with children.
781 single-parent households (96 men, 685 women).
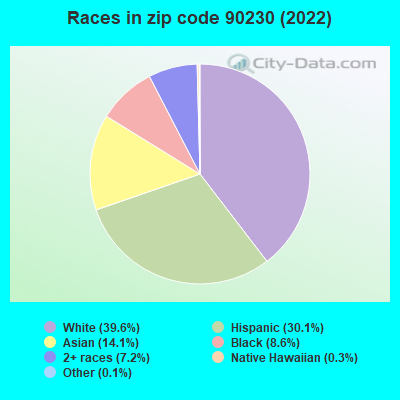
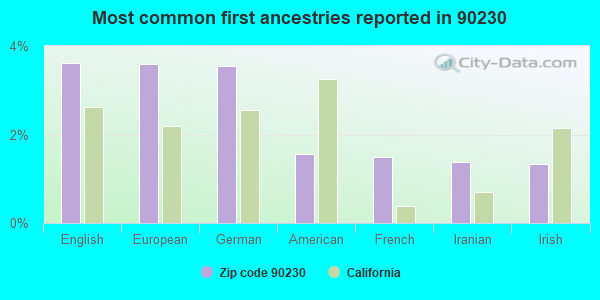
57.3% of residents of 90230 zip code speak English at home.
24.2% of residents speak Spanish at home (80% very well, 9% well, 7% not well, 3% not at all).
7.5% of residents speak other Indo-European language at home (86% very well, 8% well, 4% not well, 3% not at all).
9.1% of residents speak Asian or Pacific Island language at home (71% very well, 21% well, 3% not well, 5% not at all).
2.1% of residents speak other language at home (96% very well, 3% well, 1% not well).
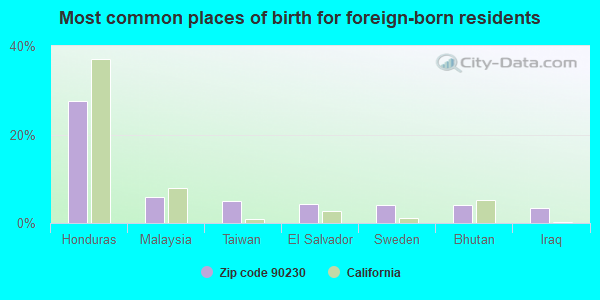
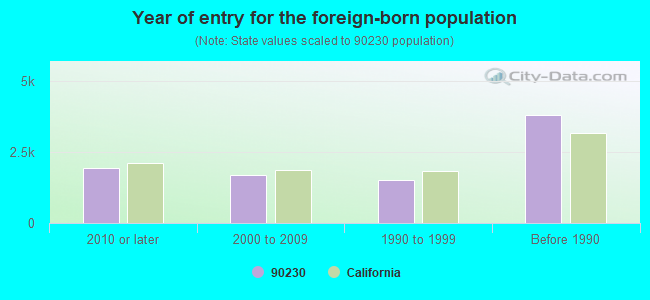
Foreign born population: 8,408 (26.5%) (59.7% of them are naturalized citizens)
Major facilities with environmental interests located in this zip code:
EQUILON ENTERPRISES LLC (3801 SEPULVEDA BLVD in CULVER CITY, CA)
STATE MASTER (California - Hazardous Waste Tracking) - HAZARDOU WASTE PROGRAM (Integrated Compliance Information System) - ICIS-09-1999-0109, FORMAL ENFORCEMENT ACTION National Pollutant Discharge Elimination System NON-MAJOR (Tracking pollutant discharge elimination systems) - permit Large Quantity Generators, more that 1000 kg of hazardous waste/month (Resource Conservation and Recovery Act (tracking hazardous waste)) - notification Business SIC classification: GASOLINE SERVICE STATIONS Organizations: SHELL OIL PRODUCTS US (CONTACT/OPERATOR)
, EQUILON ENTERPRISES LLC DBA SHELL OIL PR (CONTACT/OWNER)
Alternative names: SHELL OIL PRODUCTS US, SHELL SRVC STATION 20419440100, SHELL SERVICE STATION
CHEVRON STATION NO 92894 (11197 WASHINGTON PLACE in CULVER CITY, CA)
STATE MASTER (California - Hazardous Waste Tracking) - HAZARDOU WASTE PROGRAM (Integrated Compliance Information System) - ICIS-09-2000-0043, FORMAL ENFORCEMENT ACTION, ICIS-09-2001-0025, HAZARDOUS WASTE BIENNIAL REPORTER (Resource Conservation and Recovery Act (tracking hazardous waste)) Large Quantity Generators, more that 1000 kg of hazardous waste/month (Resource Conservation and Recovery Act (tracking hazardous waste)) Small Quantity Generators, between 100 kg and 1000 kg of hazardous waste/month (Resource Conservation and Recovery Act (tracking hazardous waste)) - notification Business SIC classification: GASOLINE SERVICE STATIONS Organizations: CHEVRON PRODUCTS CO (CONTACT/OWNER)
Alternative names: CHEVRON NO 92894, CHEVRON SERVICE STATION #9-2894
EXXONMOBIL OIL CORP. (5800 SEPULVEDA in CULVER CITY, CA)
STATE MASTER (California - Hazardous Waste Tracking) - HAZARDOU WASTE PROGRAM (Integrated Compliance Information System) - ICIS-09-2000-0043, FORMAL ENFORCEMENT ACTION, ICIS-09-2001-0025, CRITERIA AND HAZARDOUS AIR POLLUTANT INVENTORY (Inventory of air pollution sources) Small Quantity Generators, between 100 kg and 1000 kg of hazardous waste/month (Resource Conservation and Recovery Act (tracking hazardous waste)) Business SIC classification: CRUDE PETROLEUM PIPELINES; GASOLINE SERVICE STATIONS Business NAICS classification: CRUDE PETROLEUM AND NATURAL GAS EXTRACTION. Alternative names: MOBIL OIL CORP SLAUSON STA
EMPTY LOT (11825 S MAJOR ST in CULVER CITY, CA)
STATE MASTER (California - Hazardous Waste Tracking) - HAZARDOU WASTE PROGRAM Large Quantity Generators, more that 1000 kg of hazardous waste/month (Resource Conservation and Recovery Act (tracking hazardous waste)) Organizations: LARRY PLUMMER (CONTACT/OPERATOR)
, NANCY ROSE (CONTACT/OWNER)
ED LITTLE AUTO SERVICE (4318 SEPULVEDA BLVD in CULVER CITY, CA)
STATE MASTER (California - Hazardous Waste Tracking) - HAZARDOU WASTE PROGRAM Small Quantity Generators, between 100 kg and 1000 kg of hazardous waste/month (Resource Conservation and Recovery Act (tracking hazardous waste)) - notification Business NAICS classification: GENERAL AUTOMOTIVE REPAIR.
LA HSNG AUTH MAR VISTA GARDENS (11965 ALLIN ST in CULVER CITY, CA)
STATE MASTER (California - Hazardous Waste Tracking) - HAZARDOU WASTE PROGRAM Small Quantity Generators, between 100 kg and 1000 kg of hazardous waste/month (Resource Conservation and Recovery Act (tracking hazardous waste)) - notification Organizations: LA CITY HOUSING AUTHORITY (CONTACT/OWNER)
Alternative names: CITY OF LA/HOUSING AUTHORITY
CINEMA CLEANERS (10980 JEFFERSON BLVD in CULVER CITY, CA)
STATE MASTER (California - Hazardous Waste Tracking) - HAZARDOU WASTE PROGRAM Small Quantity Generators, between 100 kg and 1000 kg of hazardous waste/month (Resource Conservation and Recovery Act (tracking hazardous waste)) - notification Organizations: MIKE AZADEH (CONTACT/OWNER)
JUST TIRES NO 8626 (5547 S SEPULVEDA BLVD in CULVER CITY, CA)
STATE MASTER (California - Hazardous Waste Tracking) - HAZARDOU WASTE PROGRAM Small Quantity Generators, between 100 kg and 1000 kg of hazardous waste/month (Resource Conservation and Recovery Act (tracking hazardous waste)) - notification Organizations: GOODYEAR CORP (CONTACT/OWNER)
MAAX TRANSMISSION (3817 SEPULVEDA BLVD in CULVER CITY, CA)
STATE MASTER (California - Hazardous Waste Tracking) - HAZARDOU WASTE PROGRAM Small Quantity Generators, between 100 kg and 1000 kg of hazardous waste/month (Resource Conservation and Recovery Act (tracking hazardous waste)) - notification Organizations: HYE K KANG (CONTACT/OWNER)
EZ LUBE INC #37 (5380 SEPULVEDA BLVD in CULVER CITY, CA)
Small Quantity Generators, between 100 kg and 1000 kg of hazardous waste/month (Resource Conservation and Recovery Act (tracking hazardous waste)) - notification STATE MASTER (California - Used Oil Recycling System ) - USED OIL RECYCLING Organizations: CHEVRON USA PRODUCTS CO (CONTACT/OWNER)
Alternative names: CHEVRON STATION 9 3666
EL MARINO ELEMENTARY (11450 PORT ROAD in CULVER CITY, CA)
(National Center for Education Statistics) - STATE ID-6012678 Organizations: CULVER CITY UNIFIED (SCHOOL DISTRICT)
EL RINCON ELEMENTARY (11177 OVERLAND AVE. in CULVER CITY, CA)
(National Center for Education Statistics) - STATE ID-6012686 Organizations: CULVER CITY UNIFIED (SCHOOL DISTRICT)
FARRAGUT ELEMENTARY (10820 FARRAGUT DR. in CULVER CITY, CA)
(National Center for Education Statistics) - STATE ID-6012694 Organizations: CULVER CITY UNIFIED (SCHOOL DISTRICT)
Housing units lacking complete plumbing facilities: 0.2% Housing units lacking complete kitchen facilities: 1.2%
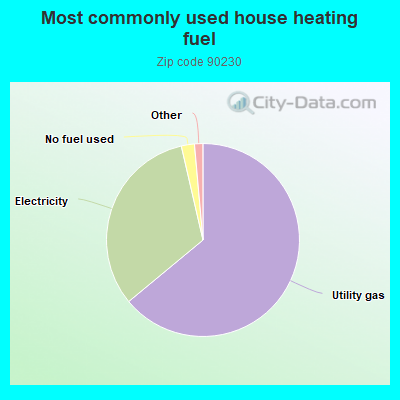
64.0%Utility gas
32.4%Electricity
2.2%No fuel used
0.8%Bottled, tank, or LP gas
0.7%Solar energy
Population in 1990: 32,207.
Place of birth for U.S.-born residents:
This state: 15,452
Northeast: 2,209
Midwest: 2,074
South: 1,650
West: 1,284
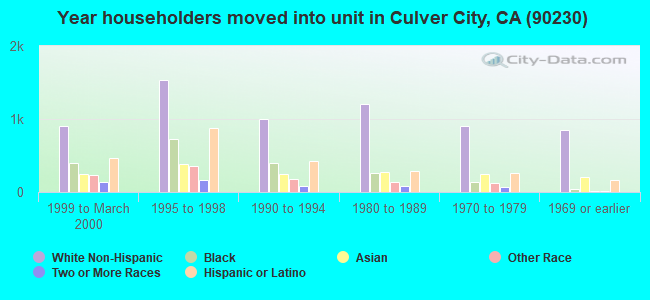
61% of the 90230 zip code residents lived in the same house 5 years ago. Out of people who lived in different houses, 81% lived in this county. Out of people who lived in different counties, 50% lived in California.
91% of the 90230 zip code residents lived in the same house 1 year ago. Out of people who lived in different houses, 79% moved from this county. Out of people who lived in different houses, 8% moved from different county within same state. Out of people who lived in different houses, 8% moved from different state. Out of people who lived in different houses, 4% moved from abroad.
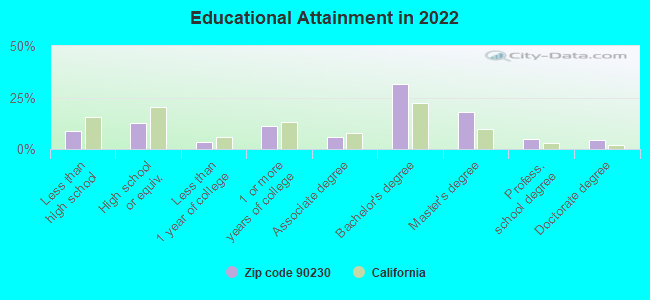
Private vs. public school enrollment:
Students in private schools in grades 1 to 8 (elementary and middle school): 260
Here:
8.7%
California:
10.5%
Students in private schools in grades 9 to 12 (high school): 218
Here:
23.3%
California:
8.5%
Students in private undergraduate colleges: 184
Here:
15.9%
California:
15.9%
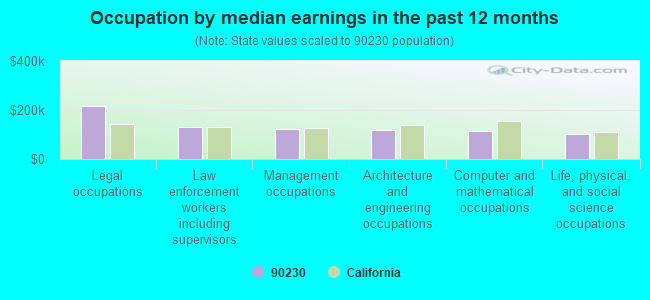
Occupation by median earnings in the past 12 months ($)
217,809Legal occupations
128,914Law enforcement workers including supervisors
122,163Management occupations
119,893Architecture and engineering occupations
114,924Computer and mathematical occupations
101,509Life, physical, and social science occupations
Companies with biggest federal contracts located in this zip code (CULVER CITY, CA):
RAYTHEON COMPANY (INC) (6775 S CENTINELA AVE) : $66,780,908 in 88 contractsfrom 1999 to 2006
Contracts for Engineering and Technical Services, Defense Aircraft -- Advanced Development (R&D), Other Special Studies and Analyses, Electronic Countermeasures, Counter-Countermeasures and Quick Reaction Capability Equipment, and moreby Navy, Air Force Signed by year:2000: $29,878,077; 2001: $26,992,551; 2002: $6,658,455; 2003: $0; 2004: $0; 2005: -$254,930; 2006: -$233,971.
Biggest contracts:
$7,540,674 with Navy for Engineering and Technical Services. Signed on 2001-05-02. Completion date: 2002-05-28.
$4,028,486 with Air Force for Defense Aircraft -- Advanced Development (R&D). Signed on 2002-05-01. Completion date: 2002-12-09.
$3,886,441 with Air Force for Other Special Studies and Analyses. Signed on 2000-08-17. Completion date: 2002-12-31.
$3,748,525, same as above.Signed on 2001-02-06. Completion date: 2002-09-30.
RESEARCH & DEVELOPMENT LABS (5855 GREEN VALLEY CIRCLE D) : $9,444,775 in 9 contractsfrom 1999 to 2002
Contracts for Other Defense -- Applied Research and Exploratory Development (R&D), Other Defense -- Basic Research (R&D), R&D-Commercial Programs A Res/Exp D, Aeronautics and Space Technology -- Advanced Development (R&D) by Air Force, NASA, Department of Defense Signed by year:2000: $4,574,638; 2001: $2,887,257; 2002: $1,870,555; 2003: $0; 2004: $0; 2005: $0; 2006: $0.
Biggest contracts:
$4,100,000 with Air Force for Other Defense -- Applied Research and Exploratory Development (R&D). Signed on 2000-09-29. Completion date: 2002-03-31.
$2,887,257, same as above.Signed on 2001-07-23. Completion date: 2002-12-31.
$2,017,045 with Air Force for Other Defense -- Basic Research (R&D). Signed on 2002-09-18. Completion date: 2003-09-30.
$274,638 with Air Force for Other Defense -- Applied Research and Exploratory Development (R&D). Signed on 2000-12-27. Completion date: 2002-03-31.
APIC CORPORATION (5800 UPLANDER WAY; small business) : $7,271,885 in 5 contractsfrom 2003 to 2006
Contracts for Other Defense -- Applied Research and Exploratory Development (R&D), Other Defense -- Advanced Development (R&D) by Air Force, Navy Signed by year:2000: $0; 2001: $0; 2002: $0; 2003: $424,955; 2004: $3,851,286; 2005: $1,549,923; 2006: $1,445,721.
Biggest contracts:
$2,998,423 with Air Force for Other Defense -- Applied Research and Exploratory Development (R&D). Signed on 2004-06-09. Completion date: 2005-07-08.
$1,549,923, same as above.Signed on 2005-06-17. Completion date: 2007-06-17.
$1,445,721, same as above.Signed on 2006-01-30. Completion date: 2006-11-30.
$852,863, same as above.Signed on 2004-04-30. Completion date: 2005-07-29.
LASSON TECHNOLOGIES, INC (6059 BRISTOL PARKWAY; small business) : $2,531,970 in 15 contractsfrom 1999 to 2005
Contracts for Other Defense -- Applied Research and Exploratory Development (R&D), Defense Missile and Space Systems -- Advanced Development (R&D), Aeronautics and Space Technology -- Applied Research and Exploratory Development (R&D), Defense Electronics and Communication Equipment -- Advanced Development (R&D), and moreby Department of Defense, Army, NASA, Air Force, and others Signed by year:2000: $555,712; 2001: $25,000; 2002: $67,777; 2003: $1,062,793; 2004: $569,447; 2005: $83,241; 2006: $0.
Biggest contracts:
$613,665 with Department of Defense for Other Defense -- Applied Research and Exploratory Development (R&D). Signed on 2003-06-27. Completion date: 2005-04-01.
$400,000 with Army for Defense Missile and Space Systems -- Advanced Development (R&D). Signed on 2004-05-11. Completion date: 2005-06-30.
$349,128, same as above.Signed on 2003-07-01. Completion date: 2005-06-30.
$274,000 with NASA for Aeronautics and Space Technology -- Applied Research and Exploratory Development (R&D). Signed on 2000-11-15. Completion date: 2001-10-15.
ENCOMPASS KNOWLEDGE SYSTEMS, I (100 CORPORATE POINTE STE 2; small business) : $370,290 in 5 contractsfrom 2001 to 2005
Contracts for Other Management Support Services, Other Administrative Support Services, ADP Systems Development Services by Navy Signed by year:2000: $0; 2001: $75,000; 2002: $0; 2003: $150,000; 2004: $120,450; 2005: $24,840; 2006: $0.
Biggest contracts:
$150,000 with Navy for Other Management Support Services. Signed on 2003-06-16. Completion date: 2003-11-07.
$80,437 with Navy for Other Administrative Support Services. Signed on 2004-04-06. Completion date: 2004-03-31.
$75,000 with Navy for ADP Systems Development Services. Signed on 2001-06-20. Completion date: 2001-09-30.
$40,013 with Navy for Other Administrative Support Services. Signed on 2004-01-15. Completion date: 2004-03-31.
ROURKE ENGINEERING INC (5616 CORRYNE PL; small business) : $240,847 in 22 contractsfrom 2000 to 2006
Contracts for Aircraft Ground Servicing Equipment, Electrical Hardware and Supplies, Miscellaneous Aircraft Accessories and Components, Radar Equipment, Except Airborne, and moreby Navy, Defense Logistics Agency Signed by year:2000: $33,750; 2001: $0; 2002: $0; 2003: $0; 2004: $110,206; 2005: $63,094; 2006: $33,797.
Biggest contracts:
$33,750 with Navy for Aircraft Ground Servicing Equipment. Signed on 2000-04-27. Completion date: 2000-09-05.
$32,995 with Defense Logistics Agency for Aircraft Ground Servicing Equipment. Signed on 2004-12-03. Completion date: 2005-03-03.
$31,845, same as above.Signed on 2004-02-23. Completion date: 2004-05-21.
$16,450 with Defense Logistics Agency for Electrical Hardware and Supplies. Signed on 2004-12-02. Completion date: 2005-04-01.
G & K MANAGEMENT COMPANY (5150 OVERLAND AVE; small business) : $233,654 in 14 contractsfrom 2002 to 2003
Contracts for Lodging - Hotel/Motel by Army Signed by year:2000: $0; 2001: $0; 2002: $145,650; 2003: $88,004; 2004: $0; 2005: $0; 2006: $0.
Biggest contracts:
$101,286 with Army for Lodging - Hotel/Motel. Signed on 2002-10-17. Completion date: 2002-10-31.
$86,000, same as above.Signed on 2003-03-10. Completion date: 2003-09-12.
$13,056, same as above.Signed on 2002-10-17. Completion date: 2003-03-31.
$11,254, same as above.Signed on 2002-10-17. Completion date: 2003-03-31.
SUPREME SUPPLY CO , INC (5601 W SLAUSON AVENUE; small business) : $180,796 in 30 contractsfrom 2003 to 2006
Contracts for Refrigeration and Air Conditioning Components, Compressors and Vacuum Pumps, Guided Missile Maintenance, Repair, and Checkout Specialized Equipment, Miscellaneous Chemical Specialties, and moreby Defense Logistics Agency, Navy, U.S. Fish and Wildlife Service, Army, and others Signed by year:2000: $0; 2001: $0; 2002: $0; 2003: $1,216; 2004: $64,675; 2005: $78,551; 2006: $36,354.
Biggest contracts:
$18,855 with Defense Logistics Agency for Refrigeration and Air Conditioning Components. Signed on 2006-03-14. Completion date: 2006-06-13.
$17,955, same as above.Signed on 2004-11-15. Completion date: 2005-02-11.
$16,705, same as above.Signed on 2005-03-12. Completion date: 2005-06-10.
$14,212, same as above.Signed on 2005-08-30. Completion date: 2005-11-16.
CYBERRND, INC (10705 CRANKS RD; small business) : $168,723 in 2 contractsfrom 2002 to 2005
$98,724 with Army for Defense Missile and Space Systems -- Advanced Development (R&D). Signed on 2005-02-15. Completion date: 2005-08-15.
$69,999 with Department of Defense for Other Defense -- Advanced Development (R&D). Signed on 2002-06-07. Completion date: 2002-12-09.
LA BREA HEATING AND AIR CONDIT (5601 W SLAUSON AVE , SUIT; small business) : $112,962 in 4 contractsfrom 2000 to 2005
$41,596 with Air Force for Air Conditioning Equipment. Signed on 2001-09-21. Completion date: 2001-12-06.
$38,166 with Air Force for Refrigeration Equipment. Signed on 2002-09-11. Completion date: 2002-09-11.
$30,000 with NASA for Air Conditioning Equipment. Signed on 2000-09-15. Completion date: 2000-10-15.
$3,200 with Navy for Refrigeration Equipment. Signed on 2005-04-19. Completion date: 2005-05-31.
Top industries in this zip code by the number of employees in 2005:
Administrative and Support and Waste Management and Remediation Services: Temporary Help Services (500-999 employees: 2 establishments, 250-499 employees: 2 establishments, 100-249 employees: 5 establishments, 50-99 employees: 2 establishments, 20-49 employees: 2 establishments, 10-19 employees: 1 establishment, 5-9 employees: 2 establishments, 1-4 employees: 4 establishments)
2005 - 2018 National Fire Incident Reporting System (NFIRS) incidents
Based on the data from the years 2005 - 2018 the average number of fire incidents per year is 31. The highest number of reported fire incidents - 97 took place in 2018, and the least - 8 in 2009. The data has a rising trend.
When looking into fire subcategories, the most incidents belonged to: Structure Fires (42.9%), and Outside Fires (31.5%).
Fire incident types reported to NFIRS in Zip Code 90230


 Nearest zip codes: 90232, 90056, 90094, 90034, 90066, 90302.


 Based on the data from the years 2005 - 2018 the average number of fire incidents per year is 31. The highest number of reported fire incidents - 97 took place in 2018, and the least - 8 in 2009. The data has a rising trend.
 When looking into fire subcategories, the most incidents belonged to: Structure Fires (42.9%), and Outside Fires (31.5%).