Estimated zip code population in 2022: 53,692 Zip code population in 2010: 55,277 Zip code population in 2000: 55,194
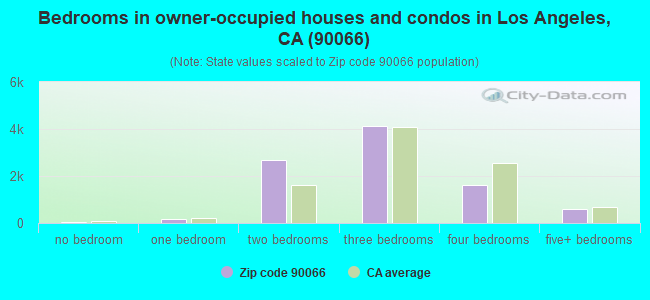
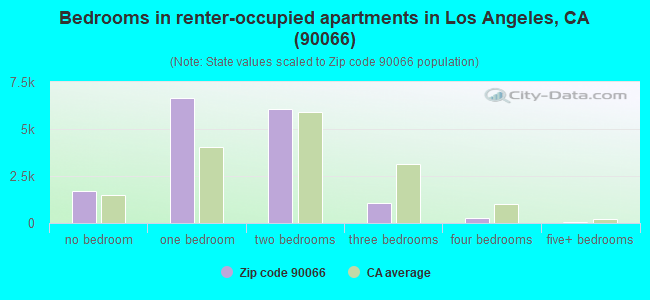
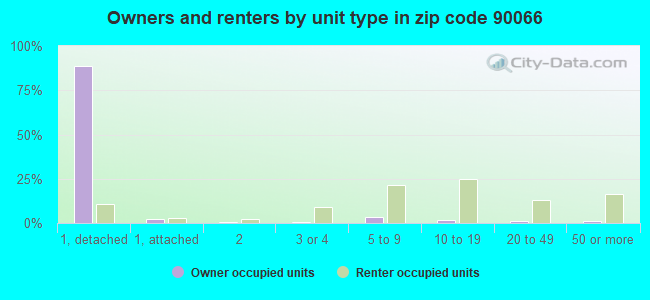
Houses and condos: 26,520 Renter-occupied apartments: 15,820
% of renters here:
63%
State:
44%
March 2022 cost of living index in zip code 90066: 147.7 (very high, U.S. average is 100)
Land area: 4.9 sq. mi. Water area: 0.1 sq. mi.
Population density: 10,906 people per square mile
(high).
OSM Map
General Map
Google Map
MSN Map
OSM Map
General Map
Google Map
MSN Map
OSM Map
General Map
Google Map
MSN Map
OSM Map
General Map
Google Map
MSN Map
Please wait while loading the map...
Real estate property taxes paid for housing units in 2022:
This zip code:
0.4% ($7,328)
California:
0.7% ($4,831)
Median real estate property taxes paid for housing units with mortgages in 2022: $8,948 (0.5%) Median real estate property taxes paid for housing units with no mortgage in 2022: $4,649 (0.3%)
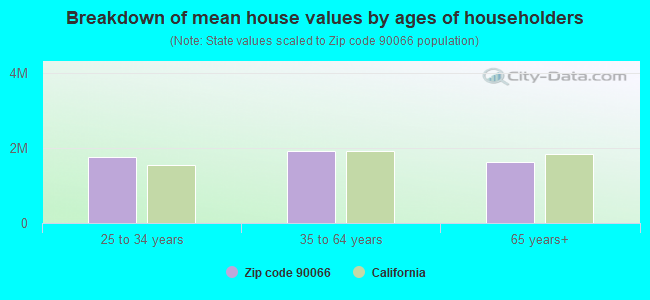
Estimated median house/condo value in 2022: $1,649,621
90066:
$1,649,621
California:
$715,900
According to our research of California and other state lists, there were 23 registered sex offenders living in 90066 zip code as of April 27, 2024. The ratio of all residents to sex offenders in zip code 90066 is 2,613 to 1. The ratio of registered sex offenders to all residents in this zip code is much lower than the state average.
Median resident age:
This zip code:
39.9 years
California median age:
37.9 years
Average household size:
This zip code:
2.1 people
California:
2.8 people
Averages for the 2020 tax year for zip code 90066, filed in 2021:
Average Adjusted Gross Income (AGI) in 2020: $121,316 (Individual Income Tax Returns)
Here:
$121,316
State:
$95,910
Salary/wage: $103,297 (reported on 77.8% of returns)
Here:
$103,297
State:
$77,331
(% of AGI for various income ranges: 1196.3% for AGIs below $25k, 4090.9% for AGIs $25k-50k, 7539.5% for AGIs $50k-75k, 11179.9% for AGIs $75k-100k, 20774.3% for AGIs $100k-200k, 125817.7% for AGIs over 200k)
Taxable interest for individuals: $2,358 (reported on 40.8% of returns)
This zip code:
$2,358
California:
$2,294
(% of AGI for various income ranges: 37.6% for AGIs below $25k, 41.0% for AGIs $25k-50k, 77.2% for AGIs $50k-75k, 95.1% for AGIs $75k-100k, 240.7% for AGIs $100k-200k, 1562.6% for AGIs over 200k)
Ordinary dividends: $8,087 (reported on 33.1% of returns)
Here:
$8,087
State:
$10,949
(% of AGI for various income ranges: 63.0% for AGIs below $25k, 88.1% for AGIs $25k-50k, 142.6% for AGIs $50k-75k, 255.5% for AGIs $75k-100k, 645.7% for AGIs $100k-200k, 4872.7% for AGIs over 200k)
Net capital gain/loss in AGI: +$34,172 (reported on 31.8% of returns)
Here:
+$34,172
State:
+$49,306
(% of AGI for various income ranges: 47.4% for AGIs below $25k, 94.2% for AGIs $25k-50k, 143.5% for AGIs $50k-75k, 300.5% for AGIs $75k-100k, 973.8% for AGIs $100k-200k, 27998.3% for AGIs over 200k)
Profit/loss from business: +$18,474 (reported on 26.4% of returns)
Here:
+$18,474
State:
+$15,671
(% of AGI for various income ranges: 316.7% for AGIs below $25k, 393.4% for AGIs $25k-50k, 395.4% for AGIs $50k-75k, 562.4% for AGIs $75k-100k, 1087.9% for AGIs $100k-200k, 6927.9% for AGIs over 200k)
Taxable individual retirement arrangement distribution: $24,153 (reported on 7.6% of returns)
90066:
$24,153
California:
$23,505
(% of AGI for various income ranges: 55.1% for AGIs below $25k, 92.1% for AGIs $25k-50k, 171.6% for AGIs $50k-75k, 306.9% for AGIs $75k-100k, 648.9% for AGIs $100k-200k, 2250.6% for AGIs over 200k)
Self-employed (Keogh) retirement plans: $28,465 (reported on 1.9% of returns)
90066:
$28,465
California:
$30,163
(% of AGI for various income ranges: 12.2% for AGIs $25k-50k, 15.7% for AGIs $50k-75k, 28.4% for AGIs $75k-100k, 101.1% for AGIs $100k-200k, 1190.6% for AGIs over 200k)
Total itemized deductions: $36,443 (reported on 17.8% of returns)
Here:
$36,443
State:
$39,517
(% of AGI for various income ranges: 174.4% for AGIs below $25k, 225.6% for AGIs $25k-50k, 455.3% for AGIs $50k-75k, 898.4% for AGIs $75k-100k, 2070.2% for AGIs $100k-200k, 9761.4% for AGIs over 200k)
Charity contributions: $6,923 (reported on 15.2% of returns)
Here:
$6,923
State:
$12,598
(% of AGI for various income ranges: 9.0% for AGIs below $25k, 20.9% for AGIs $25k-50k, 43.4% for AGIs $50k-75k, 97.5% for AGIs $75k-100k, 263.1% for AGIs $100k-200k, 2047.1% for AGIs over 200k)
Taxes paid: $8,914 (reported on 17.8% of returns)
90066:
$8,914
State:
$8,807
(% of AGI for various income ranges: 35.3% for AGIs below $25k, 55.5% for AGIs $25k-50k, 111.6% for AGIs $50k-75k, 251.7% for AGIs $75k-100k, 568.6% for AGIs $100k-200k, 2203.0% for AGIs over 200k)
Earned income credit: $1,291 (reported on 8.2% of returns)
Here:
$1,291
State:
$2,074
(% of AGI for various income ranges: 49.1% for AGIs below $25k, 30.4% for AGIs $25k-50k, 0.4% for AGIs $50k-75k)
Percentage of individuals using paid preparers for their 2020 taxes: 92.3%
Here:
92%
State:
92%
(% for various income ranges: 89.1% for AGIs below $25k, 91.4% for AGIs $25k-50k, 93.1% for AGIs $50k-75k, 94.0% for AGIs $75k-100k, 94.1% for AGIs $100k-200k, 95.3% for AGIs over 200k)
Averages for the 2012 tax year for zip code 90066, filed in 2013:
Average Adjusted Gross Income (AGI) in 2012: $75,765 (Individual Income Tax Returns)
Here:
$75,765
State:
$72,726
Salary/wage: $66,867 (reported on 79.8% of returns)
Here:
$66,867
State:
$59,079
(% of AGI for various income ranges: 69.4% for AGIs below $25k, 80.3% for AGIs $25k-50k, 78.3% for AGIs $50k-75k, 75.4% for AGIs $75k-100k, 73.8% for AGIs $100k-200k, 61.3% for AGIs over 200k)
Taxable interest for individuals: $1,866 (reported on 40.1% of returns)
This zip code:
$1,866
California:
$2,146
(% of AGI for various income ranges: 1.5% for AGIs below $25k, 0.8% for AGIs $25k-50k, 0.8% for AGIs $50k-75k, 0.9% for AGIs $75k-100k, 0.9% for AGIs $100k-200k, 1.1% for AGIs over 200k)
Ordinary dividends: $6,625 (reported on 25.3% of returns)
Here:
$6,625
State:
$9,308
(% of AGI for various income ranges: 2.2% for AGIs below $25k, 1.3% for AGIs $25k-50k, 1.3% for AGIs $50k-75k, 1.7% for AGIs $75k-100k, 1.9% for AGIs $100k-200k, 3.2% for AGIs over 200k)
Net capital gain/loss in AGI: +$11,662 (reported on 22.0% of returns)
Here:
+$11,662
State:
+$30,460
(% of AGI for various income ranges: 0.2% for AGIs $25k-50k, 0.4% for AGIs $50k-75k, 0.7% for AGIs $75k-100k, 1.4% for AGIs $100k-200k, 8.0% for AGIs over 200k)
Profit/loss from business: +$18,454 (reported on 25.4% of returns)
Here:
+$18,454
State:
+$17,064
(% of AGI for various income ranges: 17.4% for AGIs below $25k, 7.5% for AGIs $25k-50k, 5.4% for AGIs $50k-75k, 5.1% for AGIs $75k-100k, 5.1% for AGIs $100k-200k, 5.4% for AGIs over 200k)
Taxable individual retirement arrangement distribution: $17,455 (reported on 8.8% of returns)
90066:
$17,455
California:
$19,557
(% of AGI for various income ranges: 2.8% for AGIs below $25k, 1.9% for AGIs $25k-50k, 2.2% for AGIs $50k-75k, 2.4% for AGIs $75k-100k, 2.5% for AGIs $100k-200k, 1.4% for AGIs over 200k)
Self-employment retirement plans: $20,804 (reported on 1.9% of returns)
90066:
$20,804
California:
$24,530
(% of AGI for various income ranges: 0.1% for AGIs below $25k, 0.2% for AGIs $25k-50k, 0.3% for AGIs $50k-75k, 0.4% for AGIs $75k-100k, 0.4% for AGIs $100k-200k, 0.9% for AGIs over 200k)
Total itemized deductions: $32,165 (22% of AGI, reported on 38.1% of returns)
Here:
$32,165
State:
$34,004
Here:
22.4% of AGI
State:
22.7% of AGI
(% of AGI for various income ranges: 13.9% for AGIs below $25k, 10.9% for AGIs $25k-50k, 13.6% for AGIs $50k-75k, 16.5% for AGIs $75k-100k, 19.6% for AGIs $100k-200k, 16.6% for AGIs over 200k)
Charity contributions: $3,122 (reported on 31.7% of returns)
Here:
$3,122
State:
$4,659
(% of AGI for various income ranges: 0.7% for AGIs below $25k, 0.9% for AGIs $25k-50k, 1.3% for AGIs $50k-75k, 1.4% for AGIs $75k-100k, 1.6% for AGIs $100k-200k, 1.3% for AGIs over 200k)
Taxes paid: $14,328 (reported on 38.0% of returns)
90066:
$14,328
State:
$14,448
(% of AGI for various income ranges: 2.5% for AGIs below $25k, 2.5% for AGIs $25k-50k, 3.9% for AGIs $50k-75k, 6.1% for AGIs $75k-100k, 8.2% for AGIs $100k-200k, 10.0% for AGIs over 200k)
Earned income credit: $1,574 (reported on 11.5% of returns)
Here:
$1,574
State:
$2,286
(% of AGI for various income ranges: 3.4% for AGIs below $25k, 0.5% for AGIs $25k-50k)
Percentage of individuals using paid preparers for their 2012 taxes: 64.4%
Here:
64%
State:
64%
(% for various income ranges: 62.6% for AGIs below $25k, 60.2% for AGIs $25k-50k, 61.4% for AGIs $50k-75k, 64.3% for AGIs $75k-100k, 71.1% for AGIs $100k-200k, 80.7% for AGIs over 200k)
Averages for the 2004 tax year for zip code 90066, filed in 2005:
Average Adjusted Gross Income (AGI) in 2004: $55,465 (Individual Income Tax Returns)
Here:
$55,465
State:
$58,600
Salary/wage: $50,230 (reported on 79.8% of returns)
Here:
$50,230
State:
$49,455
(% of AGI for various income ranges: 201.0% for AGIs below $10k, 74.0% for AGIs $10k-25k, 83.7% for AGIs $25k-50k, 79.3% for AGIs $50k-75k, 76.7% for AGIs $75k-100k, 63.6% for AGIs over 100k)
Taxable interest for individuals: $1,862 (reported on 49.0% of returns)
This zip code:
$1,862
California:
$2,365
(% of AGI for various income ranges: 19.0% for AGIs below $10k, 2.6% for AGIs $10k-25k, 1.4% for AGIs $25k-50k, 1.7% for AGIs $50k-75k, 1.5% for AGIs $75k-100k, 1.5% for AGIs over 100k)
Taxable dividends: $3,038 (reported on 27.8% of returns)
Here:
$3,038
State:
$4,746
(% of AGI for various income ranges: 16.5% for AGIs below $10k, 1.8% for AGIs $10k-25k, 1.0% for AGIs $25k-50k, 1.4% for AGIs $50k-75k, 1.5% for AGIs $75k-100k, 1.5% for AGIs over 100k)
Net capital gain/loss: +$11,694 (reported on 24.4% of returns)
Here:
+$11,694
State:
+$23,418
(% of AGI for various income ranges: -3.6% for AGIs below $10k, 0.3% for AGIs $10k-25k, 0.4% for AGIs $25k-50k, 0.8% for AGIs $50k-75k, 1.3% for AGIs $75k-100k, 9.8% for AGIs over 100k)
Profit/loss from business: +$14,673 (reported on 24.3% of returns)
Here:
+$14,673
State:
+$16,826
(% of AGI for various income ranges: 38.1% for AGIs below $10k, 11.9% for AGIs $10k-25k, 5.4% for AGIs $25k-50k, 5.1% for AGIs $50k-75k, 6.8% for AGIs $75k-100k, 6.0% for AGIs over 100k)
Profit/loss from farming: +$1,000 (reported on 0.1% of returns)
Here:
+$1,000
State:
-$7,562
IRA payment deduction: $3,036 (reported on 3.9% of returns)
90066:
$3,036
California:
$3,192
(% of AGI for various income ranges: 1.1% for AGIs below $10k, 0.3% for AGIs $10k-25k, 0.3% for AGIs $25k-50k, 0.3% for AGIs $50k-75k, 0.3% for AGIs $75k-100k, 0.1% for AGIs over 100k)
Self-employed pension: $15,849 (reported on 2.3% of returns)
Here:
$15,849
California:
$17,688
(% of AGI for various income ranges: 0.3% for AGIs below $10k, 0.1% for AGIs $10k-25k, 0.2% for AGIs $25k-50k, 0.3% for AGIs $50k-75k, 0.5% for AGIs $75k-100k, 1.1% for AGIs over 100k)
Total itemized deductions: $25,127 (24% of AGI, reported on 37.9% of returns)
Here:
$25,127
State:
$28,113
Here:
24.4% of AGI
State:
25.3% of AGI
(% of AGI for various income ranges: 56.0% for AGIs below $10k, 11.6% for AGIs $10k-25k, 12.9% for AGIs $25k-50k, 17.7% for AGIs $50k-75k, 20.3% for AGIs $75k-100k, 18.2% for AGIs over 100k)
Charity contributions deductions: $3,111 (3% of AGI, reported on 33.3% of returns)
Here:
$3,111
State:
$3,923
Here:
2.8% of AGI
State:
3.3% of AGI
(% of AGI for various income ranges: 2.4% for AGIs below $10k, 1.0% for AGIs $10k-25k, 1.4% for AGIs $25k-50k, 1.9% for AGIs $50k-75k, 2.1% for AGIs $75k-100k, 2.1% for AGIs over 100k)
Total tax: $9,758 (reported on 80.4% of returns)
90066:
$9,758
State:
$10,761
(% of AGI for various income ranges: 13.9% for AGIs below $10k, 5.3% for AGIs $10k-25k, 8.2% for AGIs $25k-50k, 11.0% for AGIs $50k-75k, 12.1% for AGIs $75k-100k, 18.9% for AGIs over 100k)
Earned income credit: $1,371 (reported on 10.9% of returns)
Here:
$1,371
State:
$1,763
Percentage of individuals using paid preparers for their 2004 taxes: 65.3%
Here:
65%
State:
66%
(% for various income ranges: 59.7% for AGIs below $10k, 64.8% for AGIs $10k-25k, 62.2% for AGIs $25k-50k, 64.8% for AGIs $50k-75k, 69.3% for AGIs $75k-100k, 77.9% for AGIs over 100k)
Likely homosexual households (counted as self-reported same-sex unmarried-partner households)
Lesbian couples: 0.2% of all households
Gay men: 0.2% of all households
Household received Food Stamps/SNAP in the past 12 months: 1,113 Household did not receive Food Stamps/SNAP in the past 12 months: 23,556
Women who had a birth in the past 12 months: 617 (488 now married, 127 unmarried) Women who did not have a birth in the past 12 months: 13,611 (4,996 now married, 8,631 unmarried)
Housing units in zip code 90066 with a mortgage: 5,780 (719 second mortgage, 18 home equity loan, 642 both second mortgage and home equity loan) Houses without a mortgage: 96
Median monthly owner costs for units with a mortgage: $3,774 Median monthly owner costs for units without a mortgage: $804
Residents with income below the poverty level in 2022:
This zip code:
7.1%
Whole state:
12.2%
Residents with income below 50% of the poverty level in 2022:
This zip code:
3.4%
Whole state:
6.2%
Median number of rooms in houses and condos:
Here:
5.8
State:
6.0
Median number of rooms in apartments:
Here:
3.2
State:
3.9
Notable locations in this zip code not listed on our city pages
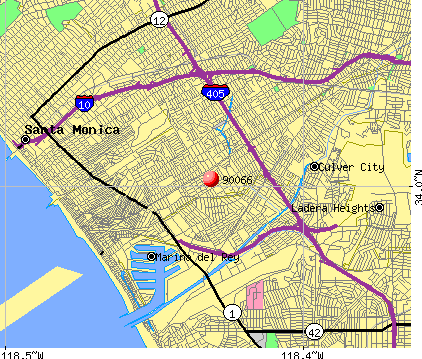
Notable locations in zip code 90066: Mar Vista Branch Los Angeles Public Library (A), Pacific Community Police Station (B), City of Los Angeles Fire Department Station 62 (C). Display/hide their locations on the map
Churches in zip code 90066 include: Church of Jesus Christ of Latter Day Saints (A), Mar Vista Ward Latter Day Saints Chapel (B), Venice - Santa Monica Free Church (C), Venice Buddhist Church (D), Saint Gerard Majella Church (E), Marina Christian Fellowship Church (F), Iglesia Palabra Y Poder (G), Foursquare Church (H), Culver Community Christian Center (I). Display/hide their locations on the map
5,761 married couples with children.
1,797 single-parent households (662 men, 1,135 women).
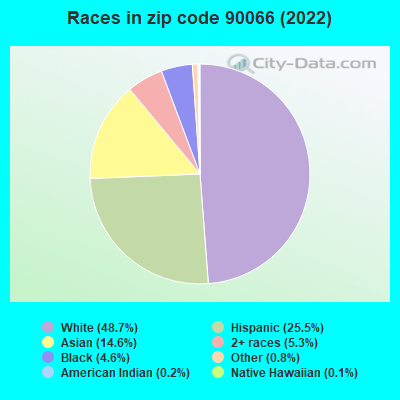
62.0% of residents of 90066 zip code speak English at home.
20.3% of residents speak Spanish at home (65% very well, 18% well, 12% not well, 5% not at all).
8.0% of residents speak other Indo-European language at home (88% very well, 7% well, 4% not well, 1% not at all).
8.0% of residents speak Asian or Pacific Island language at home (66% very well, 25% well, 8% not well, 1% not at all).
2.0% of residents speak other language at home (74% very well, 15% well, 11% not well).
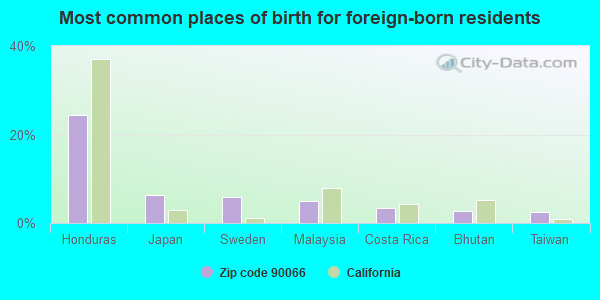
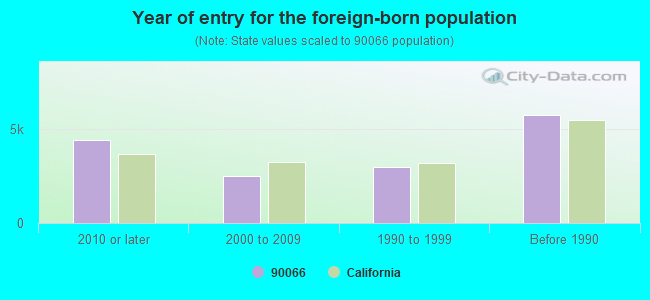
Foreign born population: 14,263 (26.6%) (53.3% of them are naturalized citizens)
Major facilities with environmental interests located in this zip code:
LAUSD--PHOENIX CONTINUATION (12971 ZANJA ST. in LOS ANGELES, CA)
(National Center for Education Statistics) - STATE ID-1930783 Large Quantity Generators, more that 1000 kg of hazardous waste/month (Resource Conservation and Recovery Act (tracking hazardous waste)) Organizations: LOS ANGELES UNIFIED (SCHOOL DISTRICT)
GENZYME GENETICS (5300 MC CONNELL AVE in LOS ANGELES, CA)
STATE MASTER (California - Hazardous Waste Tracking) - HAZARDOU WASTE PROGRAM Large Quantity Generators, more that 1000 kg of hazardous waste/month (Resource Conservation and Recovery Act (tracking hazardous waste)) Alternative names: IMPATH INC
LAUSD VENICE HIGH SCHOOL (13000 VENICE BLVD in LOS ANGELES, CA)
STATE MASTER (California - Hazardous Waste Tracking) - HAZARDOU WASTE PROGRAM Large Quantity Generators, more that 1000 kg of hazardous waste/month (Resource Conservation and Recovery Act (tracking hazardous waste)) Alternative names: LAUSD/ VENICE HS, VENICE SENIOR HIGH
CENTINELA FEED AND PET SUPPLY (3860 CENTINELA AVE in LOS ANGELES, CA)
(Integrated Compliance Information System) - ICIS-09-2000-0057, FORMAL ENFORCEMENT ACTION, ICIS-09-2001-0032, ICIS-04-2001-3017, COMPLIANCE ACTIVITY (Tracking inspections of insecticide, fungicide, and rodenticide, and toxic substances) Business SIC classification: CATALOG AND MAIL-ORDER HOUSES
LOS ANGELES USD MARK TWAIN JR HG SCH (2224 WALGROVE AVE in LOS ANGELES, CA)
STATE MASTER (California - Hazardous Waste Tracking) - HAZARDOU WASTE PROGRAM Small Quantity Generators, between 100 kg and 1000 kg of hazardous waste/month (Resource Conservation and Recovery Act (tracking hazardous waste)) - notification Organizations: LOS ANGELES UNIFIED SCHOOL DISTRICT (CONTACT/OWNER)
Alternative names: LAUSD/ MARK TWAIN JH
CENTINELLA CLEANERS (3511 S CENTINELLA in MAR VISTA, CA)
STATE MASTER (California - Hazardous Waste Tracking) - HAZARDOU WASTE PROGRAM Small Quantity Generators, between 100 kg and 1000 kg of hazardous waste/month (Resource Conservation and Recovery Act (tracking hazardous waste)) - notification Organizations: GEORGE E BECK (CONTACT/OWNER)
GRANDVIEW CLEANERS (12207 VENICE BLVD in LOS ANGELES, CA)
STATE MASTER (California - Hazardous Waste Tracking) - HAZARDOU WASTE PROGRAM Small Quantity Generators, between 100 kg and 1000 kg of hazardous waste/month (Resource Conservation and Recovery Act (tracking hazardous waste)) - notification Organizations: SAM LEFKOWTZ (CONTACT/OWNER)
MAR VISTA CLEANERS (3831 GRANDVIEW in LOS ANGELES, CA)
STATE MASTER (California - Hazardous Waste Tracking) - HAZARDOU WASTE PROGRAM Small Quantity Generators, between 100 kg and 1000 kg of hazardous waste/month (Resource Conservation and Recovery Act (tracking hazardous waste)) - notification Organizations: MATHEW SHAFTRAZAN (CONTACT/OWNER)
Alternative names: MARVISTA 1 CLEANERS
IMAGICA USA INC (5320 MCCONNELL AVE in LOS ANGELES, CA)
STATE MASTER (California - Hazardous Waste Tracking) - HAZARDOU WASTE PROGRAM Small Quantity Generators, between 100 kg and 1000 kg of hazardous waste/month (Resource Conservation and Recovery Act (tracking hazardous waste)) - notification Organizations: AIRPORT PACIFIC PROPERTIES (CONTACT/OWNER)
APPLE SHIRT (12912 VENICE BLVD in LOS ANGELES, CA)
STATE MASTER (California - Hazardous Waste Tracking) - HAZARDOU WASTE PROGRAM Small Quantity Generators, between 100 kg and 1000 kg of hazardous waste/month (Resource Conservation and Recovery Act (tracking hazardous waste)) - notification Organizations: ANDREW FAUNCH (CONTACT/OWNER)
FOREIGN AUTOHAUS (13123 WASHINGTON BLVD in LOS ANGELES, CA)
STATE MASTER (California - Hazardous Waste Tracking) - HAZARDOU WASTE PROGRAM Small Quantity Generators, between 100 kg and 1000 kg of hazardous waste/month (Resource Conservation and Recovery Act (tracking hazardous waste)) - notification
MCBRIDE (JAMES J.) SPECIAL ED. CENTER (3960 CENTINELA AVE. in LOS ANGELES, CA)
(National Center for Education Statistics) - STATE ID-6060511 Organizations: LOS ANGELES UNIFIED (SCHOOL DISTRICT)
MARK TWAIN MIDDLE (2224 WALGROVE AVE. in LOS ANGELES, CA)
(National Center for Education Statistics) - STATE ID-6058135 Organizations: LOS ANGELES UNIFIED (SCHOOL DISTRICT)
Housing units lacking complete plumbing facilities: 0.3% Housing units lacking complete kitchen facilities: 1.3%
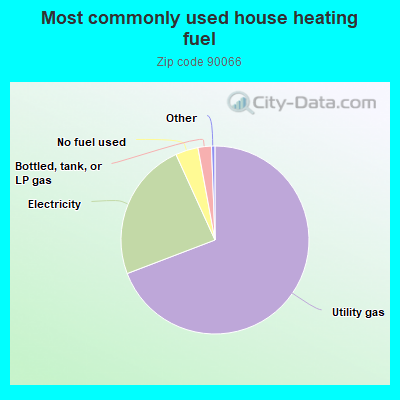
69.2%Utility gas
24.0%Electricity
3.9%No fuel used
2.3%Bottled, tank, or LP gas
Population in 1990: 53,095. Population change in the 1990s: +2,099 (+4.0%).
Place of birth for U.S.-born residents:
This state: 24,937
Northeast: 4,814
Midwest: 3,710
South: 2,850
West: 1,653
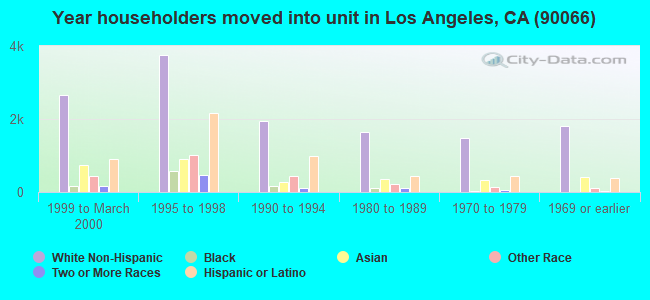
56% of the 90066 zip code residents lived in the same house 5 years ago. Out of people who lived in different houses, 77% lived in this county. Out of people who lived in different counties, 50% lived in California.
88% of the 90066 zip code residents lived in the same house 1 year ago. Out of people who lived in different houses, 65% moved from this county. Out of people who lived in different houses, 14% moved from different county within same state. Out of people who lived in different houses, 13% moved from different state. Out of people who lived in different houses, 5% moved from abroad.
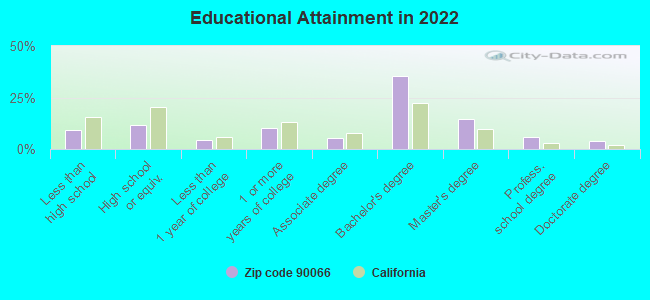
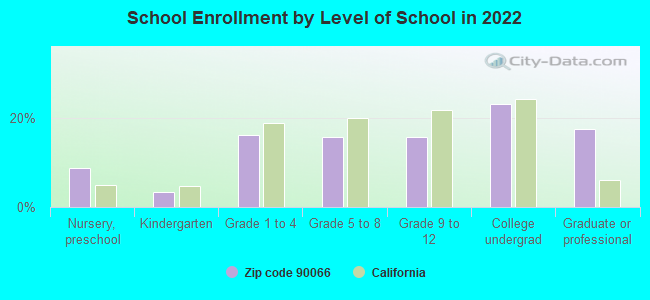
Private vs. public school enrollment:
Students in private schools in grades 1 to 8 (elementary and middle school): 704
Here:
20.7%
California:
10.5%
Students in private schools in grades 9 to 12 (high school): 154
Here:
9.2%
California:
8.5%
Students in private undergraduate colleges: 625
Here:
25.4%
California:
15.9%
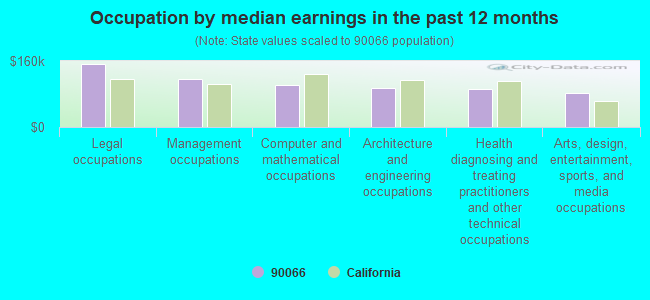
Occupation by median earnings in the past 12 months ($)
151,756Legal occupations
116,435Management occupations
100,807Computer and mathematical occupations
94,739Architecture and engineering occupations
92,128Health diagnosing and treating practitioners and other technical occupations
81,753Arts, design, entertainment, sports, and media occupations
Companies with biggest federal contracts located in this zip code (LOS ANGELES, CA):
TELEDYNE REYNOLDS, INC (5005 MCCONNELL AVENUE) : $10,756,210 in 154 contractsfrom 1999 to 2006
Contracts for Other Research and Development -- Advanced Development (R&D), Ammunition -- Basic Research (R&D), Miscellaneous Electric Power and Distribution Equipment, Cable, Cord, and Wire Assemblies: Communications Equipment, and moreby Air Force, Defense Logistics Agency, Navy, NASA, and others Signed by year:2000: $2,276,646; 2001: $158,797; 2002: $1,257,932; 2003: $2,152,367; 2004: $3,021,076; 2005: $1,225,073; 2006: $629,182.
Biggest contracts:
$1,546,000 with Air Force for Other Research and Development -- Advanced Development (R&D). Signed on 2004-04-02. Completion date: 2005-02-04.
$1,224,000 with Air Force for Ammunition -- Basic Research (R&D). Signed on 2000-02-28. Completion date: 2001-05-20.
$900,000 with Air Force for Other Research and Development -- Advanced Development (R&D). Signed on 2003-09-09. Completion date: 2005-02-04.
$600,995 with Air Force for Ammunition -- Basic Research (R&D). Signed on 2003-02-28. Completion date: 2003-08-13.
MERCURY AIR GROUP INC (5456 MCCONNELL AVE) : $10,721,098 in 4 contractsfrom 2000 to 2005
$7,629,004 with Defense Logistics Agency for Liquid Propellants and Fuels, Petroleum Base. Taking place in TN. Signed on 2001-04-01. Completion date: 2004-03-31.
$2,830,944 with Defense Logistics Agency for Liquid Propellants and Fuels, Petroleum Base. Signed on 2000-02-09. Completion date: 2003-03-31.
$252,120, same as above.Signed on 2000-02-29. Completion date: 2003-03-31.
$9,030, same as above.Signed on 2005-03-17. Completion date: 2005-03-17.
T D Y INDUSTRIES INC (12964 PANAMA ST; small business) : $8,667,647 in 41 contractsfrom 2000 to 2006
Contracts for Amplifiers, Other Professional Services, Aircraft Air Conditioning, Heating, and Pressurizing Equipment, Aircraft Alarm and Signal Systems, and moreby Air Force, Navy, Defense Logistics Agency, Army, and others Signed by year:2000: $834,243; 2001: -$284,542; 2002: $1,375,505; 2003: $2,338,904; 2004: $4,068,640; 2005: $76,364; 2006: $258,533.
Biggest contracts:
$3,417,963 with Air Force for Amplifiers. Signed on 2004-09-29. Completion date: 2006-01-31.
$2,140,364 with Air Force for Other Professional Services. Signed on 2003-11-20. Completion date: 2004-10-31.
$644,868 with Navy for Aircraft Air Conditioning, Heating, and Pressurizing Equipment. Signed on 2002-12-11. Completion date: 2003-12-12.
$481,975 with Defense Logistics Agency for Aircraft Alarm and Signal Systems. Signed on 2001-04-09. Completion date: 2001-10-06.
ENTERTAINMENT IN MOTION, INC (5455 CENTINELA AVENUE; small business) : $901,284 in 20 contractsfrom 1999 to 2004
Contracts for Lease or Rental of Equipment -- Miscellaneous by Navy Signed by year:2000: $150,089; 2001: $110,384; 2002: $107,526; 2003: $218,352; 2004: $266,003; 2005: $0; 2006: $0.
Biggest contracts:
$80,688 with Navy for Lease or Rental of Equipment -- Miscellaneous. Signed on 2003-09-08. Completion date: 2003-10-03.
$62,388, same as above.Signed on 2002-11-22. Completion date: 2002-12-16.
$53,913, same as above.Signed on 2004-05-10. Completion date: 2004-06-11.
$53,138, same as above.Signed on 2004-09-03. Completion date: 2004-11-01.
QSOL COM INC (12509 BEATRICE STREET; small business) : $465,450 in 11 contractsfrom 2002 to 2004
Contracts for ADP Central Processing Unit (CPU, Computer), Digital, ADPE System Configuration, ADP Input/Output and Storage Devices, Telephone and Telegraph Equipment by Army, Air Force, Department of Defense Signed by year:2000: $0; 2001: $0; 2002: $105,390; 2003: $297,250; 2004: $62,810; 2005: $0; 2006: $0.
Biggest contracts:
$84,300 with Army for ADP Central Processing Unit (CPU, Computer), Digital. Signed on 2003-02-04. Completion date: 2003-02-28.
$78,150 with Army for ADPE System Configuration. Signed on 2003-04-02. Completion date: 2004-05-01.
$77,140 with Army for ADP Central Processing Unit (CPU, Computer), Digital. Signed on 2002-11-08. Completion date: 2002-11-30.
$60,100, same as above.Signed on 2003-09-28. Completion date: 2003-09-30.
BARRY SCHIFF (PO BOX 661039; small business) : $164,125 in 7 contractsfrom 2002 to 2005
Contracts for Expert Witness, Legal Services by Offices, Boards and Divisions (includes Attorney General, Deputy Attorney General, etc.) Signed by year:2000: $0; 2001: $0; 2002: $64,250; 2003: $0; 2004: $41,025; 2005: $58,850; 2006: $0.
Biggest contracts:
$33,000 with Offices, Boards and Divisions (includes Attorney General, Deputy Attorney General, etc.) for Expert Witness. Taking place in DC. Signed on 2002-03-15. Completion date: 2002-09-15.
$31,250 with Offices, Boards and Divisions (includes Attorney General, Deputy Attorney General, etc.) for Legal Services. Taking place in DC. Signed on 2002-11-15. Completion date: 2003-10-15.
$29,500 with Offices, Boards and Divisions (includes Attorney General, Deputy Attorney General, etc.) for Expert Witness. Taking place in DC. Signed on 2005-07-27. Completion date: 2006-02-28.
$29,350, same as above.Signed on 2005-04-01. Completion date: 2006-11-30.
ZAC A DIBENDETTO (3725 INGLEWOOD BLVD.; small business) : $132,042 in 3 contractsin 2000
$92,274 with Air Force for Maintenance, Repair and Rebuilding of Equipment -- Aircraft and Airframe Structural Components. Signed on 2000-07-12. Completion date: 2000-10-27.
$28,068, same as above.Signed on 2000-07-12. Completion date: 2000-08-26.
$11,700 with Air Force for Maintenance, Repair or Alteration of Real Property -- Other Administrative Facilities and Service Buildings. Taking place in NM. Signed on 2000-05-19. Completion date: 2000-07-03.
GENERAL TRANSISTOR CORPORATION (5300 BEETHOVEN ST; small business) : $69,888 in 4 contractsfrom 2000 to 2005
$33,920 with Defense Logistics Agency for Microcircuits, Electronic. Signed on 2005-05-10. Completion date: 2005-06-13.
$25,110 with Defense Logistics Agency for Semiconductor Devices and Associated Hardware. Signed on 2000-11-30. Completion date: 2001-01-18.
$5,429 with Defense Logistics Agency for Microcircuits, Electronic. Signed on 2004-12-29. Completion date: 2005-02-03.
$5,429, same as above.Signed on 2004-12-29. Completion date: 2005-02-03.
SRS INDUSTRIES, INC (5419 MCCONNELL AVE; small business) : $17,207 in 4 contractsfrom 2002 to 2005
$8,900 with Army for ADP Support Equipment. Signed on 2004-11-23. Completion date: 2004-11-26.
$4,184 with Navy for Power and Hand Pumps. Signed on 2004-07-23. Completion date: 2004-08-12.
$3,738 with Navy for Miscellaneous Communication Equipment. Signed on 2002-12-13. Completion date: 2003-01-02.
$385 with Navy for Antennas, Waveguides, and Related Equipment. Signed on 2005-04-11. Completion date: 2005-10-04.
IMPATH INC (5300 MCCONNELL AVENUE; small business)
$15,000 with Army for Laboratory Testing Services. Signed on 2003-11-18. Completion date: 2004-09-30.
Top industries in this zip code by the number of employees in 2005:
2005 - 2018 National Fire Incident Reporting System (NFIRS) incidents
Based on the data from the years 2005 - 2018 the average number of fire incidents per year is 61. The highest number of fire incidents - 84 took place in 2007, and the least - 35 in 2016. The data has a dropping trend.
When looking into fire subcategories, the most reports belonged to: Structure Fires (49.8%), and Outside Fires (23.3%).
Fire incident types reported to NFIRS in Zip Code 90066


+$1,000
-$7,562
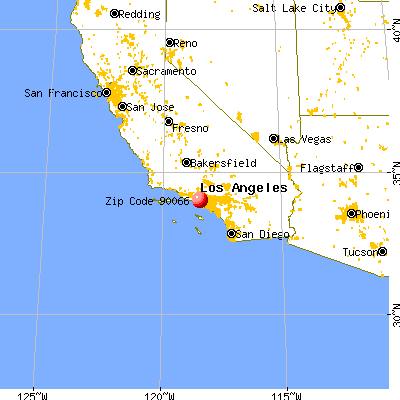
 Nearest zip codes: 90094, 90291, 90292, 90064, 90230, 90405.
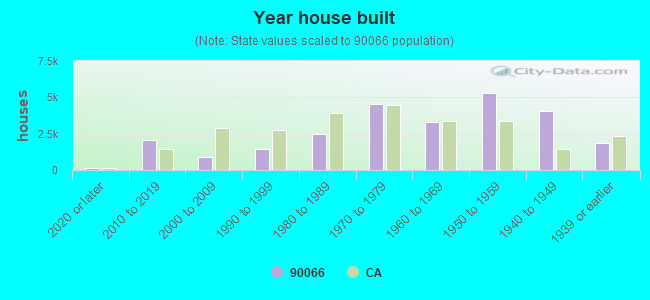


 Based on the data from the years 2005 - 2018 the average number of fire incidents per year is 61. The highest number of fire incidents - 84 took place in 2007, and the least - 35 in 2016. The data has a dropping trend.
 When looking into fire subcategories, the most reports belonged to: Structure Fires (49.8%), and Outside Fires (23.3%).