Estimated zip code population in 2022: 25,442 Zip code population in 2010: 28,341 Zip code population in 2000: 31,018
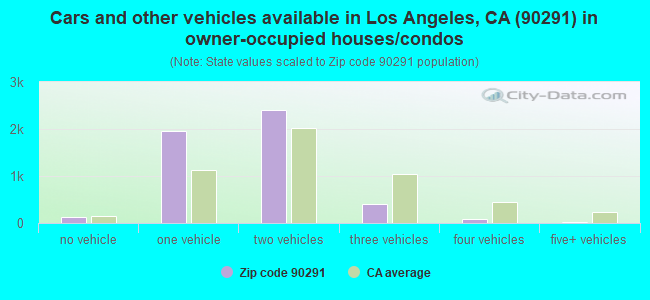
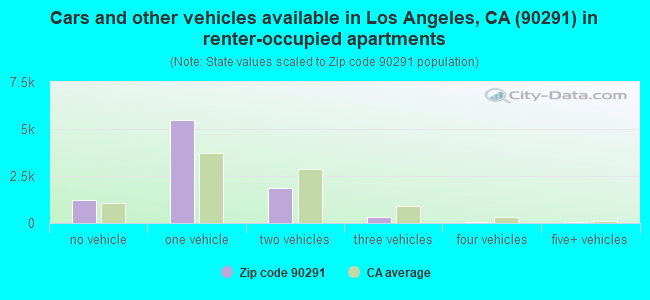
Houses and condos: 16,573 Renter-occupied apartments: 8,920
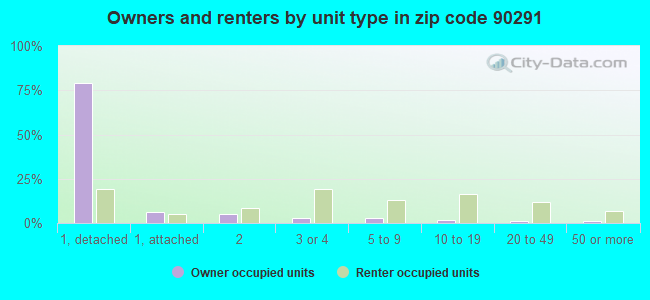
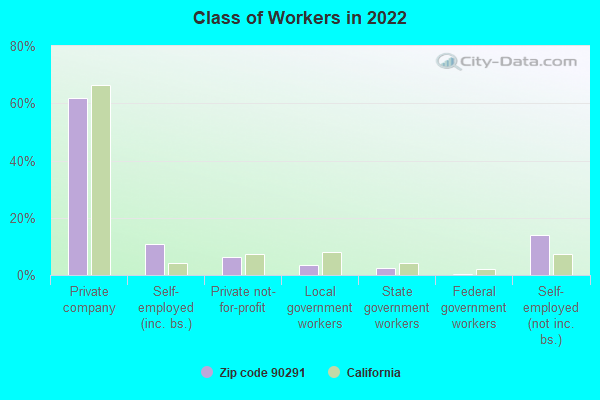
% of renters here:
64%
State:
44%
March 2022 cost of living index in zip code 90291: 153.6 (very high, U.S. average is 100)
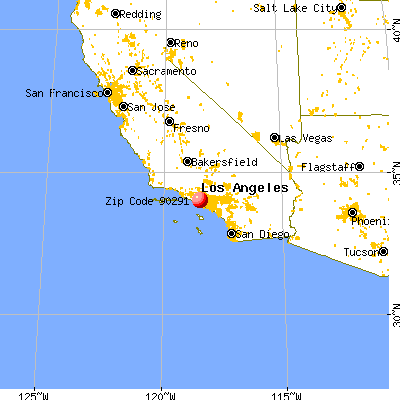
Land area: 2.5 sq. mi. Water area: 0.3 sq. mi.
Population density: 10,187 people per square mile
(high).
OSM Map
General Map
Google Map
MSN Map
OSM Map
General Map
Google Map
MSN Map
OSM Map
General Map
Google Map
MSN Map
OSM Map
General Map
Google Map
MSN Map
Please wait while loading the map...
Real estate property taxes paid for housing units in 2022:
This zip code:
0.5% ($10,258)
California:
0.7% ($4,831)
Median real estate property taxes paid for housing units with mortgages in 2022: $10,330 (0.5%) Median real estate property taxes paid for housing units with no mortgage in 2022: $6,246 (0.3%)
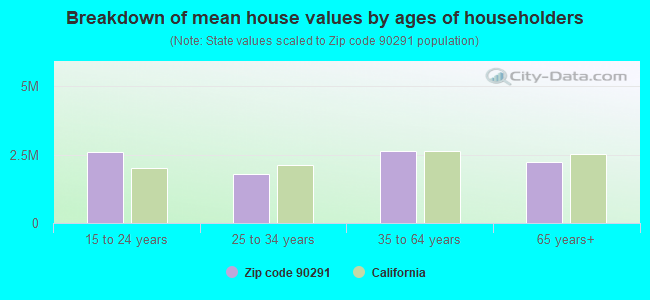
Estimated median house/condo value in 2022: $2,171,698
90291:
$2,171,698
California:
$715,900
According to our research of California and other state lists, there were 12 registered sex offenders living in 90291 zip code as of April 27, 2024. The ratio of all residents to sex offenders in zip code 90291 is 2,306 to 1. The ratio of registered sex offenders to all residents in this zip code is much lower than the state average.
Median resident age:
This zip code:
40.2 years
California median age:
37.9 years
Average household size:
This zip code:
1.8 people
California:
2.8 people
Averages for the 2020 tax year for zip code 90291, filed in 2021:
Average Adjusted Gross Income (AGI) in 2020: $163,135 (Individual Income Tax Returns)
Here:
$163,135
State:
$95,910
Salary/wage: $130,233 (reported on 76.3% of returns)
Here:
$130,233
State:
$77,331
(% of AGI for various income ranges: 1046.6% for AGIs below $25k, 3936.5% for AGIs $25k-50k, 7804.3% for AGIs $50k-75k, 11745.7% for AGIs $75k-100k, 21476.5% for AGIs $100k-200k, 166677.4% for AGIs over 200k)
Taxable interest for individuals: $3,960 (reported on 38.9% of returns)
This zip code:
$3,960
California:
$2,294
(% of AGI for various income ranges: 34.6% for AGIs below $25k, 44.9% for AGIs $25k-50k, 67.2% for AGIs $50k-75k, 86.9% for AGIs $75k-100k, 223.5% for AGIs $100k-200k, 3088.3% for AGIs over 200k)
Ordinary dividends: $12,174 (reported on 35.6% of returns)
Here:
$12,174
State:
$10,949
(% of AGI for various income ranges: 79.4% for AGIs below $25k, 170.2% for AGIs $25k-50k, 207.7% for AGIs $50k-75k, 376.9% for AGIs $75k-100k, 651.7% for AGIs $100k-200k, 8323.0% for AGIs over 200k)
Net capital gain/loss in AGI: +$77,953 (reported on 35.4% of returns)
Here:
+$77,953
State:
+$49,306
(% of AGI for various income ranges: 64.5% for AGIs below $25k, 131.0% for AGIs $25k-50k, 228.9% for AGIs $50k-75k, 353.2% for AGIs $75k-100k, 1163.2% for AGIs $100k-200k, 69867.4% for AGIs over 200k)
Profit/loss from business: +$19,629 (reported on 29.5% of returns)
Here:
+$19,629
State:
+$15,671
(% of AGI for various income ranges: 344.4% for AGIs below $25k, 578.4% for AGIs $25k-50k, 739.0% for AGIs $50k-75k, 832.5% for AGIs $75k-100k, 1470.7% for AGIs $100k-200k, 6412.3% for AGIs over 200k)
Taxable individual retirement arrangement distribution: $23,207 (reported on 6.0% of returns)
90291:
$23,207
California:
$23,505
(% of AGI for various income ranges: 42.1% for AGIs below $25k, 77.7% for AGIs $25k-50k, 158.9% for AGIs $50k-75k, 201.4% for AGIs $75k-100k, 518.8% for AGIs $100k-200k, 1468.3% for AGIs over 200k)
Self-employed (Keogh) retirement plans: $29,374 (reported on 2.2% of returns)
90291:
$29,374
California:
$30,163
(% of AGI for various income ranges: 13.8% for AGIs $25k-50k, 40.1% for AGIs $50k-75k, 149.2% for AGIs $100k-200k, 1232.8% for AGIs over 200k)
Total itemized deductions: $46,241 (reported on 17.4% of returns)
Here:
$46,241
State:
$39,517
(% of AGI for various income ranges: 162.6% for AGIs below $25k, 301.3% for AGIs $25k-50k, 571.2% for AGIs $50k-75k, 819.9% for AGIs $75k-100k, 1607.9% for AGIs $100k-200k, 13916.8% for AGIs over 200k)
Charity contributions: $18,823 (reported on 14.6% of returns)
Here:
$18,823
State:
$12,598
(% of AGI for various income ranges: 6.8% for AGIs below $25k, 22.5% for AGIs $25k-50k, 55.5% for AGIs $50k-75k, 87.0% for AGIs $75k-100k, 237.0% for AGIs $100k-200k, 6481.9% for AGIs over 200k)
Taxes paid: $8,899 (reported on 17.3% of returns)
90291:
$8,899
State:
$8,807
(% of AGI for various income ranges: 33.1% for AGIs below $25k, 59.9% for AGIs $25k-50k, 131.0% for AGIs $50k-75k, 225.5% for AGIs $75k-100k, 450.0% for AGIs $100k-200k, 2166.0% for AGIs over 200k)
Earned income credit: $1,200 (reported on 8.4% of returns)
Here:
$1,200
State:
$2,074
(% of AGI for various income ranges: 53.6% for AGIs below $25k, 29.6% for AGIs $25k-50k)
Percentage of individuals using paid preparers for their 2020 taxes: 93.1%
Here:
93%
State:
92%
(% for various income ranges: 89.3% for AGIs below $25k, 92.5% for AGIs $25k-50k, 93.4% for AGIs $50k-75k, 93.4% for AGIs $75k-100k, 95.5% for AGIs $100k-200k, 96.4% for AGIs over 200k)
Averages for the 2012 tax year for zip code 90291, filed in 2013:
Average Adjusted Gross Income (AGI) in 2012: $107,681 (Individual Income Tax Returns)
Here:
$107,681
State:
$72,726
Salary/wage: $81,883 (reported on 79.6% of returns)
Here:
$81,883
State:
$59,079
(% of AGI for various income ranges: 64.5% for AGIs below $25k, 77.5% for AGIs $25k-50k, 79.4% for AGIs $50k-75k, 77.9% for AGIs $75k-100k, 75.4% for AGIs $100k-200k, 47.7% for AGIs over 200k)
Taxable interest for individuals: $2,605 (reported on 38.6% of returns)
This zip code:
$2,605
California:
$2,146
(% of AGI for various income ranges: 1.8% for AGIs below $25k, 0.7% for AGIs $25k-50k, 0.6% for AGIs $50k-75k, 1.0% for AGIs $75k-100k, 0.9% for AGIs $100k-200k, 1.0% for AGIs over 200k)
Ordinary dividends: $9,329 (reported on 27.4% of returns)
Here:
$9,329
State:
$9,308
(% of AGI for various income ranges: 2.8% for AGIs below $25k, 1.5% for AGIs $25k-50k, 1.7% for AGIs $50k-75k, 1.8% for AGIs $75k-100k, 2.2% for AGIs $100k-200k, 2.7% for AGIs over 200k)
Net capital gain/loss in AGI: +$36,209 (reported on 25.2% of returns)
Here:
+$36,209
State:
+$30,460
(% of AGI for various income ranges: 0.2% for AGIs below $25k, 0.7% for AGIs $25k-50k, 0.5% for AGIs $50k-75k, 1.4% for AGIs $75k-100k, 2.6% for AGIs $100k-200k, 14.3% for AGIs over 200k)
Profit/loss from business: +$17,171 (reported on 32.7% of returns)
Here:
+$17,171
State:
+$17,064
(% of AGI for various income ranges: 21.2% for AGIs below $25k, 9.7% for AGIs $25k-50k, 8.4% for AGIs $50k-75k, 6.4% for AGIs $75k-100k, 6.0% for AGIs $100k-200k, 2.6% for AGIs over 200k)
Taxable individual retirement arrangement distribution: $19,600 (reported on 6.0% of returns)
90291:
$19,600
California:
$19,557
(% of AGI for various income ranges: 2.1% for AGIs below $25k, 1.5% for AGIs $25k-50k, 1.6% for AGIs $50k-75k, 1.8% for AGIs $75k-100k, 1.5% for AGIs $100k-200k, 0.7% for AGIs over 200k)
Self-employment retirement plans: $22,579 (reported on 2.3% of returns)
90291:
$22,579
California:
$24,530
(% of AGI for various income ranges: 0.3% for AGIs $25k-50k, 0.5% for AGIs $50k-75k, 0.4% for AGIs $75k-100k, 0.6% for AGIs $100k-200k, 0.5% for AGIs over 200k)
Total itemized deductions: $38,714 (19% of AGI, reported on 43.2% of returns)
Here:
$38,714
State:
$34,004
Here:
19.0% of AGI
State:
22.7% of AGI
(% of AGI for various income ranges: 15.9% for AGIs below $25k, 10.4% for AGIs $25k-50k, 14.0% for AGIs $50k-75k, 15.9% for AGIs $75k-100k, 18.9% for AGIs $100k-200k, 15.2% for AGIs over 200k)
Charity contributions: $3,643 (reported on 34.8% of returns)
Here:
$3,643
State:
$4,659
(% of AGI for various income ranges: 0.7% for AGIs below $25k, 0.9% for AGIs $25k-50k, 1.1% for AGIs $50k-75k, 1.1% for AGIs $75k-100k, 1.3% for AGIs $100k-200k, 1.2% for AGIs over 200k)
Taxes paid: $19,272 (reported on 43.0% of returns)
90291:
$19,272
State:
$14,448
(% of AGI for various income ranges: 3.3% for AGIs below $25k, 2.5% for AGIs $25k-50k, 4.0% for AGIs $50k-75k, 6.3% for AGIs $75k-100k, 8.7% for AGIs $100k-200k, 9.0% for AGIs over 200k)
Earned income credit: $1,334 (reported on 11.2% of returns)
Here:
$1,334
State:
$2,286
(% of AGI for various income ranges: 3.2% for AGIs below $25k, 0.3% for AGIs $25k-50k)
Percentage of individuals using paid preparers for their 2012 taxes: 67.4%
Here:
67%
State:
64%
(% for various income ranges: 62.9% for AGIs below $25k, 61.0% for AGIs $25k-50k, 62.2% for AGIs $50k-75k, 69.4% for AGIs $75k-100k, 76.7% for AGIs $100k-200k, 88.8% for AGIs over 200k)
Averages for the 2004 tax year for zip code 90291, filed in 2005:
Average Adjusted Gross Income (AGI) in 2004: $62,372 (Individual Income Tax Returns)
Here:
$62,372
State:
$58,600
Salary/wage: $56,327 (reported on 80.8% of returns)
Here:
$56,327
State:
$49,455
(% of AGI for various income ranges: 76.0% for AGIs $10k-25k, 83.7% for AGIs $25k-50k, 83.2% for AGIs $50k-75k, 83.1% for AGIs $75k-100k, 63.7% for AGIs over 100k)
Taxable interest for individuals: $2,116 (reported on 45.4% of returns)
This zip code:
$2,116
California:
$2,365
(% of AGI for various income ranges: 1.8% for AGIs $10k-25k, 1.3% for AGIs $25k-50k, 1.3% for AGIs $50k-75k, 1.0% for AGIs $75k-100k, 1.5% for AGIs over 100k)
Taxable dividends: $3,777 (reported on 27.4% of returns)
Here:
$3,777
State:
$4,746
(% of AGI for various income ranges: 1.4% for AGIs $10k-25k, 1.1% for AGIs $25k-50k, 1.4% for AGIs $50k-75k, 1.3% for AGIs $75k-100k, 1.8% for AGIs over 100k)
Net capital gain/loss: +$18,492 (reported on 24.7% of returns)
Here:
+$18,492
State:
+$23,418
(% of AGI for various income ranges: -0.0% for AGIs $10k-25k, 0.8% for AGIs $25k-50k, 0.7% for AGIs $50k-75k, 2.0% for AGIs $75k-100k, 12.4% for AGIs over 100k)
Profit/loss from business: +$11,940 (reported on 32.0% of returns)
Here:
+$11,940
State:
+$16,826
(% of AGI for various income ranges: 13.8% for AGIs $10k-25k, 7.6% for AGIs $25k-50k, 5.6% for AGIs $50k-75k, 5.4% for AGIs $75k-100k, 4.8% for AGIs over 100k)
IRA payment deduction: $2,753 (reported on 4.0% of returns)
90291:
$2,753
California:
$3,192
(% of AGI for various income ranges: 0.3% for AGIs $10k-25k, 0.3% for AGIs $25k-50k, 0.2% for AGIs $50k-75k, 0.2% for AGIs $75k-100k, 0.1% for AGIs over 100k)
Self-employed pension: $15,654 (reported on 2.7% of returns)
Here:
$15,654
California:
$17,688
(% of AGI for various income ranges: 0.4% for AGIs $10k-25k, 0.4% for AGIs $25k-50k, 0.4% for AGIs $50k-75k, 0.5% for AGIs $75k-100k, 0.9% for AGIs over 100k)
Total itemized deductions: $26,396 (22% of AGI, reported on 40.8% of returns)
Here:
$26,396
State:
$28,113
Here:
22.4% of AGI
State:
25.3% of AGI
(% of AGI for various income ranges: 12.7% for AGIs $10k-25k, 14.7% for AGIs $25k-50k, 19.0% for AGIs $50k-75k, 20.7% for AGIs $75k-100k, 16.8% for AGIs over 100k)
Charity contributions deductions: $2,630 (2% of AGI, reported on 35.8% of returns)
Here:
$2,630
State:
$3,923
Here:
2.2% of AGI
State:
3.3% of AGI
(% of AGI for various income ranges: 1.0% for AGIs $10k-25k, 1.3% for AGIs $25k-50k, 1.8% for AGIs $50k-75k, 1.7% for AGIs $75k-100k, 1.5% for AGIs over 100k)
Total tax: $12,589 (reported on 82.4% of returns)
90291:
$12,589
State:
$10,761
(% of AGI for various income ranges: 6.0% for AGIs $10k-25k, 9.6% for AGIs $25k-50k, 12.2% for AGIs $50k-75k, 13.6% for AGIs $75k-100k, 21.0% for AGIs over 100k)
Earned income credit: $1,096 (reported on 11.7% of returns)
Here:
$1,096
State:
$1,763
Percentage of individuals using paid preparers for their 2004 taxes: 69.7%
Here:
70%
State:
66%
(% for various income ranges: 62.6% for AGIs below $10k, 66.4% for AGIs $10k-25k, 66.5% for AGIs $25k-50k, 71.6% for AGIs $50k-75k, 77.9% for AGIs $75k-100k, 83.3% for AGIs over 100k)
Likely homosexual households (counted as self-reported same-sex unmarried-partner households)
Lesbian couples: 0.0% of all households
Gay men: 0.4% of all households
Household received Food Stamps/SNAP in the past 12 months: 591 Household did not receive Food Stamps/SNAP in the past 12 months: 13,067
Women who had a birth in the past 12 months: 242 (212 now married, 29 unmarried) Women who did not have a birth in the past 12 months: 7,342 (1,953 now married, 5,429 unmarried)
Housing units in zip code 90291 with a mortgage: 3,484 (445 second mortgage, 72 home equity loan, 358 both second mortgage and home equity loan) Houses without a mortgage: 43
Median monthly owner costs for units with a mortgage: $3,876 Median monthly owner costs for units without a mortgage: $1,105
Residents with income below the poverty level in 2022:
This zip code:
9.9%
Whole state:
12.2%
Residents with income below 50% of the poverty level in 2022:
This zip code:
4.1%
Whole state:
6.2%
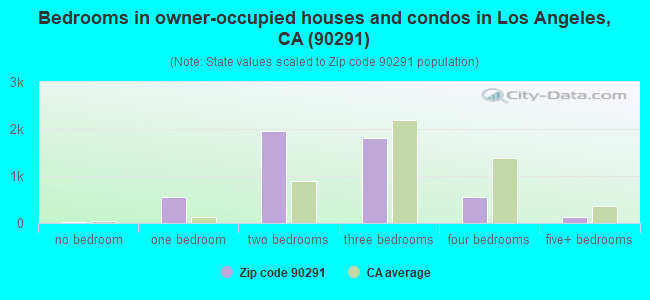
Median number of rooms in houses and condos:
Here:
5.4
State:
6.0
Median number of rooms in apartments:
Here:
3.3
State:
3.9
Notable locations in this zip code not listed on our city pages
Notable locations in zip code 90291: Department of Water and Power Sub-Station Number 44 (A), Venice Pier (B), Penmar Golf Course (C), Venice-Abbot Kinney Memorial Branch Los Angeles Public Library (D), Venice City Hall (E), Venice Pavilion (F), Los Angeles County Fire Department Lifeguard Division Ambulance (G), Vera Davis McClendon Youth And Family Center (H), Beyond Baroque Literary/Arts Center (I), Venice Renaissance Building (J), City of Los Angeles Fire Department Station 63 (K), Venice Police Station (L). Display/hide their locations on the map
Churches in zip code 90291 include: First Baptist Church of Venice (A), First Lutheran Church of Venice (B), First Methodist Church of Venice (C), Marina Baptist Church (D), New Bethel Baptist Church (E), Twentieth Church of Christ Scientist (F), Venice Baptist Church (G), Venice Foursquare Church (H), Venice Church of Christ (I). Display/hide their locations on the map
Parks in zip code 90291 include: Kinney Plaza (1), Oakwood Playground (2), Penmar Recreation Center (3), Oakwood Recreation Center (4), Venice Recreation Center (5), Westminster Park (6), Venice Canal Historic District (7). Display/hide their locations on the map
Tourist attraction (not listed on the city page) : Abner's International Golf (Arcades & Amusements; 2816 Pacific Avenue).
1,917 married couples with children.
847 single-parent households (361 men, 486 women).
72.1% of residents of 90291 zip code speak English at home.
13.5% of residents speak Spanish at home (77% very well, 8% well, 13% not well, 3% not at all).
10.7% of residents speak other Indo-European language at home (83% very well, 14% well, 3% not well).
2.3% of residents speak Asian or Pacific Island language at home (60% very well, 38% well, 2% not well).
1.2% of residents speak other language at home (87% very well, 13% well).
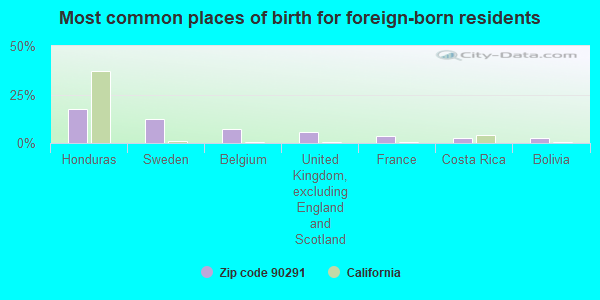
Foreign born population: 4,989 (19.6%) (45.2% of them are naturalized citizens)
This zip code:
19.6%
Whole state:
26.7%
17%Honduras
12%Sweden
7%Belgium
6%United Kingdom, excluding England and Scotland
4%France
3%Costa Rica
3%Bolivia
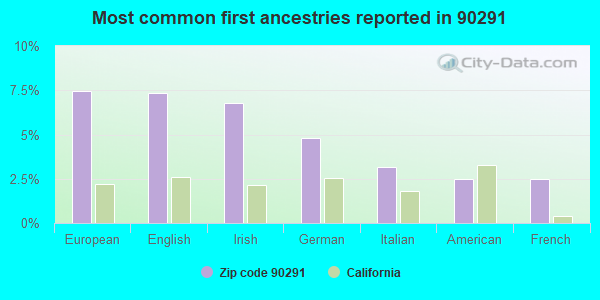
7%European
7%English
7%Irish
5%German
3%Italian
2%American
2%French
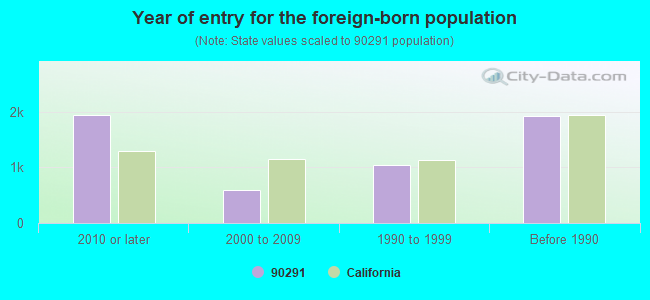
Year of entry for the foreign-born population
1,9362010 or later
5982000 to 2009
1,0471990 to 1999
1,932Before 1990
Major facilities with environmental interests located in this zip code:
CHEVRON STATION NO 95243 (2400 LINCOLN BLVD in VENICE, CA)
STATE MASTER (California - Hazardous Waste Tracking) - HAZARDOU WASTE PROGRAM Large Quantity Generators, more that 1000 kg of hazardous waste/month (Resource Conservation and Recovery Act (tracking hazardous waste)) Organizations: CHEVRON PRODUCTS CO. (CONTACT/OPERATOR)
Alternative names: CHEVRON 95243
FINAL TOUCH DRY CLEANERS (4008 LINCOLN BLVD in MARINA DEL REY, CA)
STATE MASTER (California - Hazardous Waste Tracking) - HAZARDOU WASTE PROGRAM Small Quantity Generators, between 100 kg and 1000 kg of hazardous waste/month (Resource Conservation and Recovery Act (tracking hazardous waste)) - notification Organizations: GEORGE CHAGHOURI (CONTACT/OWNER)
Alternative names: FINAL TOUCH LAUNDRIES
LA FIRE STATION 63 (1930 SHELL AVE in VENICE, CA)
STATE MASTER (California - Hazardous Waste Tracking) - HAZARDOU WASTE PROGRAM Small Quantity Generators, between 100 kg and 1000 kg of hazardous waste/month (Resource Conservation and Recovery Act (tracking hazardous waste)) - notification Organizations: CITY OF LA (CONTACT/OWNER)
Alternative names: CITY OF LA GENERAL SERVICES
LA USD BROADWAY EL (1015 LINCOLN BLVD in VENICE, CA)
STATE MASTER (California - Hazardous Waste Tracking) - HAZARDOU WASTE PROGRAM Small Quantity Generators, between 100 kg and 1000 kg of hazardous waste/month (Resource Conservation and Recovery Act (tracking hazardous waste)) - notification Alternative names: BROADWAY ELEMENTARY
LA COUNTY DEPT BEACHES & HARBORS (2300 OCEAN FRONT WALK in VENICE, CA)
STATE MASTER (California - Hazardous Waste Tracking) - HAZARDOU WASTE PROGRAM Small Quantity Generators, between 100 kg and 1000 kg of hazardous waste/month (Resource Conservation and Recovery Act (tracking hazardous waste))
NAYLORS PAINT (132 LINCOLN BLVD in VENICE, CA)
STATE MASTER (California - Hazardous Waste Tracking) - HAZARDOU WASTE PROGRAM Small Quantity Generators, between 100 kg and 1000 kg of hazardous waste/month (Resource Conservation and Recovery Act (tracking hazardous waste)) - notification Organizations: LAWRENCE NAYLOR (CONTACT/OWNER)
Alternative names: NAYLOR PAINT
ANIMO INGLEWOOD CHARTER HIGH (304 EAST SPRUCE STREET in VENICE, CA)
(National Center for Education Statistics) - STATE ID-1996586 Organizations: STATE BOARD OF EDUCATION (SCHOOL DISTRICT)
J E AUTOBODY (4065 1/2 GLENCOE AVE in MARINA DEL REY, CA)
Small Quantity Generators, between 100 kg and 1000 kg of hazardous waste/month (Resource Conservation and Recovery Act (tracking hazardous waste)) - notification Business NAICS classification: GENERAL AUTOMOTIVE REPAIR. Organizations: J E CORP JERRY ESPSTIEN (CONTACT/OWNER)
JACK SON AUTOMOTIVE (346RD AVE in VENICE, CA)
Small Quantity Generators, between 100 kg and 1000 kg of hazardous waste/month (Resource Conservation and Recovery Act (tracking hazardous waste)) - notification Business NAICS classification: GENERAL AUTOMOTIVE REPAIR. Organizations: MC NELLIS JACK (CONTACT/OWNER)
LA PUMPING PLANT #47 (100 WINDWARD ST in VENICE, CA)
Small Quantity Generators, between 100 kg and 1000 kg of hazardous waste/month (Resource Conservation and Recovery Act (tracking hazardous waste)) - notification Organizations: CITY OF LOS ANGELES (CONTACT/OWNER)
LA PUMPING PLANT #48 (346 CULVER BLVD in PLAYA DEL REY, CA)
Small Quantity Generators, between 100 kg and 1000 kg of hazardous waste/month (Resource Conservation and Recovery Act (tracking hazardous waste)) - notification Organizations: CITY OF LOS ANGELES (CONTACT/OWNER)
Housing units lacking complete plumbing facilities: 0.3% Housing units lacking complete kitchen facilities: 1.5%
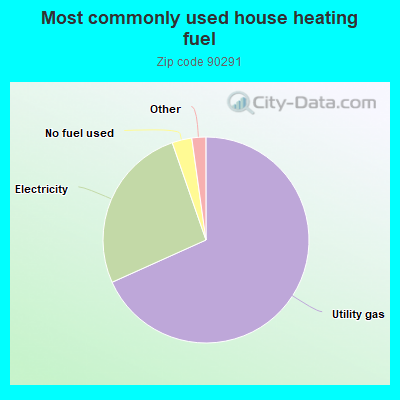
68.2%Utility gas
26.4%Electricity
3.1%No fuel used
1.0%Bottled, tank, or LP gas
0.5%Solar energy
Population in 1990: 32,987.
Place of birth for U.S.-born residents:
This state: 10,017
Northeast: 3,971
Midwest: 2,517
South: 2,144
West: 1,194
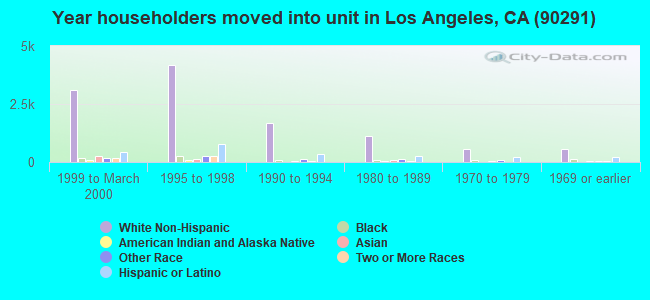
47% of the 90291 zip code residents lived in the same house 5 years ago. Out of people who lived in different houses, 64% lived in this county. Out of people who lived in different counties, 50% lived in California.
86% of the 90291 zip code residents lived in the same house 1 year ago. Out of people who lived in different houses, 58% moved from this county. Out of people who lived in different houses, 9% moved from different county within same state. Out of people who lived in different houses, 27% moved from different state. Out of people who lived in different houses, 6% moved from abroad.
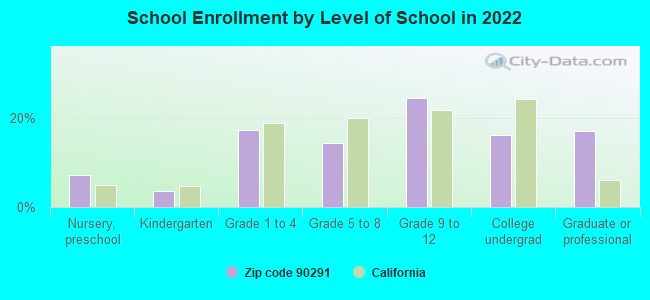
Private vs. public school enrollment:
Students in private schools in grades 1 to 8 (elementary and middle school): 348
Here:
31.0%
California:
10.5%
Students in private schools in grades 9 to 12 (high school): 148
Here:
17.4%
California:
8.5%
Students in private undergraduate colleges: 146
Here:
25.9%
California:
15.9%
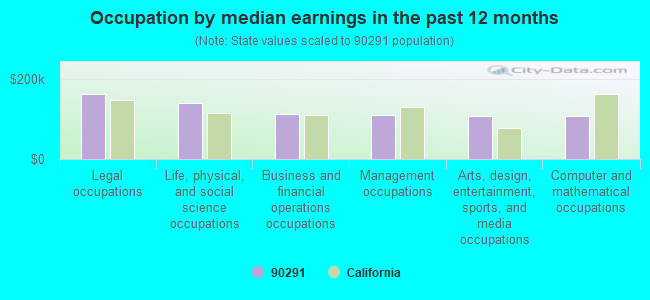
Occupation by median earnings in the past 12 months ($)
164,009Legal occupations
140,088Life, physical, and social science occupations
113,638Business and financial operations occupations
111,434Management occupations
108,055Arts, design, entertainment, sports, and media occupations
107,343Computer and mathematical occupations
Companies with federal contracts located in this zip code (VENICE, CA):
BOSSA NOVA TECHNOLOGIES LLC (606 VENICE BLVD; small business) : $583,669 in 4 contractsfrom 2005 to 2006
$364,775 with Army for Services -- Applied Research and Exploratory Development (R&D). Signed on 2006-02-06. Completion date: 2008-02-06.
$99,991 with NASA for Aeronautics and Space Technology -- Basic Research (R&D). Signed on 2006-01-27. Effective on 2006-01-20. Completion date: 2007-01-22.
$69,633 with Army for Defense Tank - Automotive -- Basic Research (R&D). Signed on 2005-01-24. Completion date: 2005-06-30.
$49,270, same as above.Signed on 2005-09-26. Completion date: 2006-01-31.
VOICE INTERNATIONAL INC (616 VENICE BLVD; small business) : $197,040 in 2 contractsfrom 2003 to 2006
$98,520 with Navy for Cameras, Still Picture. Signed on 2006-06-29. Completion date: 2006-07-14.
$98,520 with Navy for Photographic Equipment and Accessories. Signed on 2003-09-09. Completion date: 2003-09-30.
BLUESKY ROBOTICS (2621 ABBOTT KENNY BLVD; small business)
$98,000 with Army for Other Defense -- Applied Research and Exploratory Development (R&D). Signed on 2004-06-18. Completion date: 2005-02-21.
LINDA B BOURQUE (817 VENEZIA AVENUE; small business) : $59,998 in 2 contractsfrom 2000 to 2004
$60,000 with Navy for Program Management/Support Services. Signed on 2000-10-01. Completion date: 2000-09-27.
-$2 with Navy for Biomedical -- Engineering Development (R&D). Signed on 2004-04-01. Completion date: 2004-09-27.
Top industries in this zip code by the number of employees in 2005:
2005 - 2018 National Fire Incident Reporting System (NFIRS) incidents
According to the data from the years 2005 - 2018 the average number of fire incidents per year is 72. The highest number of fire incidents - 103 took place in 2010, and the least - 29 in 2012. The data has a declining trend.
When looking into fire subcategories, the most incidents belonged to: Structure Fires (57.9%), and Outside Fires (24.1%).
Fire incident types reported to NFIRS in Zip Code 90291


 Nearest zip codes: 90292, 90405, 90404, 90401, 90066, 90403.


 According to the data from the years 2005 - 2018 the average number of fire incidents per year is 72. The highest number of fire incidents - 103 took place in 2010, and the least - 29 in 2012. The data has a declining trend.
 When looking into fire subcategories, the most incidents belonged to: Structure Fires (57.9%), and Outside Fires (24.1%).