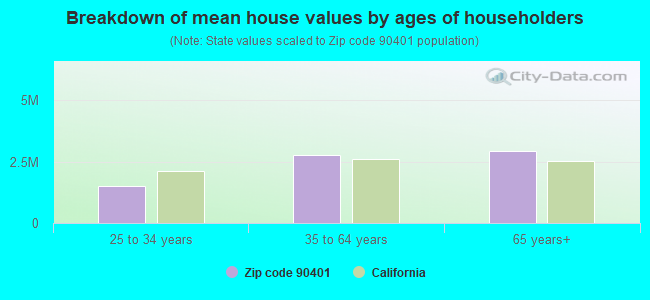
Estimated median house/condo value in 2022: $1,893,503
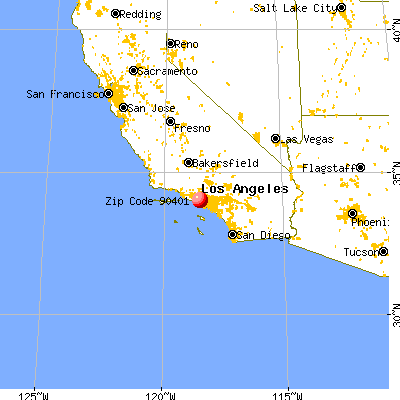
90401:
$1,893,503
California:
$715,900
According to our research of California and other state lists, there were 10 registered sex offenders living in 90401 zip code as of April 27, 2024. The ratio of all residents to sex offenders in zip code 90401 is 773 to 1. The ratio of registered sex offenders to all residents in this zip code is near the state average.
Median resident age:
This zip code:
40.4 years
California median age:
37.9 years
Average household size:
This zip code:
1.5 people
California:
2.8 people
Averages for the 2020 tax year for zip code 90401, filed in 2021:
Average Adjusted Gross Income (AGI) in 2020: $270,597 (Individual Income Tax Returns)
Here:
$270,597
State:
$95,910
Salary/wage: $119,728 (reported on 77.0% of returns)
Here:
$119,728
State:
$77,331
(% of AGI for various income ranges: 1003.2% for AGIs below $25k, 4196.7% for AGIs $25k-50k, 7497.8% for AGIs $50k-75k, 12123.7% for AGIs $75k-100k, 22484.8% for AGIs $100k-200k, 156178.0% for AGIs over 200k)
Taxable interest for individuals: $14,796 (reported on 36.1% of returns)
This zip code:
$14,796
California:
$2,294
(% of AGI for various income ranges: 37.4% for AGIs below $25k, 47.9% for AGIs $25k-50k, 59.5% for AGIs $50k-75k, 63.7% for AGIs $75k-100k, 149.6% for AGIs $100k-200k, 15528.0% for AGIs over 200k)
Ordinary dividends: $17,997 (reported on 31.8% of returns)
Here:
$17,997
State:
$10,949
(% of AGI for various income ranges: 61.4% for AGIs below $25k, 191.2% for AGIs $25k-50k, 178.2% for AGIs $50k-75k, 247.7% for AGIs $75k-100k, 484.6% for AGIs $100k-200k, 14486.7% for AGIs over 200k)
Net capital gain/loss in AGI: +$273,937 (reported on 34.0% of returns)
Here:
+$273,937
State:
+$49,306
(% of AGI for various income ranges: 34.2% for AGIs below $25k, 251.9% for AGIs $25k-50k, 194.5% for AGIs $50k-75k, 300.7% for AGIs $75k-100k, 755.2% for AGIs $100k-200k, 284241.3% for AGIs over 200k)
Profit/loss from business: +$23,269 (reported on 27.1% of returns)
Here:
+$23,269
State:
+$15,671
(% of AGI for various income ranges: 290.8% for AGIs below $25k, 473.5% for AGIs $25k-50k, 639.8% for AGIs $50k-75k, 521.3% for AGIs $75k-100k, 1059.6% for AGIs $100k-200k, 10930.7% for AGIs over 200k)
Taxable individual retirement arrangement distribution: $22,458 (reported on 5.2% of returns)
90401:
$22,458
California:
$23,505
(% of AGI for various income ranges: 37.5% for AGIs below $25k, 81.4% for AGIs $25k-50k, 121.2% for AGIs $50k-75k, 164.7% for AGIs $75k-100k, 279.1% for AGIs $100k-200k, 1688.7% for AGIs over 200k)
Self-employed (Keogh) retirement plans: $23,825 (reported on 1.7% of returns)
90401:
$23,825
California:
$30,163
(% of AGI for various income ranges: 93.8% for AGIs $50k-75k, 1020.7% for AGIs over 200k)
Total itemized deductions: $68,972 (reported on 12.5% of returns)
Here:
$68,972
State:
$39,517
(% of AGI for various income ranges: 280.5% for AGIs $25k-50k, 450.8% for AGIs $50k-75k, 580.0% for AGIs $75k-100k, 917.2% for AGIs $100k-200k, 20690.7% for AGIs over 200k)
Charity contributions: $33,002 (reported on 10.5% of returns)
Here:
$33,002
State:
$12,598
(% of AGI for various income ranges: 30.9% for AGIs $25k-50k, 56.0% for AGIs $50k-75k, 96.7% for AGIs $75k-100k, 160.9% for AGIs $100k-200k, 9856.0% for AGIs over 200k)
Taxes paid: $8,859 (reported on 12.5% of returns)
90401:
$8,859
State:
$8,807
(% of AGI for various income ranges: 60.9% for AGIs $25k-50k, 82.5% for AGIs $50k-75k, 120.7% for AGIs $75k-100k, 299.3% for AGIs $100k-200k, 1871.3% for AGIs over 200k)
Earned income credit: $1,217 (reported on 8.8% of returns)
Here:
$1,217
State:
$2,074
(% of AGI for various income ranges: 51.5% for AGIs below $25k, 38.1% for AGIs $25k-50k)
Percentage of individuals using paid preparers for their 2020 taxes: 93.5%
Here:
94%
State:
92%
(% for various income ranges: 89.2% for AGIs below $25k, 93.2% for AGIs $25k-50k, 93.7% for AGIs $50k-75k, 96.0% for AGIs $75k-100k, 95.5% for AGIs $100k-200k, 97.1% for AGIs over 200k)
Averages for the 2012 tax year for zip code 90401, filed in 2013:
Average Adjusted Gross Income (AGI) in 2012: $185,986 (Individual Income Tax Returns)
Here:
$185,986
State:
$72,726
Salary/wage: $119,544 (reported on 80.6% of returns)
Here:
$119,544
State:
$59,079
(% of AGI for various income ranges: 69.8% for AGIs below $25k, 79.0% for AGIs $25k-50k, 83.0% for AGIs $50k-75k, 84.8% for AGIs $75k-100k, 80.9% for AGIs $100k-200k, 41.0% for AGIs over 200k)
Taxable interest for individuals: $23,246 (reported on 39.7% of returns)
This zip code:
$23,246
California:
$2,146
(% of AGI for various income ranges: 1.8% for AGIs below $25k, 0.6% for AGIs $25k-50k, 0.5% for AGIs $50k-75k, 0.9% for AGIs $75k-100k, 0.7% for AGIs $100k-200k, 6.5% for AGIs over 200k)
Ordinary dividends: $21,506 (reported on 28.2% of returns)
Here:
$21,506
State:
$9,308
(% of AGI for various income ranges: 3.8% for AGIs below $25k, 1.5% for AGIs $25k-50k, 1.1% for AGIs $50k-75k, 0.8% for AGIs $75k-100k, 1.5% for AGIs $100k-200k, 3.9% for AGIs over 200k)
Net capital gain/loss in AGI: +$163,204 (reported on 26.6% of returns)
Here:
+$163,204
State:
+$30,460
(% of AGI for various income ranges: 0.6% for AGIs $25k-50k, 0.6% for AGIs $50k-75k, 1.1% for AGIs $75k-100k, 2.3% for AGIs $100k-200k, 31.5% for AGIs over 200k)
Profit/loss from business: +$24,081 (reported on 26.6% of returns)
Here:
+$24,081
State:
+$17,064
(% of AGI for various income ranges: 17.0% for AGIs below $25k, 12.6% for AGIs $25k-50k, 7.8% for AGIs $50k-75k, 4.5% for AGIs $75k-100k, 6.7% for AGIs $100k-200k, 1.7% for AGIs over 200k)
Taxable individual retirement arrangement distribution: $42,145 (reported on 5.3% of returns)
90401:
$42,145
California:
$19,557
(% of AGI for various income ranges: 2.4% for AGIs below $25k, 1.6% for AGIs $25k-50k, 2.5% for AGIs $50k-75k, 1.0% for AGIs $100k-200k, 1.1% for AGIs over 200k)
Self-employment retirement plans: $32,433 (reported on 1.4% of returns)
90401:
$32,433
California:
$24,530
(% of AGI for various income ranges: 0.8% for AGIs $25k-50k, 0.8% for AGIs $100k-200k, 0.2% for AGIs over 200k)
Total itemized deductions: $70,867 (18% of AGI, reported on 41.1% of returns)
Here:
$70,867
State:
$34,004
Here:
17.9% of AGI
State:
22.7% of AGI
(% of AGI for various income ranges: 14.2% for AGIs below $25k, 8.5% for AGIs $25k-50k, 10.2% for AGIs $50k-75k, 11.3% for AGIs $75k-100k, 13.7% for AGIs $100k-200k, 17.1% for AGIs over 200k)
Charity contributions: $21,766 (reported on 30.6% of returns)
Here:
$21,766
State:
$4,659
(% of AGI for various income ranges: 0.7% for AGIs below $25k, 0.8% for AGIs $25k-50k, 1.1% for AGIs $50k-75k, 1.0% for AGIs $75k-100k, 1.1% for AGIs $100k-200k, 4.5% for AGIs over 200k)
Taxes paid: $47,457 (reported on 40.9% of returns)
90401:
$47,457
State:
$14,448
(% of AGI for various income ranges: 2.6% for AGIs below $25k, 1.8% for AGIs $25k-50k, 2.9% for AGIs $50k-75k, 5.1% for AGIs $75k-100k, 7.7% for AGIs $100k-200k, 12.4% for AGIs over 200k)
Earned income credit: $1,149 (reported on 9.3% of returns)
Here:
$1,149
State:
$2,286
(% of AGI for various income ranges: 2.6% for AGIs below $25k, 0.2% for AGIs $25k-50k)
Percentage of individuals using paid preparers for their 2012 taxes: 58.1%
Here:
58%
State:
64%
(% for various income ranges: 52.9% for AGIs below $25k, 55.3% for AGIs $25k-50k, 52.3% for AGIs $50k-75k, 58.5% for AGIs $75k-100k, 63.5% for AGIs $100k-200k, 79.1% for AGIs over 200k)
Averages for the 2004 tax year for zip code 90401, filed in 2005:
Average Adjusted Gross Income (AGI) in 2004: $153,391 (Individual Income Tax Returns)
Here:
$153,391
State:
$58,600
Salary/wage: $80,879 (reported on 76.9% of returns)
Here:
$80,879
State:
$49,455
(% of AGI for various income ranges: 70.1% for AGIs $10k-25k, 82.7% for AGIs $25k-50k, 81.8% for AGIs $50k-75k, 81.3% for AGIs $75k-100k, 30.7% for AGIs over 100k)
Taxable interest for individuals: $12,522 (reported on 47.7% of returns)
This zip code:
$12,522
California:
$2,365
(% of AGI for various income ranges: 3.8% for AGIs $10k-25k, 2.0% for AGIs $25k-50k, 1.9% for AGIs $50k-75k, 2.1% for AGIs $75k-100k, 3.9% for AGIs over 100k)
Taxable dividends: $14,030 (reported on 30.6% of returns)
Here:
$14,030
State:
$4,746
(% of AGI for various income ranges: 3.2% for AGIs $10k-25k, 1.6% for AGIs $25k-50k, 0.6% for AGIs $50k-75k, 1.7% for AGIs $75k-100k, 3.0% for AGIs over 100k)
Net capital gain/loss: +$98,258 (reported on 29.0% of returns)
Here:
+$98,258
State:
+$23,418
(% of AGI for various income ranges: 0.5% for AGIs $10k-25k, 0.4% for AGIs $25k-50k, 1.3% for AGIs $50k-75k, 0.8% for AGIs $75k-100k, 21.8% for AGIs over 100k)
Profit/loss from business: +$22,716 (reported on 26.0% of returns)
Here:
+$22,716
State:
+$16,826
(% of AGI for various income ranges: 14.0% for AGIs $10k-25k, 9.9% for AGIs $25k-50k, 8.3% for AGIs $50k-75k, 9.2% for AGIs $75k-100k, 2.4% for AGIs over 100k)
IRA payment deduction: $3,121 (reported on 3.6% of returns)
90401:
$3,121
California:
$3,192
(% of AGI for various income ranges: 0.6% for AGIs $10k-25k, 0.4% for AGIs $25k-50k, 0.2% for AGIs $50k-75k, 0.2% for AGIs $75k-100k, 0.0% for AGIs over 100k)
Self-employed pension: $21,154 (reported on 2.5% of returns)
Here:
$21,154
California:
$17,688
(% of AGI for various income ranges: 0.3% for AGIs $25k-50k, 0.5% for AGIs $50k-75k, 0.8% for AGIs $75k-100k, 0.3% for AGIs over 100k)
Total itemized deductions: $65,666 (18% of AGI, reported on 38.8% of returns)
Here:
$65,666
State:
$28,113
Here:
18.3% of AGI
State:
25.3% of AGI
(% of AGI for various income ranges: 12.5% for AGIs $10k-25k, 11.1% for AGIs $25k-50k, 16.1% for AGIs $50k-75k, 19.7% for AGIs $75k-100k, 16.5% for AGIs over 100k)
Charity contributions deductions: $21,599 (5% of AGI, reported on 31.5% of returns)
Here:
$21,599
State:
$3,923
Here:
5.2% of AGI
State:
3.3% of AGI
(% of AGI for various income ranges: 1.0% for AGIs $10k-25k, 1.3% for AGIs $25k-50k, 1.5% for AGIs $50k-75k, 1.8% for AGIs $75k-100k, 5.0% for AGIs over 100k)
Total tax: $38,843 (reported on 83.8% of returns)
90401:
$38,843
State:
$10,761
(% of AGI for various income ranges: 6.7% for AGIs $10k-25k, 10.8% for AGIs $25k-50k, 13.8% for AGIs $50k-75k, 15.4% for AGIs $75k-100k, 22.6% for AGIs over 100k)
Earned income credit: $825 (reported on 9.1% of returns)
Here:
$825
State:
$1,763
Percentage of individuals using paid preparers for their 2004 taxes: 64.3%
Here:
64%
State:
66%
(% for various income ranges: 61.4% for AGIs below $10k, 61.1% for AGIs $10k-25k, 55.8% for AGIs $25k-50k, 64.7% for AGIs $50k-75k, 70.0% for AGIs $75k-100k, 79.6% for AGIs over 100k)
Likely homosexual households (counted as self-reported same-sex unmarried-partner households)
Lesbian couples: 0.2% of all households
Gay men: 0.7% of all households
Household received Food Stamps/SNAP in the past 12 months: 478 Household did not receive Food Stamps/SNAP in the past 12 months: 4,364
Women who had a birth in the past 12 months: 49 (9 now married, 40 unmarried) Women who did not have a birth in the past 12 months: 2,121 (497 now married, 1,637 unmarried)
Housing units in zip code 90401 with a mortgage: 240 (6 second mortgage) Median monthly owner costs for units with a mortgage: $3,876 Median monthly owner costs for units without a mortgage: $1,556
Residents with income below the poverty level in 2022:
This zip code:
19.5%
Whole state:
12.2%
Residents with income below 50% of the poverty level in 2022:
This zip code:
10.9%
Whole state:
6.2%
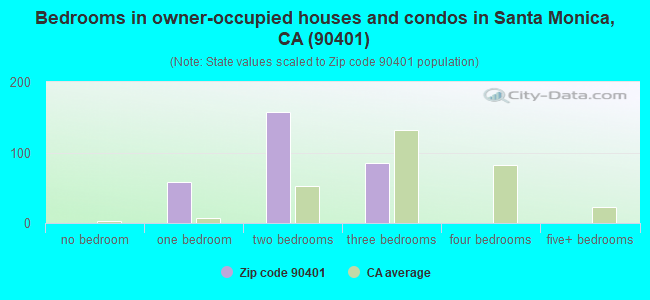
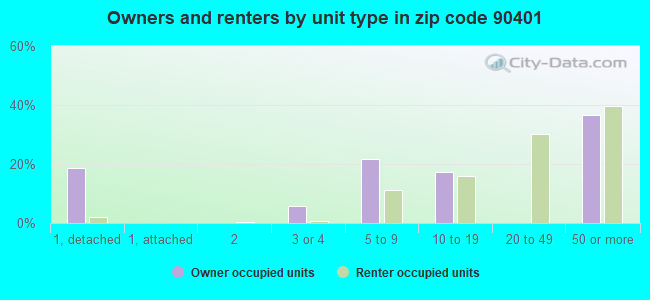
Median number of rooms in houses and condos:
Here:
4.4
State:
6.0
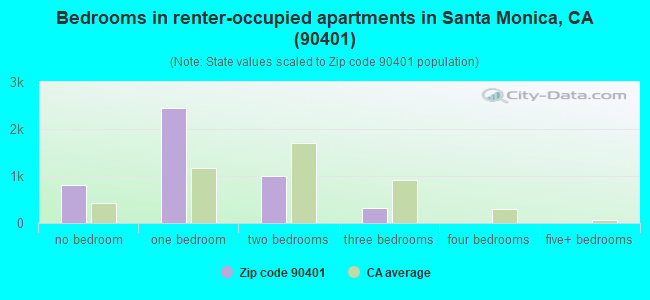
Median number of rooms in apartments:
Here:
2.7
State:
3.9
Notable locations in this zip code not listed on our city pages
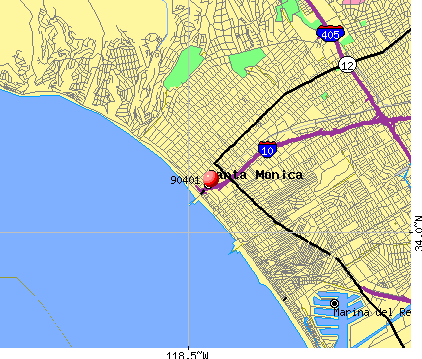
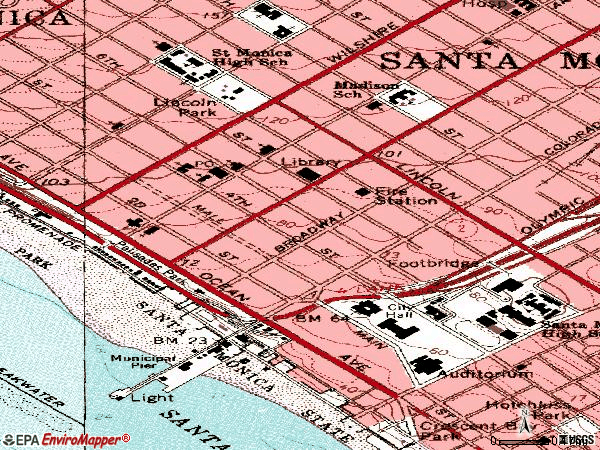
Notable locations in zip code 90401: Newcomb Pier (A), Santa Monica Looff Hippodrome (B), Municipal Pier (C), Santa Monica Civic Auditorium (D), Santa Monica Bay Womans Club (E), Edwards Community Center (F), Boys Club of Santa Monica (G), Barnum Hall (H), American Childrens Theatre (I), Santa Monica Public Library (J), Santa Monica City Hall (K), Angels Attic Museum (L), City of Santa Monica Fire Department Station 1 Headquarters (M). Display/hide their locations on the map
Churches in zip code 90401 include: First Church of Christ Scientist (A), First Christian Church (B), Church of Saint Augustine By-The-Sea (C). Display/hide their locations on the map
In group quarters: 200 (-1 institutionalized population)
Size of family households: 751 2-persons, 251 3-persons, 106 4-persons, 7 6-persons
Size of nonfamily households: 3,085 1-person, 740 2-persons, 19 3-persons
202 married couples with children.
106 single-parent households (87 men, 19 women).
75.3% of residents of 90401 zip code speak English at home.
4.9% of residents speak Spanish at home (82% very well, 18% well).
13.1% of residents speak other Indo-European language at home (66% very well, 20% well, 14% not well).
3.7% of residents speak Asian or Pacific Island language at home (58% very well, 41% well, 1% not well).
2.6% of residents speak other language at home (56% very well, 12% well, 32% not well).
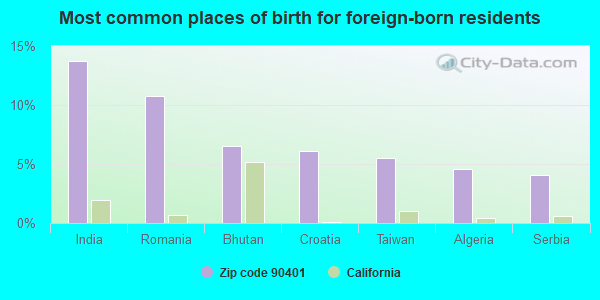
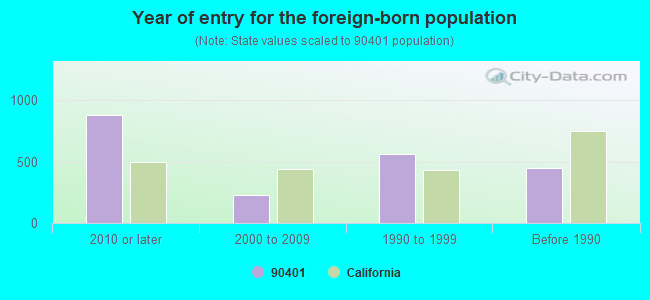
Foreign born population: 2,018 (27.2%) (60.8% of them are naturalized citizens)
Major facilities with environmental interests located in this zip code:
M2 COLLISION CENTER (1100 COLORADO BLVD in SANTA MONICA, CA)
AIR MINOR (AIRS/AFS) STATE MASTER (California - Hazardous Waste Tracking) - HAZARDOU WASTE PROGRAM Small Quantity Generators, between 100 kg and 1000 kg of hazardous waste/month (Resource Conservation and Recovery Act (tracking hazardous waste)) - notification Organizations: M2 AUTOMOTIVE INC (CONTACT/OWNER)
Alternative names: CALIBER COLLISION CENTERS, CALIBER ACQUI, M2 COLLISION CARE CENTERS, M2 COLLISION CTR SANTA MONICA
GLIDDEN COMPANY (928 SANTA MONICA BLVD in SANTA MONICA, CA)
STATE MASTER (California - Hazardous Waste Tracking) - HAZARDOU WASTE PROGRAM Small Quantity Generators, between 100 kg and 1000 kg of hazardous waste/month (Resource Conservation and Recovery Act (tracking hazardous waste)) - notification Alternative names: THE GLIDDEN CO. DBA ICI PAINTS
CHEVRON STATION 90716 (432 WILSHIRE BLVD in SANTA MONICA, CA)
STATE MASTER (California - Hazardous Waste Tracking) - HAZARDOU WASTE PROGRAM Small Quantity Generators, between 100 kg and 1000 kg of hazardous waste/month (Resource Conservation and Recovery Act (tracking hazardous waste)) - notification Organizations: CHEVRON PRODUCTS CO (CONTACT/OWNER)
EXXONMOBIL OIL CORP. (731 SANTA MONICA BLVD in SANTA MONICA, CA)
HAZARDOUS WASTE BIENNIAL REPORTER (Resource Conservation and Recovery Act (tracking hazardous waste)) Large Quantity Generators, more that 1000 kg of hazardous waste/month (Resource Conservation and Recovery Act (tracking hazardous waste)) Organizations: EXXONMOBIL OIL CORPORATION (CONTACT/OWNER)
LEN SHERIDAN TOYOTA (801 SANTA MONICA BLVD in SANTA MONICA, CA)
Large Quantity Generators, more that 1000 kg of hazardous waste/month (Resource Conservation and Recovery Act (tracking hazardous waste))
FROMEX PHOTO SYSTEMS (406 BROADWAY in SANTA MONICA, CA)
Small Quantity Generators, between 100 kg and 1000 kg of hazardous waste/month (Resource Conservation and Recovery Act (tracking hazardous waste)) - notification Organizations: TERRY L MEAD (CONTACT/OWNER)
HI MARK CO (1312 LINCOLN BLVD in SANTA MONICA, CA)
Small Quantity Generators, between 100 kg and 1000 kg of hazardous waste/month (Resource Conservation and Recovery Act (tracking hazardous waste)) - notification Organizations: SHEANIN STEVE (CONTACT/OWNER)
KEYSTONE BODY SHOP INC (631 CLORADO AVE in SANTA MONICA, CA)
Small Quantity Generators, between 100 kg and 1000 kg of hazardous waste/month (Resource Conservation and Recovery Act (tracking hazardous waste)) - notification Business NAICS classification: AUTOMOTIVE BODY, PAINT, AND INTERIOR REPAIR AND MAINTENANCE. Organizations: GEORGE NOJIMA (CONTACT/OWNER)
ALLSPORT USA INC (320 WILSHIRE BLVD UNIT 300 in SANTA MONICA, CA)
Small Quantity Generators, between 100 kg and 1000 kg of hazardous waste/month (Resource Conservation and Recovery Act (tracking hazardous waste)) - notification Organizations: STEVE POWELL (CONTACT/OWNER)
APEX FURNITURE (830 COLORADO AVE in SANTA MONICA, CA)
Small Quantity Generators, between 100 kg and 1000 kg of hazardous waste/month (Resource Conservation and Recovery Act (tracking hazardous waste)) - notification Organizations: BEVERLY HILLS TRANSFER AND STORAGE (CONTACT/OWNER)
F W WOOLWORTHS (1322 3RD ST in SANTA MONICA, CA)
Small Quantity Generators, between 100 kg and 1000 kg of hazardous waste/month (Resource Conservation and Recovery Act (tracking hazardous waste)) - notification
INFINITI OF SANTA MONICA (900 SANTA MONICA BLVD in SANTA MONICA, CA)
Small Quantity Generators, between 100 kg and 1000 kg of hazardous waste/month (Resource Conservation and Recovery Act (tracking hazardous waste)) - notification Organizations: WILLIAM ADKINS (CONTACT/OWNER)
LANDER CHIROPRACTIC CORP (1511 4TH ST in SANTA MONICA, CA)
Small Quantity Generators, between 100 kg and 1000 kg of hazardous waste/month (Resource Conservation and Recovery Act (tracking hazardous waste)) - notification Organizations: SCOTT LANDER (CONTACT/OWNER)
Housing units lacking complete plumbing facilities: 0.4% Housing units lacking complete kitchen facilities: 1.9%
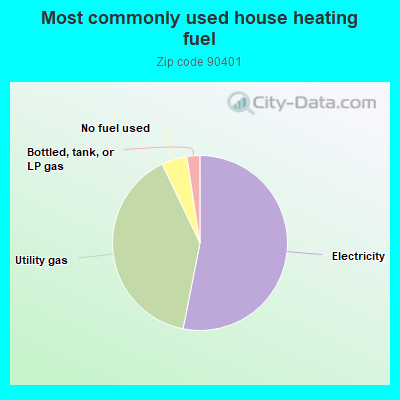
53.1%Electricity
39.8%Utility gas
4.7%No fuel used
2.4%Bottled, tank, or LP gas
Population in 1990: 4,813. Population change in the 1990s: +388 (+8.1%).
Place of birth for U.S.-born residents:
This state: 2,407
Northeast: 1,282
Midwest: 678
South: 644
West: 304
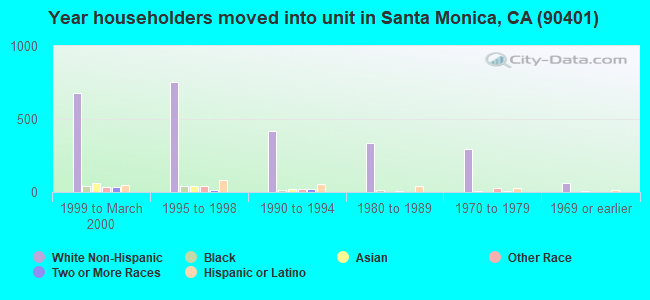
43% of the 90401 zip code residents lived in the same house 5 years ago. Out of people who lived in different houses, 56% lived in this county. Out of people who lived in different counties, 50% lived in California.
85% of the 90401 zip code residents lived in the same house 1 year ago. Out of people who lived in different houses, 47% moved from this county. Out of people who lived in different houses, 12% moved from different county within same state. Out of people who lived in different houses, 31% moved from different state. Out of people who lived in different houses, 9% moved from abroad.
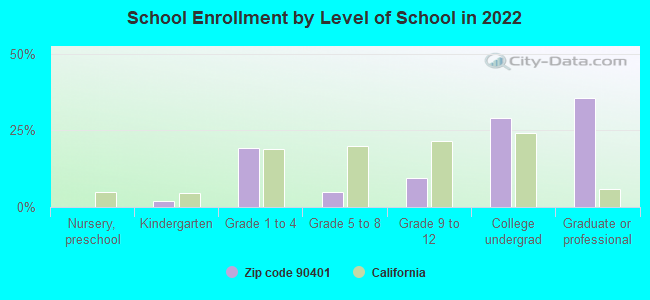
Private vs. public school enrollment:
Students in private schools in grades 1 to 8 (elementary and middle school):
Here:
0.0%
California:
10.5%
Students in private schools in grades 9 to 12 (high school): 41
Here:
52.1%
California:
8.5%
Students in private undergraduate colleges: 106
Here:
42.2%
California:
15.9%
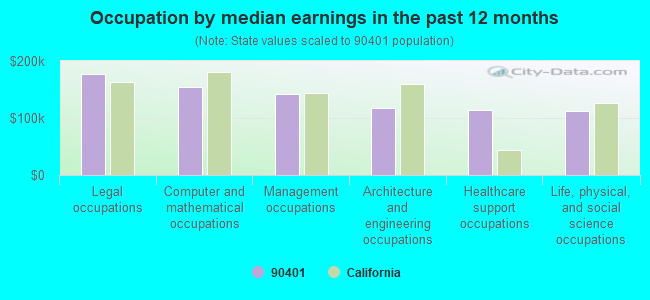
Occupation by median earnings in the past 12 months ($)
176,394Legal occupations
153,758Computer and mathematical occupations
142,067Management occupations
117,092Architecture and engineering occupations
113,873Healthcare support occupations
112,663Life, physical, and social science occupations
Companies with federal contracts located in this zip code (SANTA MONICA, CA):
PRANALYTICA INC (1101 COLORADO AVE; small business) : $2,721,678 in 8 contractsfrom 2002 to 2005
Contracts for Other Research and Development -- Advanced Development (R&D), Defense Electronics and Communication Equipment -- Applied Research and Exploratory Development (R&D), Other Defense -- Applied Research and Exploratory Development (R&D), Other Defense -- Basic Research (R&D), and moreby Department of Defense, Defense Advanced Research Projects Agency, National Oceanic and Atmospheric Administration/Under Secretary for Oceans and Atmosphere Signed by year:2000: $0; 2001: $0; 2002: $138,681; 2003: $158,730; 2004: $102,753; 2005: $2,321,514; 2006: $0.
Biggest contracts:
$1,762,500 with Department of Defense for Other Research and Development -- Advanced Development (R&D). Signed on 2005-01-25. Completion date: 2005-08-10.
$559,014 with Department of Defense for Defense Electronics and Communication Equipment -- Applied Research and Exploratory Development (R&D). Signed on 2005-01-21. Completion date: 2006-03-20.
$158,730 with Department of Defense for Other Defense -- Applied Research and Exploratory Development (R&D). Signed on 2003-08-01. Completion date: 2004-08-01.
$138,681 with Department of Defense for Other Defense -- Basic Research (R&D). Signed on 2002-11-12. Completion date: 2003-04-24.
TITAN BUSINESS DEVELOPMENT LLC (1411 FIFTH STREET, SUITE 5; small business) : $350,000 in 2 contractsfrom 2003 to 2004
$200,000 with Navy for Other Professional Services. Signed on 2004-04-05. Completion date: 2004-08-13.
$150,000, same as above.Signed on 2003-08-14. Completion date: 2004-08-13.
PCR SERVICES CORPORATION (233 WILSHIRE BLVD SUITE 13; small business) : $62,925 in 2 contractsfrom 2000 to 2002
$63,000 with U.S. Army Corps of Engineers - civil program financing only for Food Items For Resale. Signed on 2000-03-15. Completion date: 2000-03-14.
-$75 with U.S. Army Corps of Engineers - civil program financing only for Other Professional Services. Signed on 2002-09-30. Completion date: 2000-03-14.
INTELLIGENT TEXT PROCESSING, I (725 ARIZONA AVE STE 204; small business)
$58,950 with Army for Other ADP and Telecommunications Services (includes data storage on tapes, compact disks, etc.). Signed on 2000-08-17. Completion date: 2001-08-16.
$25,000 with Army for Real Property Appraisals Services (SIC 6531). Signed on 2004-01-13. Completion date: 2004-02-17.
SCHOOL-LINK TECHNOLOGIES, INC (1437 6TH ST)
$22,433 with Army for ADP Software. Signed on 2003-09-29. Completion date: 2003-10-31.
EXHIBIT DEAL (1119 COLORADO AVE; small business) : $14,508 in 2 contractsin 2004
$11,656 with Army for Miscellaneous Furniture and Fixtures. Taking place in CO. Signed on 2004-09-30. Completion date: 2004-10-08.
$2,852 with Navy for Signs, Advertising Displays, and Identification Plates. Signed on 2004-09-24. Completion date: 2004-10-07.
Top industries in this zip code by the number of employees in 2005:
2005 - 2018 National Fire Incident Reporting System (NFIRS) incidents
According to the data from the years 2005 - 2018 the average number of fires per year is 44. The highest number of fire incidents - 77 took place in 2016, and the least - 0 in 2007. The data has a declining trend.
When looking into fire subcategories, the most reports belonged to: Structure Fires (45.8%), and Outside Fires (36.1%).
Fire incident types reported to NFIRS in Zip Code 90401


 Nearest zip codes: 90403, 90402, 90404, 90405, 90291, 90292.
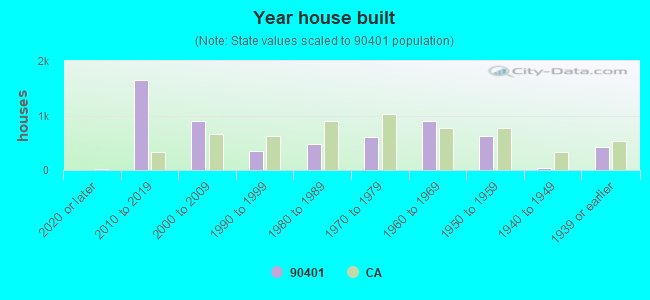


 According to the data from the years 2005 - 2018 the average number of fires per year is 44. The highest number of fire incidents - 77 took place in 2016, and the least - 0 in 2007. The data has a declining trend.
 When looking into fire subcategories, the most reports belonged to: Structure Fires (45.8%), and Outside Fires (36.1%).