Estimated zip code population in 2022: 16,216 Zip code population in 2010: 15,149 Zip code population in 2000: 15,175
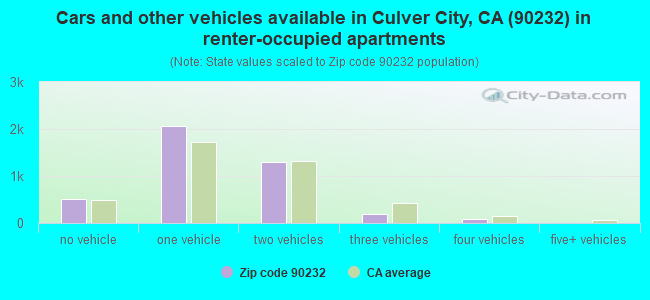
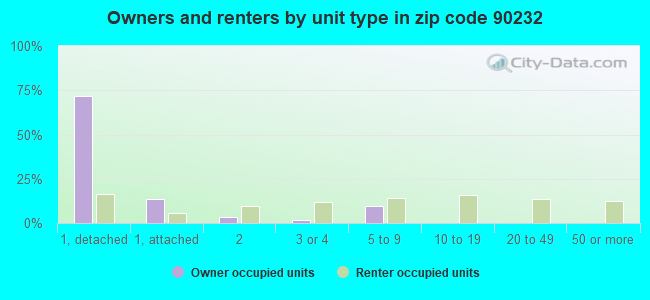
Houses and condos: 7,910 Renter-occupied apartments: 4,148
% of renters here:
57%
State:
44%
March 2022 cost of living index in zip code 90232: 144.0 (very high, U.S. average is 100)
Land area: 2.1 sq. mi. Water area: 0.0 sq. mi.
Population density: 7,699 people per square mile
(high).
OSM Map
General Map
Google Map
MSN Map
OSM Map
General Map
Google Map
MSN Map
OSM Map
General Map
Google Map
MSN Map
OSM Map
General Map
Google Map
MSN Map
Please wait while loading the map...
Real estate property taxes paid for housing units in 2022:
This zip code:
0.5% ($7,363)
California:
0.7% ($4,831)
Median real estate property taxes paid for housing units with mortgages in 2022: $9,996 (0.6%) Median real estate property taxes paid for housing units with no mortgage in 2022: $3,844 (0.3%)
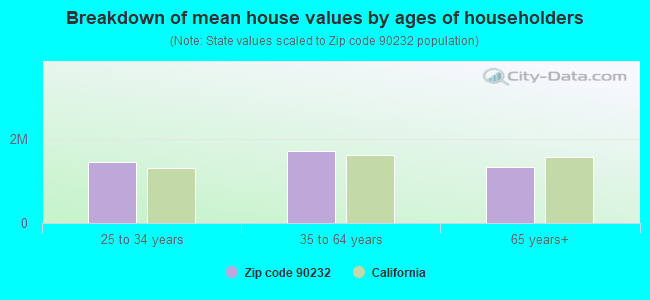
Estimated median house/condo value in 2022: $1,510,415
90232:
$1,510,415
California:
$715,900
According to our research of California and other state lists, there were 6 registered sex offenders living in 90232 zip code as of April 26, 2024. The ratio of all residents to sex offenders in zip code 90232 is 2,504 to 1. The ratio of registered sex offenders to all residents in this zip code is much lower than the state average.
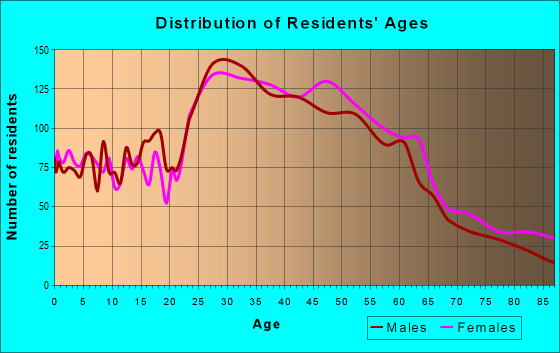
Median resident age:
This zip code:
37.9 years
California median age:
37.9 years
Average household size:
This zip code:
2.2 people
California:
2.8 people
Averages for the 2020 tax year for zip code 90232, filed in 2021:
Average Adjusted Gross Income (AGI) in 2020: $122,433 (Individual Income Tax Returns)
Here:
$122,433
State:
$95,910
Salary/wage: $105,186 (reported on 79.0% of returns)
Here:
$105,186
State:
$77,331
(% of AGI for various income ranges: 1176.0% for AGIs below $25k, 3865.3% for AGIs $25k-50k, 7270.1% for AGIs $50k-75k, 10821.4% for AGIs $75k-100k, 21344.6% for AGIs $100k-200k, 118237.6% for AGIs over 200k)
Taxable interest for individuals: $2,240 (reported on 43.1% of returns)
This zip code:
$2,240
California:
$2,294
(% of AGI for various income ranges: 40.1% for AGIs below $25k, 30.5% for AGIs $25k-50k, 82.4% for AGIs $50k-75k, 116.3% for AGIs $75k-100k, 250.2% for AGIs $100k-200k, 1341.5% for AGIs over 200k)
Ordinary dividends: $6,574 (reported on 33.7% of returns)
Here:
$6,574
State:
$10,949
(% of AGI for various income ranges: 72.3% for AGIs below $25k, 86.4% for AGIs $25k-50k, 138.4% for AGIs $50k-75k, 240.2% for AGIs $75k-100k, 568.9% for AGIs $100k-200k, 3282.7% for AGIs over 200k)
Net capital gain/loss in AGI: +$25,460 (reported on 32.4% of returns)
Here:
+$25,460
State:
+$49,306
(% of AGI for various income ranges: 42.0% for AGIs below $25k, 73.7% for AGIs $25k-50k, 123.8% for AGIs $50k-75k, 178.1% for AGIs $75k-100k, 935.9% for AGIs $100k-200k, 18994.8% for AGIs over 200k)
Profit/loss from business: +$15,411 (reported on 25.1% of returns)
Here:
+$15,411
State:
+$15,671
(% of AGI for various income ranges: 245.2% for AGIs below $25k, 383.7% for AGIs $25k-50k, 343.6% for AGIs $50k-75k, 470.3% for AGIs $75k-100k, 910.2% for AGIs $100k-200k, 4494.5% for AGIs over 200k)
Taxable individual retirement arrangement distribution: $20,883 (reported on 7.2% of returns)
90232:
$20,883
California:
$23,505
(% of AGI for various income ranges: 66.3% for AGIs below $25k, 91.2% for AGIs $25k-50k, 159.8% for AGIs $50k-75k, 256.8% for AGIs $75k-100k, 576.0% for AGIs $100k-200k, 1260.6% for AGIs over 200k)
Self-employed (Keogh) retirement plans: $23,906 (reported on 1.9% of returns)
90232:
$23,906
California:
$30,163
(% of AGI for various income ranges: 31.5% for AGIs $50k-75k, 71.7% for AGIs $100k-200k, 974.2% for AGIs over 200k)
Total itemized deductions: $36,831 (reported on 16.7% of returns)
Here:
$36,831
State:
$39,517
(% of AGI for various income ranges: 145.7% for AGIs below $25k, 285.5% for AGIs $25k-50k, 530.0% for AGIs $50k-75k, 791.4% for AGIs $75k-100k, 1653.3% for AGIs $100k-200k, 8427.3% for AGIs over 200k)
Charity contributions: $7,495 (reported on 14.6% of returns)
Here:
$7,495
State:
$12,598
(% of AGI for various income ranges: 8.3% for AGIs below $25k, 20.3% for AGIs $25k-50k, 52.5% for AGIs $50k-75k, 113.4% for AGIs $75k-100k, 266.7% for AGIs $100k-200k, 1870.6% for AGIs over 200k)
Taxes paid: $8,825 (reported on 16.6% of returns)
90232:
$8,825
State:
$8,807
(% of AGI for various income ranges: 27.7% for AGIs below $25k, 59.6% for AGIs $25k-50k, 115.9% for AGIs $50k-75k, 194.4% for AGIs $75k-100k, 477.5% for AGIs $100k-200k, 1864.5% for AGIs over 200k)
Earned income credit: $1,325 (reported on 8.0% of returns)
Here:
$1,325
State:
$2,074
(% of AGI for various income ranges: 48.0% for AGIs below $25k, 39.3% for AGIs $25k-50k)
Percentage of individuals using paid preparers for their 2020 taxes: 93.4%
Here:
93%
State:
92%
(% for various income ranges: 90.9% for AGIs below $25k, 92.4% for AGIs $25k-50k, 93.8% for AGIs $50k-75k, 94.8% for AGIs $75k-100k, 94.6% for AGIs $100k-200k, 95.4% for AGIs over 200k)
Averages for the 2012 tax year for zip code 90232, filed in 2013:
Average Adjusted Gross Income (AGI) in 2012: $74,350 (Individual Income Tax Returns)
Here:
$74,350
State:
$72,726
Salary/wage: $66,756 (reported on 80.5% of returns)
Here:
$66,756
State:
$59,079
(% of AGI for various income ranges: 63.7% for AGIs below $25k, 79.9% for AGIs $25k-50k, 78.5% for AGIs $50k-75k, 79.5% for AGIs $75k-100k, 77.6% for AGIs $100k-200k, 61.7% for AGIs over 200k)
Taxable interest for individuals: $1,558 (reported on 41.1% of returns)
This zip code:
$1,558
California:
$2,146
(% of AGI for various income ranges: 1.8% for AGIs below $25k, 0.8% for AGIs $25k-50k, 0.9% for AGIs $50k-75k, 0.6% for AGIs $75k-100k, 0.6% for AGIs $100k-200k, 1.0% for AGIs over 200k)
Ordinary dividends: $4,360 (reported on 25.9% of returns)
Here:
$4,360
State:
$9,308
(% of AGI for various income ranges: 2.2% for AGIs below $25k, 1.2% for AGIs $25k-50k, 1.1% for AGIs $50k-75k, 1.4% for AGIs $75k-100k, 1.3% for AGIs $100k-200k, 1.9% for AGIs over 200k)
Net capital gain/loss in AGI: +$11,412 (reported on 21.9% of returns)
Here:
+$11,412
State:
+$30,460
(% of AGI for various income ranges: 0.6% for AGIs $50k-75k, 0.5% for AGIs $75k-100k, 1.5% for AGIs $100k-200k, 8.9% for AGIs over 200k)
Profit/loss from business: +$14,485 (reported on 26.3% of returns)
Here:
+$14,485
State:
+$17,064
(% of AGI for various income ranges: 18.0% for AGIs below $25k, 7.5% for AGIs $25k-50k, 5.0% for AGIs $50k-75k, 4.0% for AGIs $75k-100k, 5.3% for AGIs $100k-200k, 2.6% for AGIs over 200k)
Taxable individual retirement arrangement distribution: $14,913 (reported on 8.2% of returns)
90232:
$14,913
California:
$19,557
(% of AGI for various income ranges: 3.1% for AGIs below $25k, 1.4% for AGIs $25k-50k, 2.1% for AGIs $50k-75k, 1.9% for AGIs $75k-100k, 1.9% for AGIs $100k-200k, 1.0% for AGIs over 200k)
Self-employment retirement plans: $15,806 (reported on 1.9% of returns)
90232:
$15,806
California:
$24,530
(% of AGI for various income ranges: 0.5% for AGIs $50k-75k, 0.5% for AGIs $100k-200k, 0.6% for AGIs over 200k)
Total itemized deductions: $29,803 (23% of AGI, reported on 40.4% of returns)
Here:
$29,803
State:
$34,004
Here:
22.7% of AGI
State:
22.7% of AGI
(% of AGI for various income ranges: 15.7% for AGIs below $25k, 11.5% for AGIs $25k-50k, 14.0% for AGIs $50k-75k, 16.0% for AGIs $75k-100k, 18.6% for AGIs $100k-200k, 16.8% for AGIs over 200k)
Charity contributions: $3,213 (reported on 34.5% of returns)
Here:
$3,213
State:
$4,659
(% of AGI for various income ranges: 0.8% for AGIs below $25k, 1.1% for AGIs $25k-50k, 1.4% for AGIs $50k-75k, 1.6% for AGIs $75k-100k, 1.6% for AGIs $100k-200k, 1.6% for AGIs over 200k)
Taxes paid: $12,568 (reported on 40.1% of returns)
90232:
$12,568
State:
$14,448
(% of AGI for various income ranges: 3.2% for AGIs below $25k, 2.4% for AGIs $25k-50k, 3.7% for AGIs $50k-75k, 5.9% for AGIs $75k-100k, 7.9% for AGIs $100k-200k, 9.4% for AGIs over 200k)
Earned income credit: $1,628 (reported on 11.6% of returns)
Here:
$1,628
State:
$2,286
(% of AGI for various income ranges: 3.9% for AGIs below $25k, 0.5% for AGIs $25k-50k)
Percentage of individuals using paid preparers for their 2012 taxes: 63.9%
Here:
64%
State:
64%
(% for various income ranges: 62.0% for AGIs below $25k, 58.6% for AGIs $25k-50k, 64.3% for AGIs $50k-75k, 64.2% for AGIs $75k-100k, 70.0% for AGIs $100k-200k, 75.9% for AGIs over 200k)
Averages for the 2004 tax year for zip code 90232, filed in 2005:
Average Adjusted Gross Income (AGI) in 2004: $67,043 (Individual Income Tax Returns)
Here:
$67,043
State:
$58,600
Salary/wage: $63,353 (reported on 80.7% of returns)
Here:
$63,353
State:
$49,455
(% of AGI for various income ranges: 106.5% for AGIs below $10k, 72.3% for AGIs $10k-25k, 83.7% for AGIs $25k-50k, 80.8% for AGIs $50k-75k, 82.0% for AGIs $75k-100k, 72.3% for AGIs over 100k)
Taxable interest for individuals: $2,088 (reported on 50.8% of returns)
This zip code:
$2,088
California:
$2,365
(% of AGI for various income ranges: 12.3% for AGIs below $10k, 2.5% for AGIs $10k-25k, 1.6% for AGIs $25k-50k, 1.8% for AGIs $50k-75k, 1.3% for AGIs $75k-100k, 1.3% for AGIs over 100k)
Taxable dividends: $3,650 (reported on 27.2% of returns)
Here:
$3,650
State:
$4,746
(% of AGI for various income ranges: 7.0% for AGIs below $10k, 1.4% for AGIs $10k-25k, 1.0% for AGIs $25k-50k, 1.1% for AGIs $50k-75k, 1.0% for AGIs $75k-100k, 1.7% for AGIs over 100k)
Net capital gain/loss: +$12,325 (reported on 23.4% of returns)
Here:
+$12,325
State:
+$23,418
(% of AGI for various income ranges: -4.6% for AGIs below $10k, -0.1% for AGIs $10k-25k, 0.3% for AGIs $25k-50k, 0.8% for AGIs $50k-75k, 1.5% for AGIs $75k-100k, 7.1% for AGIs over 100k)
Profit/loss from business: +$15,693 (reported on 24.9% of returns)
Here:
+$15,693
State:
+$16,826
(% of AGI for various income ranges: 24.6% for AGIs below $10k, 12.9% for AGIs $10k-25k, 5.6% for AGIs $25k-50k, 4.7% for AGIs $50k-75k, 4.6% for AGIs $75k-100k, 5.4% for AGIs over 100k)
IRA payment deduction: $2,951 (reported on 3.9% of returns)
90232:
$2,951
California:
$3,192
(% of AGI for various income ranges: 0.6% for AGIs below $10k, 0.3% for AGIs $10k-25k, 0.3% for AGIs $25k-50k, 0.3% for AGIs $50k-75k, 0.3% for AGIs $75k-100k, 0.1% for AGIs over 100k)
Self-employed pension: $14,319 (reported on 1.8% of returns)
Here:
$14,319
California:
$17,688
(% of AGI for various income ranges: 0.7% for AGIs below $10k, 0.2% for AGIs $25k-50k, 0.2% for AGIs $50k-75k, 0.5% for AGIs $75k-100k, 0.5% for AGIs over 100k)
Total itemized deductions: $28,844 (23% of AGI, reported on 39.5% of returns)
Here:
$28,844
State:
$28,113
Here:
22.6% of AGI
State:
25.3% of AGI
(% of AGI for various income ranges: 32.2% for AGIs below $10k, 14.1% for AGIs $10k-25k, 13.1% for AGIs $25k-50k, 18.0% for AGIs $50k-75k, 22.6% for AGIs $75k-100k, 16.8% for AGIs over 100k)
Charity contributions deductions: $4,228 (3% of AGI, reported on 35.6% of returns)
Here:
$4,228
State:
$3,923
Here:
3.1% of AGI
State:
3.3% of AGI
(% of AGI for various income ranges: 1.2% for AGIs below $10k, 1.1% for AGIs $10k-25k, 1.4% for AGIs $25k-50k, 2.4% for AGIs $50k-75k, 2.6% for AGIs $75k-100k, 2.5% for AGIs over 100k)
Total tax: $13,333 (reported on 82.0% of returns)
90232:
$13,333
State:
$10,761
(% of AGI for various income ranges: 7.3% for AGIs below $10k, 5.5% for AGIs $10k-25k, 8.2% for AGIs $25k-50k, 10.7% for AGIs $50k-75k, 11.2% for AGIs $75k-100k, 21.7% for AGIs over 100k)
Earned income credit: $1,396 (reported on 11.3% of returns)
Here:
$1,396
State:
$1,763
Percentage of individuals using paid preparers for their 2004 taxes: 66.9%
Here:
67%
State:
66%
(% for various income ranges: 63.2% for AGIs below $10k, 66.7% for AGIs $10k-25k, 61.3% for AGIs $25k-50k, 67.9% for AGIs $50k-75k, 71.5% for AGIs $75k-100k, 78.6% for AGIs over 100k)
Likely homosexual households (counted as self-reported same-sex unmarried-partner households)
Lesbian couples: 0.3% of all households
Gay men: 0.1% of all households
Household received Food Stamps/SNAP in the past 12 months: 148 Household did not receive Food Stamps/SNAP in the past 12 months: 6,994
Women who had a birth in the past 12 months: 134 (133 now married, 0 unmarried) Women who did not have a birth in the past 12 months: 4,018 (1,681 now married, 2,332 unmarried)
Housing units in zip code 90232 with a mortgage: 1,805 (365 second mortgage, 20 home equity loan, 342 both second mortgage and home equity loan) Houses without a mortgage: 10
Median monthly owner costs for units with a mortgage: $3,876 Median monthly owner costs for units without a mortgage: $749
Residents with income below the poverty level in 2022:
This zip code:
7.9%
Whole state:
12.2%
Residents with income below 50% of the poverty level in 2022:
This zip code:
4.2%
Whole state:
6.2%
Median number of rooms in houses and condos:
Here:
5.5
State:
6.0
Median number of rooms in apartments:
Here:
3.3
State:
3.9
Notable locations in this zip code not listed on our city pages
Notable locations in zip code 90232: Desilu Studios (A), MGM Studios (B), Culver City Fire Department Station 1 Headquarters (C), Culver City Hall (D). Display/hide their locations on the map
Churches in zip code 90232 include: West Los Angeles Christian Center (A), Saint Augustine Roman Catholic Church (B). Display/hide their locations on the map
Parks in zip code 90232 include: Blair Hills Park (1), McManus Park (2), Media Park (3), Doctor Carlson Memorial Park (4), Culver City Park (5), Tellefson Park (6). Display/hide their locations on the map
2,387 married couples with children.
260 single-parent households (58 men, 202 women).
63.1% of residents of 90232 zip code speak English at home.
18.2% of residents speak Spanish at home (82% very well, 14% well, 3% not well, 2% not at all).
6.6% of residents speak other Indo-European language at home (82% very well, 18% well).
9.8% of residents speak Asian or Pacific Island language at home (62% very well, 29% well, 4% not well, 4% not at all).
2.1% of residents speak other language at home (79% very well, 9% well, 12% not well).
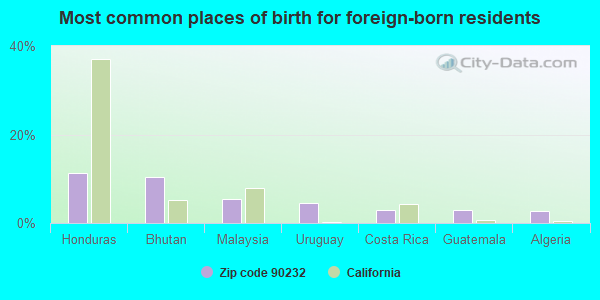
Foreign born population: 3,919 (24.2%) (57.7% of them are naturalized citizens)
Major facilities with environmental interests located in this zip code:
ALVIN METALS CO (8794 NATIONAL BLVD in CULVER CITY, CA)
STATE MASTER (California - Hazardous Waste Tracking) - HAZARDOU WASTE PROGRAM Small Quantity Generators, between 100 kg and 1000 kg of hazardous waste/month (Resource Conservation and Recovery Act (tracking hazardous waste)) - notification
CHEVRON STATION NO 94786 (10649 JEFFERSON BLVD in CULVER CITY, CA)
STATE MASTER (California - Hazardous Waste Tracking) - HAZARDOU WASTE PROGRAM Small Quantity Generators, between 100 kg and 1000 kg of hazardous waste/month (Resource Conservation and Recovery Act (tracking hazardous waste)) Organizations: CHEVRON PRODUCTS CO (CONTACT/OWNER)
Alternative names: R R KELLOGG INC BUBBLE MACHINE
C AND C LACQUER (2633 S FAIRFAX AVE in CULVER CITY, CA)
STATE MASTER (California - Hazardous Waste Tracking) - HAZARDOU WASTE PROGRAM Small Quantity Generators, between 100 kg and 1000 kg of hazardous waste/month (Resource Conservation and Recovery Act (tracking hazardous waste)) - notification Organizations: ROBERTO COBIAN (CONTACT/OWNER)
HOWE (LINWOOD E.) ELEMENTARY (4100 IRVING PL. in CULVER CITY, CA)
(National Center for Education Statistics) - STATE ID-6012660 Organizations: CULVER CITY UNIFIED (SCHOOL DISTRICT)
JASON NATURAL PRODUCTS, INC. (3515 EAST HAM DRIVE in CULVER, CA)
(Integrated Compliance Information System) - ICIS-09-2004-0267, FORMAL ENFORCEMENT ACTION COMPLIANCE ACTIVITY (Tracking inspections of insecticide, fungicide, and rodenticide, and toxic substances)
LA BALLONA ELEMENTARY (10915 WASHINGTON BLVD. in CULVER CITY, CA)
(National Center for Education Statistics) - STATE ID-6012702 Organizations: CULVER CITY UNIFIED (SCHOOL DISTRICT)
GREAT WEST CAR WASH (11166 VENICE BLVD in CULVER CITY, CA)
(Integrated Compliance Information System) - ICIS-09-2000-0043, FORMAL ENFORCEMENT ACTION, ICIS-09-2001-0025, Business SIC classification: CARWASHES
APARTMENT HOUSE (3840 MOTOR AVE in CULVER CITY, CA)
Large Quantity Generators, more that 1000 kg of hazardous waste/month (Resource Conservation and Recovery Act (tracking hazardous waste)) Organizations: HMH ASCIATES, INC. (CONTACT/OPERATOR)
, 3840 MOTOR PROPERTIES, L.P. (CONTACT/OWNER)
HATBOX PRODUCTIONS INC (9530 JEFFERSON BLVD in CULVER CITY, CA)
(Resource Conservation and Recovery Act (tracking hazardous waste)) Organizations: MERIT INVESTMENTS CO (CONTACT/OWNER)
LENYO CORPORATION (3550 HAYDEN in CULVER, CA)
CRITERIA AND HAZARDOUS AIR POLLUTANT INVENTORY (Inventory of air pollution sources) Small Quantity Generators, between 100 kg and 1000 kg of hazardous waste/month (Resource Conservation and Recovery Act (tracking hazardous waste)) - notification Business SIC classification: MILLWORK; DRAPERY HARDWARE AND WINDOW BLINDS AND SHADES
ALROS LABEL CO INC (10131 JEFFERSON BLVD in CULVER CITY, CA)
Small Quantity Generators, between 100 kg and 1000 kg of hazardous waste/month (Resource Conservation and Recovery Act (tracking hazardous waste)) - notification Organizations: ALFREDO ROSALES CORP (CONTACT/OWNER)
GINA B LTD (3582 EASTHAM DR in CULVER CITY, CA)
Small Quantity Generators, between 100 kg and 1000 kg of hazardous waste/month (Resource Conservation and Recovery Act (tracking hazardous waste)) - notification
HOLIDAY MOTOR HOMES (10424 VENICE BLVD in CULVER CITY, CA)
Small Quantity Generators, between 100 kg and 1000 kg of hazardous waste/month (Resource Conservation and Recovery Act (tracking hazardous waste)) - notification Business NAICS classification: GENERAL AUTOMOTIVE REPAIR. Organizations: BILL SHOFFLEBOTHAM (CONTACT/OWNER)
Housing units lacking complete plumbing facilities: 0.2% Housing units lacking complete kitchen facilities: 2.3%
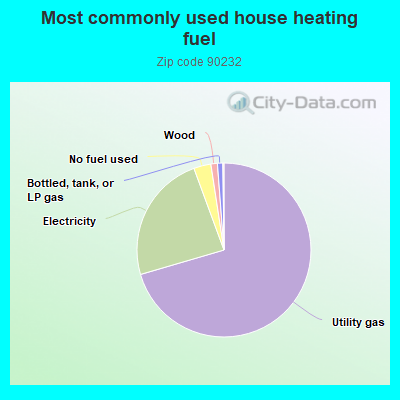
70.4%Utility gas
23.9%Electricity
3.2%No fuel used
1.2%Wood
1.0%Bottled, tank, or LP gas
Population in 1990: 16,138.
Place of birth for U.S.-born residents:
This state: 7,411
Northeast: 1,595
Midwest: 1,157
South: 939
West: 869
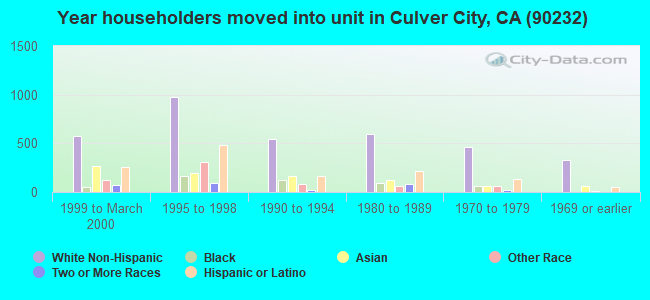
57% of the 90232 zip code residents lived in the same house 5 years ago. Out of people who lived in different houses, 81% lived in this county. Out of people who lived in different counties, 50% lived in California.
90% of the 90232 zip code residents lived in the same house 1 year ago. Out of people who lived in different houses, 65% moved from this county. Out of people who lived in different houses, 10% moved from different county within same state. Out of people who lived in different houses, 17% moved from different state. Out of people who lived in different houses, 8% moved from abroad.
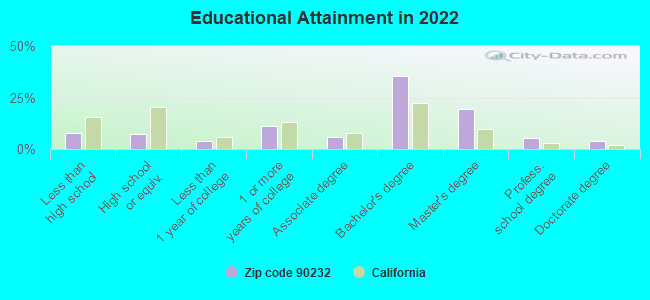
Private vs. public school enrollment:
Students in private schools in grades 1 to 8 (elementary and middle school): 290
Here:
22.3%
California:
10.5%
Students in private schools in grades 9 to 12 (high school): 72
Here:
15.2%
California:
8.5%
Students in private undergraduate colleges: 73
Here:
9.9%
California:
15.9%
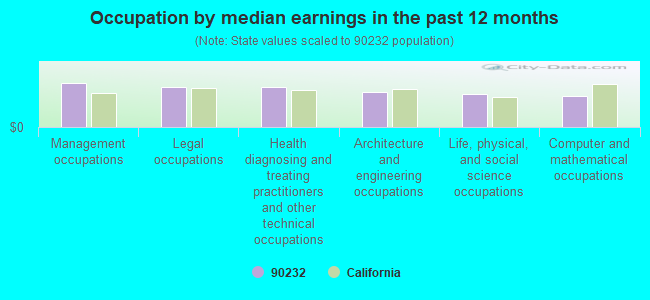
Occupation by median earnings in the past 12 months ($)
151,077Management occupations
136,985Legal occupations
135,713Health diagnosing and treating practitioners and other technical occupations
119,477Architecture and engineering occupations
114,791Life, physical, and social science occupations
105,907Computer and mathematical occupations
Companies with biggest federal contracts located in this zip code (CULVER CITY, CA):
SONY PICTURES ENTERTAINMENT,IN (10202 W WASHINGTON BLVD) : $5,006,397 in 104 contractsfrom 1999 to 2004
Contracts for Lease or Rental of Equipment -- Miscellaneous by Navy Signed by year:2000: $724,123; 2001: $915,805; 2002: $1,086,057; 2003: $1,250,459; 2004: $806,607; 2005: $0; 2006: $0.
Biggest contracts:
$77,663 with Navy for Lease or Rental of Equipment -- Miscellaneous. Signed on 2004-07-19. Completion date: 2004-09-20.
$74,313, same as above.Signed on 2002-07-25. Completion date: 2002-08-19.
$74,313, same as above.Signed on 2002-06-03. Completion date: 2002-07-15.
$73,075, same as above.Signed on 2000-07-30. Completion date: 2000-07-31.
COLUMBIA TRISTAR FILM DISTRIBU (10202 W WASHINGTON BLVD) : $1,220,100 in 28 contractsfrom 2000 to 2006
Contracts for Miscellaneous Items by Department of Defense, American Forces Information Service Signed by year:2000: -$58,334; 2001: $246,045; 2002: $109,440; 2003: $134,553; 2004: $263,752; 2005: $380,821; 2006: $143,823.
Biggest contracts:
$246,045 with Department of Defense for Miscellaneous Items. Signed on 2001-09-26. Completion date: 2002-03-01.
$217,047 with American Forces Information Service for Miscellaneous Items. Signed on 2004-01-23. Completion date: 2004-06-15.
$94,109, same as above.Signed on 2005-01-18. Completion date: 2005-06-15.
$86,930 with Department of Defense for Miscellaneous Items. Signed on 2006-01-24. Completion date: 2006-02-10.
WESTWOOD ONE RADIO NETWORKS (9540 WASHINGTON BLVD) : $1,163,704 in 7 contractsfrom 2000 to 2005
Contracts for Miscellaneous Items by Department of Defense, American Forces Information Service Signed by year:2000: $182,602; 2001: $189,906; 2002: $197,502; 2003: $205,402; 2004: $0; 2005: $388,292; 2006: $0.
Biggest contracts:
$213,700 with Department of Defense for Miscellaneous Items. Signed on 2005-11-16. Completion date: 2005-12-31.
$205,402 with American Forces Information Service for Miscellaneous Items. Signed on 2003-11-14. Completion date: 2004-12-31.
$197,502 with Department of Defense for Miscellaneous Items. Signed on 2002-12-04. Completion date: 2004-12-31.
$189,906, same as above.Signed on 2001-11-28. Completion date: 2004-12-31.
MEDSCHOOL COM/MEDSN INC (8520 NATIONAL BLVD; small business) : $845,164 in 3 contractsfrom 2000 to 2001
$697,544 with Department of Defense for Other Research and Development -- Basic Research (R&D). Signed on 2001-09-24. Completion date: 2002-07-24.
$97,620, same as above.Signed on 2000-12-22. Completion date: 2001-05-30.
$50,000, same as above.Signed on 2001-09-19. Completion date: 2001-09-30.
Q-TECH CORPORATION (10150 W JEFFERSON BLVD; small business)
$630,000 with Army for Engineering -- Operational Systems Development (R&D). Signed on 2001-06-25. Completion date: 2002-09-22.
WESTWOOD ONE, INC (9540 WASHINGTON BLVD) : $209,813 in 2 contractsfrom 1999 to 2004
$175,579 with Department of Defense for Miscellaneous Items. Signed on 1999-12-22. Completion date: 2000-12-31.
$34,234 with American Forces Information Service for Miscellaneous Items. Signed on 2004-12-16. Completion date: 2004-12-31.
WEST COAST PLASTICS EQUIPMENT, (6122 WEST WASHINGTON BOULE; small business) : $123,416 in 7 contractsfrom 2001 to 2005
Contracts for Rubber and Plastics Working Machinery, Wire and Cable, Electrical, Laboratory Equipment and Supplies, Wrapping and Packaging Machinery, and moreby Navy, Army, Air Force Signed by year:2000: $0; 2001: $69,960; 2002: $0; 2003: $1,926; 2004: $24,768; 2005: $26,762; 2006: $0.
Biggest contracts:
$69,960 with Navy for Rubber and Plastics Working Machinery. Taking place in GA. Signed on 2001-09-25. Completion date: 2001-11-05.
$18,000 with Navy for Wire and Cable, Electrical. Signed on 2004-12-16. Completion date: 2005-01-19.
$10,637 with Navy for Laboratory Equipment and Supplies. Taking place in MD. Signed on 2005-03-02. Completion date: 2005-09-30.
$8,780 with Army for Wrapping and Packaging Machinery. Signed on 2005-06-23. Completion date: 2005-07-22.
PACIFIC PISTON RING CO INC (3620 EASTHAM DR; small business) : $111,586 in 17 contractsfrom 2004 to 2006
Contracts for Miscellaneous Engine Accessories, Aircraft, Gasoline Reciprocating Engines, Except Aircraft; and Components, Compressors and Vacuum Pumps, Nuts and Washers by Defense Logistics Agency Signed by year:2000: $0; 2001: $0; 2002: $0; 2003: $0; 2004: $14,146; 2005: $81,556; 2006: $15,884.
Biggest contracts:
$12,650 with Defense Logistics Agency for Miscellaneous Engine Accessories, Aircraft. Signed on 2005-08-05. Completion date: 2006-01-09.
$11,569 with Defense Logistics Agency for Gasoline Reciprocating Engines, Except Aircraft; and Components. Signed on 2005-10-26. Completion date: 2006-03-15.
$8,316 with Defense Logistics Agency for Miscellaneous Engine Accessories, Aircraft. Signed on 2006-04-17. Completion date: 2006-06-10.
$7,695, same as above.Signed on 2005-06-03. Completion date: 2005-07-18.
SPECIAL FORCES GEAR, INC (3644 EASTHAM DR; small business) : $91,505 in 4 contractsfrom 2004 to 2006
$75,335 with Army for Individual Equipment. Signed on 2005-09-23. Completion date: 2005-10-28.
$7,087 with Army for Clothing, Special Purpose. Taking place in TX. Signed on 2004-06-10. Completion date: 2004-07-09.
$5,883 with Army for Individual Equipment. Signed on 2006-01-23. Completion date: 2006-01-31.
$3,200 with Army for Hospital Furniture, Equipment, Utensils, and Supplies. Signed on 2005-06-27. Completion date: 2005-06-20.
DIGITAL FUSION LLC (3542 HAYDEN AVE; small business) : $65,539 in 2 contractsfrom 2004 to 2005
$38,999 with Air Force for Miscellaneous Items. Signed on 2005-06-30. Completion date: 2005-07-29.
$26,540, same as above.Signed on 2004-09-30. Completion date: 2004-10-30.
Top industries in this zip code by the number of employees in 2005:
2005 - 2018 National Fire Incident Reporting System (NFIRS) incidents
Based on the data from the years 2005 - 2018 the average number of fire incidents per year is 16. The highest number of reported fire incidents - 34 took place in 2013, and the least - 1 in 2007. The data has a rising trend.
When looking into fire subcategories, the most incidents belonged to: Outside Fires (37.4%), and Structure Fires (35.6%).
Fire incident types reported to NFIRS in Zip Code 90232
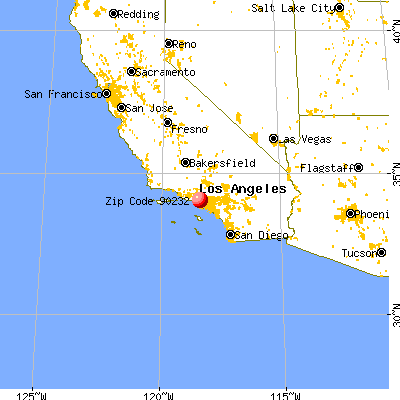


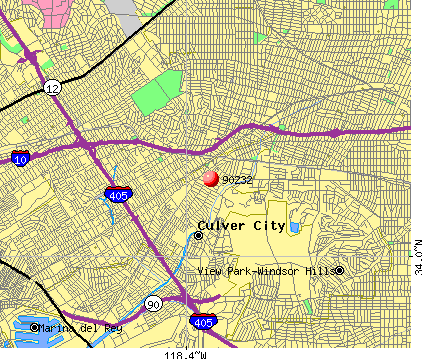 Nearest zip codes: 90034, 90230, 90035, 90064, 90056, 90016.


 Based on the data from the years 2005 - 2018 the average number of fire incidents per year is 16. The highest number of reported fire incidents - 34 took place in 2013, and the least - 1 in 2007. The data has a rising trend.
 When looking into fire subcategories, the most incidents belonged to: Outside Fires (37.4%), and Structure Fires (35.6%).