Estimated zip code population in 2022: 46,916 Zip code population in 2010: 47,596 Zip code population in 2000: 46,968
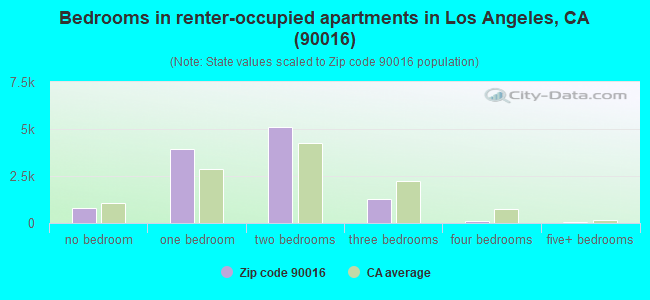
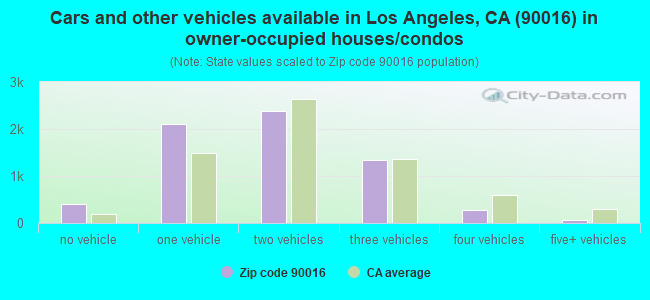
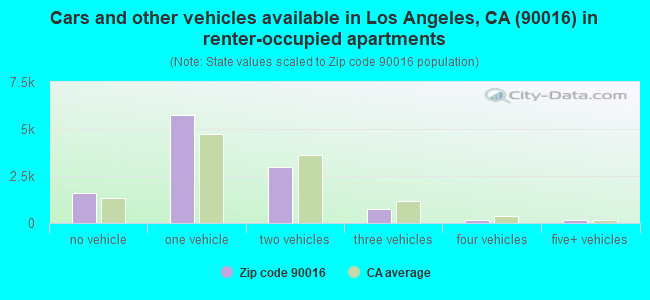
Houses and condos: 19,463 Renter-occupied apartments: 11,343
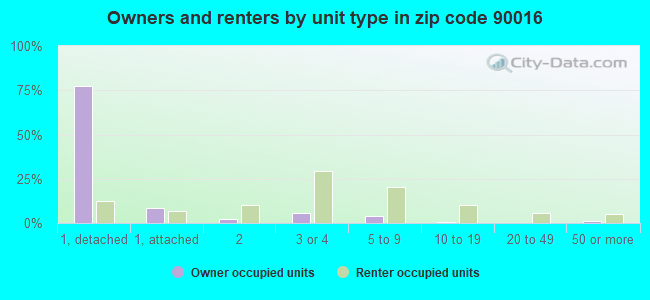
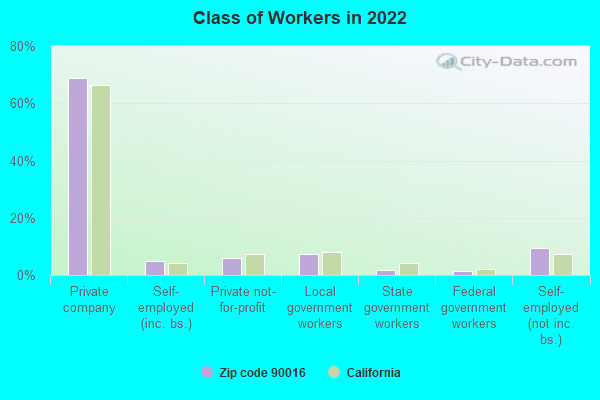
% of renters here:
63%
State:
44%
March 2022 cost of living index in zip code 90016: 143.1 (very high, U.S. average is 100)
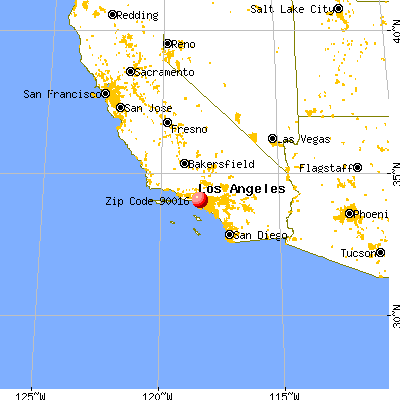
Land area: 3.6 sq. mi. Water area: 0.0 sq. mi.
Population density: 12,935 people per square mile
(very high).
OSM Map
General Map
Google Map
MSN Map
OSM Map
General Map
Google Map
MSN Map
OSM Map
General Map
Google Map
MSN Map
OSM Map
General Map
Google Map
MSN Map
Please wait while loading the map...
Real estate property taxes paid for housing units in 2022:
This zip code:
0.4% ($4,087)
California:
0.7% ($4,831)
Median real estate property taxes paid for housing units with mortgages in 2022: $4,745 (0.5%) Median real estate property taxes paid for housing units with no mortgage in 2022: $2,046 (0.2%)
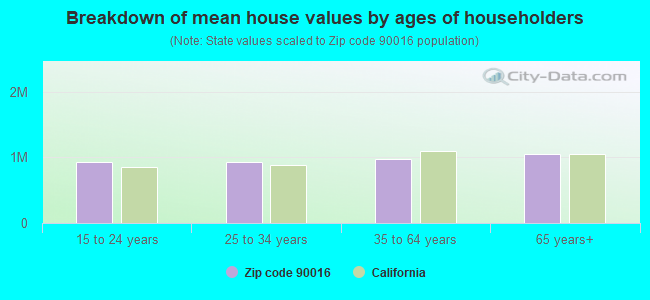
Estimated median house/condo value in 2022: $910,484
90016:
$910,484
California:
$715,900
According to our research of California and other state lists, there were 78 registered sex offenders living in 90016 zip code as of April 26, 2024. The ratio of all residents to sex offenders in zip code 90016 is 612 to 1. The ratio of registered sex offenders to all residents in this zip code is near the state average.
Median resident age:
This zip code:
35.6 years
California median age:
37.9 years
Average household size:
This zip code:
2.6 people
California:
2.8 people
Averages for the 2020 tax year for zip code 90016, filed in 2021:
Average Adjusted Gross Income (AGI) in 2020: $52,055 (Individual Income Tax Returns)
Here:
$52,055
State:
$95,910
Salary/wage: $50,217 (reported on 79.6% of returns)
Here:
$50,217
State:
$77,331
(% of AGI for various income ranges: 1178.0% for AGIs below $25k, 4062.2% for AGIs $25k-50k, 7763.2% for AGIs $50k-75k, 11793.5% for AGIs $75k-100k, 21134.7% for AGIs $100k-200k, 75155.8% for AGIs over 200k)
Taxable interest for individuals: $544 (reported on 22.0% of returns)
This zip code:
$544
California:
$2,294
(% of AGI for various income ranges: 5.9% for AGIs below $25k, 7.6% for AGIs $25k-50k, 21.9% for AGIs $50k-75k, 31.2% for AGIs $75k-100k, 71.4% for AGIs $100k-200k, 252.5% for AGIs over 200k)
Ordinary dividends: $2,379 (reported on 10.1% of returns)
Here:
$2,379
State:
$10,949
(% of AGI for various income ranges: 6.2% for AGIs below $25k, 10.2% for AGIs $25k-50k, 30.2% for AGIs $50k-75k, 48.5% for AGIs $75k-100k, 152.7% for AGIs $100k-200k, 903.3% for AGIs over 200k)
Net capital gain/loss in AGI: +$11,741 (reported on 10.5% of returns)
Here:
+$11,741
State:
+$49,306
(% of AGI for various income ranges: 4.2% for AGIs below $25k, 15.2% for AGIs $25k-50k, 34.7% for AGIs $50k-75k, 122.0% for AGIs $75k-100k, 543.8% for AGIs $100k-200k, 8662.1% for AGIs over 200k)
Profit/loss from business: +$7,344 (reported on 25.9% of returns)
Here:
+$7,344
State:
+$15,671
(% of AGI for various income ranges: 303.2% for AGIs below $25k, 174.2% for AGIs $25k-50k, 207.5% for AGIs $50k-75k, 338.2% for AGIs $75k-100k, 554.6% for AGIs $100k-200k, 2405.4% for AGIs over 200k)
Taxable individual retirement arrangement distribution: $14,557 (reported on 2.7% of returns)
90016:
$14,557
California:
$23,505
(% of AGI for various income ranges: 18.6% for AGIs below $25k, 22.9% for AGIs $25k-50k, 70.7% for AGIs $50k-75k, 116.4% for AGIs $75k-100k, 282.2% for AGIs $100k-200k, 717.5% for AGIs over 200k)
Self-employed (Keogh) retirement plans: $14,843 (reported on 0.3% of returns)
90016:
$14,843
California:
$30,163
(% of AGI for various income ranges: 4.2% for AGIs $25k-50k, 30.8% for AGIs $100k-200k, 217.9% for AGIs over 200k)
Total itemized deductions: $28,543 (reported on 10.4% of returns)
Here:
$28,543
State:
$39,517
(% of AGI for various income ranges: 49.6% for AGIs below $25k, 165.8% for AGIs $25k-50k, 451.5% for AGIs $50k-75k, 1051.3% for AGIs $75k-100k, 2272.1% for AGIs $100k-200k, 6768.8% for AGIs over 200k)
Charity contributions: $5,852 (reported on 8.6% of returns)
Here:
$5,852
State:
$12,598
(% of AGI for various income ranges: 3.7% for AGIs below $25k, 23.2% for AGIs $25k-50k, 76.1% for AGIs $50k-75k, 196.2% for AGIs $75k-100k, 381.2% for AGIs $100k-200k, 1299.6% for AGIs over 200k)
Taxes paid: $7,940 (reported on 10.3% of returns)
90016:
$7,940
State:
$8,807
(% of AGI for various income ranges: 12.1% for AGIs below $25k, 37.6% for AGIs $25k-50k, 115.5% for AGIs $50k-75k, 303.0% for AGIs $75k-100k, 698.1% for AGIs $100k-200k, 1802.9% for AGIs over 200k)
Earned income credit: $2,002 (reported on 20.4% of returns)
Here:
$2,002
State:
$2,074
(% of AGI for various income ranges: 113.6% for AGIs below $25k, 65.8% for AGIs $25k-50k, 0.5% for AGIs $50k-75k)
Percentage of individuals using paid preparers for their 2020 taxes: 90.3%
Here:
90%
State:
92%
(% for various income ranges: 88.3% for AGIs below $25k, 90.9% for AGIs $25k-50k, 92.1% for AGIs $50k-75k, 90.9% for AGIs $75k-100k, 92.9% for AGIs $100k-200k, 94.4% for AGIs over 200k)
Averages for the 2012 tax year for zip code 90016, filed in 2013:
Average Adjusted Gross Income (AGI) in 2012: $35,791 (Individual Income Tax Returns)
Here:
$35,791
State:
$72,726
Salary/wage: $35,233 (reported on 81.2% of returns)
Here:
$35,233
State:
$59,079
(% of AGI for various income ranges: 72.4% for AGIs below $25k, 86.1% for AGIs $25k-50k, 83.5% for AGIs $50k-75k, 81.3% for AGIs $75k-100k, 79.5% for AGIs $100k-200k, 59.1% for AGIs over 200k)
Taxable interest for individuals: $500 (reported on 20.9% of returns)
This zip code:
$500
California:
$2,146
(% of AGI for various income ranges: 0.3% for AGIs below $25k, 0.2% for AGIs $25k-50k, 0.3% for AGIs $50k-75k, 0.4% for AGIs $75k-100k, 0.4% for AGIs $100k-200k, 0.4% for AGIs over 200k)
Ordinary dividends: $1,967 (reported on 6.0% of returns)
Here:
$1,967
State:
$9,308
(% of AGI for various income ranges: 0.3% for AGIs below $25k, 0.3% for AGIs $25k-50k, 0.3% for AGIs $50k-75k, 0.4% for AGIs $75k-100k, 0.4% for AGIs $100k-200k, 0.7% for AGIs over 200k)
Net capital gain/loss in AGI: +$3,913 (reported on 4.8% of returns)
Here:
+$3,913
State:
+$30,460
(% of AGI for various income ranges: 1.3% for AGIs $100k-200k, 6.2% for AGIs over 200k)
Profit/loss from business: +$9,012 (reported on 22.6% of returns)
Here:
+$9,012
State:
+$17,064
(% of AGI for various income ranges: 18.1% for AGIs below $25k, 4.2% for AGIs $25k-50k, 2.4% for AGIs $50k-75k, 2.2% for AGIs $75k-100k, 2.3% for AGIs $100k-200k, 1.1% for AGIs over 200k)
Taxable individual retirement arrangement distribution: $11,184 (reported on 3.5% of returns)
90016:
$11,184
California:
$19,557
(% of AGI for various income ranges: 0.8% for AGIs below $25k, 0.7% for AGIs $25k-50k, 1.3% for AGIs $50k-75k, 1.4% for AGIs $75k-100k, 2.1% for AGIs $100k-200k)
Self-employment retirement plans: $9,900 (reported on 0.2% of returns)
90016:
$9,900
California:
$24,530
Total itemized deductions: $21,175 (31% of AGI, reported on 25.6% of returns)
Here:
$21,175
State:
$34,004
Here:
30.9% of AGI
State:
22.7% of AGI
(% of AGI for various income ranges: 7.8% for AGIs below $25k, 12.5% for AGIs $25k-50k, 17.8% for AGIs $50k-75k, 21.1% for AGIs $75k-100k, 20.3% for AGIs $100k-200k, 16.4% for AGIs over 200k)
Charity contributions: $3,317 (reported on 20.8% of returns)
Here:
$3,317
State:
$4,659
(% of AGI for various income ranges: 0.7% for AGIs below $25k, 1.6% for AGIs $25k-50k, 2.3% for AGIs $50k-75k, 2.6% for AGIs $75k-100k, 2.8% for AGIs $100k-200k, 2.8% for AGIs over 200k)
Taxes paid: $6,070 (reported on 25.5% of returns)
90016:
$6,070
State:
$14,448
(% of AGI for various income ranges: 1.4% for AGIs below $25k, 2.5% for AGIs $25k-50k, 4.6% for AGIs $50k-75k, 7.3% for AGIs $75k-100k, 7.2% for AGIs $100k-200k, 8.2% for AGIs over 200k)
Earned income credit: $2,464 (reported on 30.3% of returns)
Here:
$2,464
State:
$2,286
(% of AGI for various income ranges: 9.2% for AGIs below $25k, 1.3% for AGIs $25k-50k)
Percentage of individuals using paid preparers for their 2012 taxes: 72.2%
Here:
72%
State:
64%
(% for various income ranges: 72.2% for AGIs below $25k, 72.1% for AGIs $25k-50k, 72.1% for AGIs $50k-75k, 72.2% for AGIs $75k-100k, 72.7% for AGIs $100k-200k, 83.3% for AGIs over 200k)
Averages for the 2004 tax year for zip code 90016, filed in 2005:
Average Adjusted Gross Income (AGI) in 2004: $29,590 (Individual Income Tax Returns)
Here:
$29,590
State:
$58,600
Salary/wage: $29,415 (reported on 83.6% of returns)
Here:
$29,415
State:
$49,455
(% of AGI for various income ranges: 83.8% for AGIs below $10k, 80.6% for AGIs $10k-25k, 88.2% for AGIs $25k-50k, 86.0% for AGIs $50k-75k, 83.8% for AGIs $75k-100k, 66.9% for AGIs over 100k)
Taxable interest for individuals: $791 (reported on 27.5% of returns)
This zip code:
$791
California:
$2,365
(% of AGI for various income ranges: 2.0% for AGIs below $10k, 0.6% for AGIs $10k-25k, 0.5% for AGIs $25k-50k, 0.7% for AGIs $50k-75k, 0.7% for AGIs $75k-100k, 1.5% for AGIs over 100k)
Taxable dividends: $1,383 (reported on 7.6% of returns)
Here:
$1,383
State:
$4,746
(% of AGI for various income ranges: 0.6% for AGIs below $10k, 0.3% for AGIs $10k-25k, 0.2% for AGIs $25k-50k, 0.4% for AGIs $50k-75k, 0.6% for AGIs $75k-100k, 0.8% for AGIs over 100k)
Net capital gain/loss: +$5,596 (reported on 5.7% of returns)
Here:
+$5,596
State:
+$23,418
(% of AGI for various income ranges: -0.5% for AGIs below $10k, -0.0% for AGIs $10k-25k, 0.2% for AGIs $25k-50k, 0.5% for AGIs $50k-75k, 0.9% for AGIs $75k-100k, 7.0% for AGIs over 100k)
Profit/loss from business: +$7,011 (reported on 18.6% of returns)
Here:
+$7,011
State:
+$16,826
(% of AGI for various income ranges: 23.2% for AGIs below $10k, 9.7% for AGIs $10k-25k, 2.8% for AGIs $25k-50k, 1.7% for AGIs $50k-75k, 0.4% for AGIs $75k-100k, 2.7% for AGIs over 100k)
IRA payment deduction: $2,089 (reported on 1.3% of returns)
90016:
$2,089
California:
$3,192
(% of AGI for various income ranges: 0.1% for AGIs below $10k, 0.1% for AGIs $10k-25k, 0.1% for AGIs $25k-50k, 0.1% for AGIs $50k-75k, 0.0% for AGIs $75k-100k, 0.1% for AGIs over 100k)
Self-employed pension: $8,024 (reported on 0.2% of returns)
Here:
$8,024
California:
$17,688
Total itemized deductions: $18,955 (36% of AGI, reported on 28.9% of returns)
Here:
$18,955
State:
$28,113
Here:
36.5% of AGI
State:
25.3% of AGI
(% of AGI for various income ranges: 14.1% for AGIs below $10k, 9.7% for AGIs $10k-25k, 17.6% for AGIs $25k-50k, 23.6% for AGIs $50k-75k, 24.7% for AGIs $75k-100k, 24.0% for AGIs over 100k)
Charity contributions deductions: $3,183 (6% of AGI, reported on 25.1% of returns)
Here:
$3,183
State:
$3,923
Here:
5.8% of AGI
State:
3.3% of AGI
(% of AGI for various income ranges: 0.9% for AGIs below $10k, 1.1% for AGIs $10k-25k, 2.5% for AGIs $25k-50k, 3.8% for AGIs $50k-75k, 4.0% for AGIs $75k-100k, 3.6% for AGIs over 100k)
Total tax: $3,234 (reported on 64.9% of returns)
90016:
$3,234
State:
$10,761
(% of AGI for various income ranges: 5.4% for AGIs below $10k, 3.5% for AGIs $10k-25k, 5.3% for AGIs $25k-50k, 8.6% for AGIs $50k-75k, 10.0% for AGIs $75k-100k, 14.3% for AGIs over 100k)
Earned income credit: $1,993 (reported on 31.5% of returns)
Here:
$1,993
State:
$1,763
Percentage of individuals using paid preparers for their 2004 taxes: 75.8%
Here:
76%
State:
66%
(% for various income ranges: 70.4% for AGIs below $10k, 78.4% for AGIs $10k-25k, 76.0% for AGIs $25k-50k, 75.8% for AGIs $50k-75k, 76.0% for AGIs $75k-100k, 78.6% for AGIs over 100k)
Likely homosexual households (counted as self-reported same-sex unmarried-partner households)
Lesbian couples: 0.0% of all households
Gay men: 0.4% of all households
Household received Food Stamps/SNAP in the past 12 months: 3,188 Household did not receive Food Stamps/SNAP in the past 12 months: 14,915
Women who had a birth in the past 12 months: 435 (263 now married, 173 unmarried) Women who did not have a birth in the past 12 months: 11,724 (3,913 now married, 7,841 unmarried)
Housing units in zip code 90016 with a mortgage: 4,703 (337 second mortgage, 316 both second mortgage and home equity loan) Houses without a mortgage: 163
Median monthly owner costs for units with a mortgage: $2,647 Median monthly owner costs for units without a mortgage: $675
Residents with income below the poverty level in 2022:
This zip code:
15.3%
Whole state:
12.2%
Residents with income below 50% of the poverty level in 2022:
This zip code:
8.9%
Whole state:
6.2%
Median number of rooms in houses and condos:
Here:
5.2
State:
6.0
Median number of rooms in apartments:
Here:
3.6
State:
3.9
Notable locations in this zip code not listed on our city pages
Churches in zip code 90016 include: Triedstone Baptist Church (A), West Adams Foursquare Church (B), Baldwin Hills Baptist Church (C), Hope Memorial Lutheran Church (D), Kingdom Hall of Jehovahs Witnesses (E), Messiah Baptist Church (F), Southern Missionary Baptist Church (G), Calvary Methodist Episcopal Church (H), Saint Agathas Roman Catholic Church (I). Display/hide their locations on the map
Parks in zip code 90016 include: Baldwin Hills Playground (1), Vineyard Playground (2), Baldwin Hills Recreation Center (3), Rancho Cienega Recreation Center (4), Vineyard Recreation Center (5), Genesee Avenue Park (6), Westside Park (7), Baldwin Hills Village (8). Display/hide their locations on the map
4,320 married couples with children.
3,958 single-parent households (1,102 men, 2,856 women).
43.2% of residents of 90016 zip code speak English at home.
50.0% of residents speak Spanish at home (63% very well, 19% well, 14% not well, 4% not at all).
2.0% of residents speak other Indo-European language at home (89% very well, 6% well, 5% not well).
2.3% of residents speak Asian or Pacific Island language at home (62% very well, 20% well, 13% not well, 5% not at all).
2.2% of residents speak other language at home (87% very well, 7% well, 5% not well, 1% not at all).
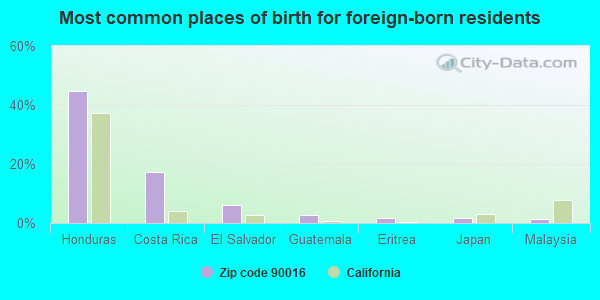
Foreign born population: 14,653 (31.2%) (45.3% of them are naturalized citizens)
Major facilities with environmental interests located in this zip code:
LAUSD CIENEGA ELEM SCHOOL (2611 S ORANGE DR in LOS ANGELES, CA)
STATE MASTER (California - Hazardous Waste Tracking) - HAZARDOU WASTE PROGRAM COMPLIANCE ACTIVITY (Tracking inspections of insecticide, fungicide, and rodenticide, and toxic substances) (National Center for Education Statistics) - STATE ID-6016489 Small Quantity Generators, between 100 kg and 1000 kg of hazardous waste/month (Resource Conservation and Recovery Act (tracking hazardous waste)) - notification Organizations: LOS ANGELES UNIFIED (SCHOOL DISTRICT)
Alternative names: CIENEGA ELEMENTARY SCHOOL
GEBE ELECTRONIC SERVICES INC (4112 W JEFFERSON BLVD in LOS ANGELES, CA)
STATE MASTER (California - Hazardous Waste Tracking) - HAZARDOU WASTE PROGRAM CRITERIA AND HAZARDOUS AIR POLLUTANT INVENTORY (Inventory of air pollution sources) HAZARDOUS WASTE BIENNIAL REPORTER (Resource Conservation and Recovery Act (tracking hazardous waste)) Large Quantity Generators, more that 1000 kg of hazardous waste/month (Resource Conservation and Recovery Act (tracking hazardous waste)) Business SIC classification: ELECTROPLATING, PLATING, POLISHING, ANODIZING, AND COLORING Business NAICS classification: METAL COATING, ENGRAVING (EXCEPT JEWELRY AND SILVERWARE), AND ALLIED SERVICES TO MANUFACTURERS.; ALL OTHER MISCELLANEOUS FABRICATED METAL PRODUCT MANUFACTURING. Organizations: GEBE ELECTRONICS SERVICES (CONTACT/OPERATOR)
, RICHARD FERGUS (CONTACT/OWNER)
LAUSD VIRGINIA ELEM SCHOOL (2925 VIRGINIA RD in LOS ANGELES, CA)
STATE MASTER (California - Hazardous Waste Tracking) - HAZARDOU WASTE PROGRAM Small Quantity Generators, between 100 kg and 1000 kg of hazardous waste/month (Resource Conservation and Recovery Act (tracking hazardous waste)) - notification Alternative names: LAUSD/ VIRGINIA ROAD ELEM, VIRGINIA ROAD ELEMENTARY
LA USD DORSEY HIGH SCHOOL (3537 FARMDALE AVE in LOS ANGELES, CA)
STATE MASTER (California - Hazardous Waste Tracking) - HAZARDOU WASTE PROGRAM Small Quantity Generators, between 100 kg and 1000 kg of hazardous waste/month (Resource Conservation and Recovery Act (tracking hazardous waste)) - notification Alternative names: DORSEY (SUSAN MILLER) SENIOR H
LA MICROWAVE STATION (4201 S LA BREA AVE in LOS ANGELES, CA)
STATE MASTER (California - Hazardous Waste Tracking) - HAZARDOU WASTE PROGRAM Small Quantity Generators, between 100 kg and 1000 kg of hazardous waste/month (Resource Conservation and Recovery Act (tracking hazardous waste)) - notification Organizations: CITY OF LOS ANGELES (CONTACT/OWNER)
Alternative names: CITY OF LA GENERAL SERVICES
ITALMOND (5181 W ADAMS BLVD in LOS ANGELES, CA)
STATE MASTER (California - Hazardous Waste Tracking) - HAZARDOU WASTE PROGRAM Small Quantity Generators, between 100 kg and 1000 kg of hazardous waste/month (Resource Conservation and Recovery Act (tracking hazardous waste)) - notification Organizations: DAVID POURBABA (CONTACT/OWNER)
AMERICAN MEDICAL RESPONSE (5420 W JEFFERSON BLVD in LOS ANGELES, CA) . Federal Facility
STATE MASTER (California - Hazardous Waste Tracking) - HAZARDOU WASTE PROGRAM Small Quantity Generators, between 100 kg and 1000 kg of hazardous waste/month (Resource Conservation and Recovery Act (tracking hazardous waste)) - notification Business NAICS classification: ALL OTHER TRANSIT AND GROUND PASSENGER TRANSPORTATION. Organizations: ANN JOSHINAGA (CONTACT/OWNER)
Alternative names: GOODHEW AMBULANCE SERVICE
BY TAYLOR INC (5017 W JEFFERSON in LOS ANGELES, CA)
STATE MASTER (California - Hazardous Waste Tracking) - HAZARDOU WASTE PROGRAM Small Quantity Generators, between 100 kg and 1000 kg of hazardous waste/month (Resource Conservation and Recovery Act (tracking hazardous waste)) - notification Organizations: SANDRA TAYLOR (CONTACT/OWNER)
CHEVRON STATION 9 2178 (3742 S LA BREA AVE in LOS ANGELES, CA)
STATE MASTER (California - Hazardous Waste Tracking) - HAZARDOU WASTE PROGRAM Small Quantity Generators, between 100 kg and 1000 kg of hazardous waste/month (Resource Conservation and Recovery Act (tracking hazardous waste)) - notification Organizations: CHEVRON USA PRODUCTS CO (CONTACT/OWNER)
Alternative names: CHEVRON 92178
MARVIN ELEMENTARY (2411 MARVIN AVE. in LOS ANGELES, CA)
(National Center for Education Statistics) - STATE ID-6018071 Organizations: LOS ANGELES UNIFIED (SCHOOL DISTRICT)
BALDWIN HILLS ELEMENTARY (5421 RODEO ROAD in LOS ANGELES, CA)
(National Center for Education Statistics) - STATE ID-6015929 Organizations: LOS ANGELES UNIFIED (SCHOOL DISTRICT)
CHEVRON USA CULVER CITY SPLY SITE (6000 W JEFFERSON BLVD in LOS ANGELES, CA)
Small Quantity Generators, between 100 kg and 1000 kg of hazardous waste/month (Resource Conservation and Recovery Act (tracking hazardous waste)) HAZARDOUS WASTE BIENNIAL REPORTER (Resource Conservation and Recovery Act (tracking hazardous waste)) Large Quantity Generators, more that 1000 kg of hazardous waste/month (Resource Conservation and Recovery Act (tracking hazardous waste)) Alternative names: 1001507 CULVER CITY TERMINAL, CHEVRON USA INC CULVER CITY TERM
EXXONMOBIL OIL CORP NO 10916 (1925 CRENSHAW BLVD in LOS ANGELES, CA)
Large Quantity Generators, more that 1000 kg of hazardous waste/month (Resource Conservation and Recovery Act (tracking hazardous waste)) Organizations: EXXONMOBIL OIL CORPORATION (CONTACT/OPERATOR)
Housing units lacking complete plumbing facilities: 0.6% Housing units lacking complete kitchen facilities: 2.5%
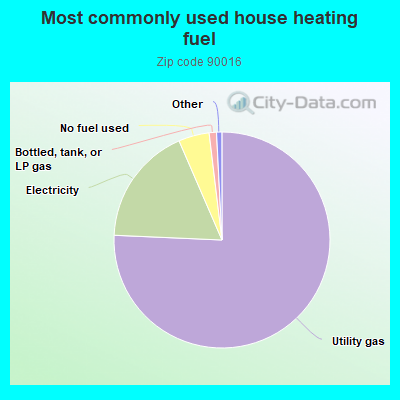
75.7%Utility gas
17.8%Electricity
4.6%No fuel used
1.1%Bottled, tank, or LP gas
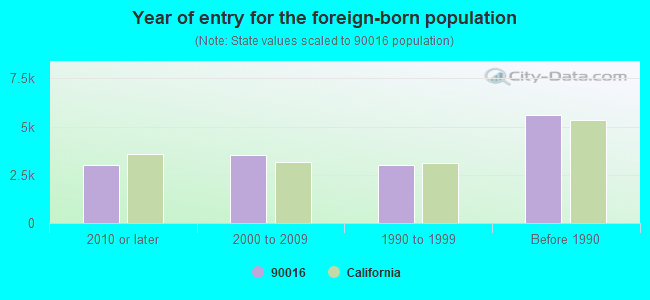
Population in 1990: 43,669. Population change in the 1990s: +3,299 (+7.6%).
Place of birth for U.S.-born residents:
This state: 24,784
Northeast: 1,385
Midwest: 1,804
South: 2,854
West: 865
58% of the 90016 zip code residents lived in the same house 5 years ago. Out of people who lived in different houses, 91% lived in this county. Out of people who lived in different counties, 50% lived in California.
93% of the 90016 zip code residents lived in the same house 1 year ago. Out of people who lived in different houses, 74% moved from this county. Out of people who lived in different houses, 7% moved from different county within same state. Out of people who lived in different houses, 14% moved from different state. Out of people who lived in different houses, 5% moved from abroad.
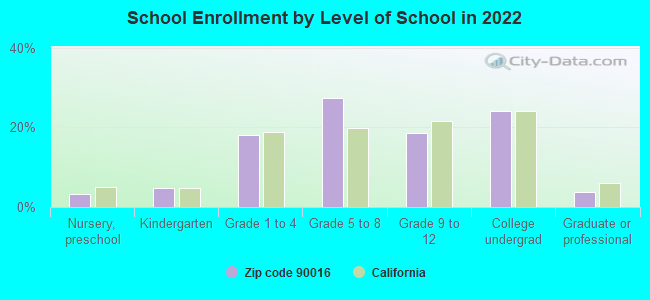
Private vs. public school enrollment:
Students in private schools in grades 1 to 8 (elementary and middle school): 368
Here:
7.8%
California:
10.5%
Students in private schools in grades 9 to 12 (high school): 131
Here:
6.8%
California:
8.5%
Students in private undergraduate colleges: 208
Here:
8.4%
California:
15.9%
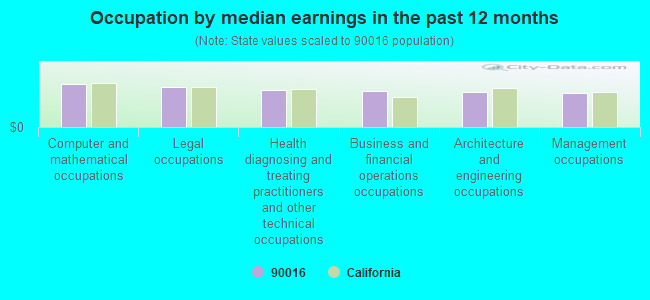
Occupation by median earnings in the past 12 months ($)
103,584Computer and mathematical occupations
95,237Legal occupations
88,728Health diagnosing and treating practitioners and other technical occupations
85,275Business and financial operations occupations
84,550Architecture and engineering occupations
81,544Management occupations
Companies with federal contracts located in this zip code (LOS ANGELES, CA):
SYSTEM TECHNICAL SUPPORT CORPO (3327 LA CIENEGA PL; small business) 1000 employees, $0 revenue. Hist. Underutilized Business Zone (HUBZone) Firm: $30,257,015 in 557 contractsfrom 1999 to 2006
Contracts for Miscellaneous Vehicular Components, Miscellaneous Power Transmission Equipment, Electrical Control Equipment, Airframe Structural Components, and moreby Defense Logistics Agency, Army, Air Force, Navy, and others Signed by year:2000: $4,820,894; 2001: $4,182,436; 2002: $3,776,593; 2003: $3,794,716; 2004: $4,416,702; 2005: $6,673,673; 2006: $2,320,630.
Biggest contracts:
$1,109,625 with Defense Logistics Agency for Miscellaneous Vehicular Components. Signed on 2005-11-22. Completion date: 2006-07-27.
$868,000, same as above.Signed on 2003-12-02. Completion date: 2004-06-30.
$625,090 with Army for Miscellaneous Power Transmission Equipment. Signed on 2000-07-27. Completion date: 2001-06-30.
$572,700 with Army for Electrical Control Equipment. Signed on 2006-04-03. Completion date: 2006-11-15.
PERT CONSTRUCTION CO INC (4566 W WASHINGTON BLVD; small business) : $2,320,406 in 41 contractsfrom 2001 to 2004
Contracts for Construction of Structures and Facilities -- Parking Facilities Conservation, Construction of Structures and Facilities -- Other Non-Building Facilities, Maintenance, Repair or Alteration of Real Property -- Office Buildings, Maintenance, Repair or Alteration of Real Property -- Miscellaneous Buildings, and moreby Navy, Army Signed by year:2000: $0; 2001: $1,056,285; 2002: $487,820; 2003: $489,291; 2004: $287,010; 2005: $0; 2006: $0.
Biggest contracts:
$479,999 with Navy for Construction of Structures and Facilities -- Parking Facilities Conservation. Signed on 2001-09-25. Completion date: 2002-04-15.
$456,000 with Navy for Construction of Structures and Facilities -- Other Non-Building Facilities. Signed on 2002-09-23. Completion date: 2003-04-08.
$271,731 with Army for Maintenance, Repair or Alteration of Real Property -- Office Buildings. Signed on 2001-09-24. Completion date: 2001-10-15.
$127,055 with Navy for Maintenance, Repair or Alteration of Real Property -- Miscellaneous Buildings. Signed on 2001-10-01. Completion date: 2002-04-01.
COAST/ADVANCED CHIP MAGNETICS, (5301 W WASHINGTON BLVD; small business) : $642,350 in 62 contractsfrom 2000 to 2006
Contracts for Filters and Networks, Coils and Transformers, Engine Electrical System Components, Aircraft Prime Moving, Aircraft Air Conditioning, Heating, and Pressurizing Equipment by Defense Logistics Agency, Army Signed by year:2000: $41,580; 2001: $0; 2002: $118,975; 2003: $7,700; 2004: $194,932; 2005: $251,702; 2006: $27,461.
Biggest contracts:
$61,295 with Defense Logistics Agency for Filters and Networks. Signed on 2005-07-30. Completion date: 2005-11-27.
$57,120, same as above.Signed on 2002-06-28. Completion date: 2002-12-25.
$41,580, same as above.Signed on 2000-11-27. Completion date: 2001-07-05.
$36,300 with Defense Logistics Agency for Coils and Transformers. Signed on 2002-03-13. Completion date: 2002-09-18.
JEFFERSON PARTS, INC (3327 LA CIENEGA PL; small business) 50 employees, $0 revenue. : $168,242 in 9 contractsfrom 2004 to 2006
Contracts for Vehicular Brake, Steering, Axle, Wheel, and Track Components, Miscellaneous Machine Tools, Miscellaneous Vehicular Components, Vehicular Power Transmission Components, and moreby Army, Navy, Air Force Signed by year:2000: $0; 2001: $0; 2002: $0; 2003: $0; 2004: $750; 2005: $129,212; 2006: $38,280.
Biggest contracts:
$49,000 with Army for Vehicular Brake, Steering, Axle, Wheel, and Track Components. Signed on 2005-03-28. Completion date: 2005-07-29.
$44,750 with Navy for Miscellaneous Machine Tools. Signed on 2005-11-01. Completion date: 2006-03-01.
$25,084 with Army for Miscellaneous Vehicular Components. Signed on 2005-02-23. Completion date: 2005-05-04.
$16,430 with Army for Vehicular Power Transmission Components. Signed on 2006-03-08. Completion date: 2006-07-14.
AMI/COAST MAGNETICS (5333 W WASHINGTON BLVD; small business) : $34,650 in 2 contractsfrom 2000 to 2004
$32,760 with Defense Logistics Agency for Coils and Transformers. Signed on 2000-06-19. Completion date: 2001-01-26.
$1,890 with Army for Coils and Transformers. Signed on 2004-05-20. Completion date: 2004-09-20.
VICTOR WIRE AND CABLE CORP (3601 HOLDREGE AVENUE; small business) : $11,692 in 8 contractsfrom 2003 to 2005
Contracts for Wire and Cable, Electrical, Miscellaneous Electrical and Electronic Components by Navy, Bureau of Prisoners/Federal Prison System Signed by year:2000: $0; 2001: $0; 2002: $0; 2003: $3,000; 2004: $5,000; 2005: $3,692; 2006: $0.
Biggest contracts:
$3,692 with Navy for Wire and Cable, Electrical. Signed on 2005-09-09. Completion date: 2005-11-14.
$3,000 with Bureau of Prisoners/Federal Prison System for Miscellaneous Electrical and Electronic Components. Signed on 2004-02-26. Completion date: 2008-02-26.
$1,000, same as above.Signed on 2003-10-06. Completion date: 2008-02-06.
$1,000, same as above.Signed on 2004-06-07. Completion date: 2008-02-28.
Top industries in this zip code by the number of employees in 2005:
2005 - 2018 National Fire Incident Reporting System (NFIRS) incidents
According to the data from the years 2005 - 2018 the average number of fires per year is 124. The highest number of fire incidents - 191 took place in 2005, and the least - 79 in 2012. The data has a decreasing trend.
When looking into fire subcategories, the most incidents belonged to: Structure Fires (45.1%), and Mobile Property/Vehicle Fires (27.0%).
Fire incident types reported to NFIRS in Zip Code 90016


 Nearest zip codes: 90008, 90019, 90018, 90035, 90232, 90036.


 According to the data from the years 2005 - 2018 the average number of fires per year is 124. The highest number of fire incidents - 191 took place in 2005, and the least - 79 in 2012. The data has a decreasing trend.
 When looking into fire subcategories, the most incidents belonged to: Structure Fires (45.1%), and Mobile Property/Vehicle Fires (27.0%).