Estimated zip code population in 2022: 58,916 Zip code population in 2010: 64,458 Zip code population in 2000: 67,510
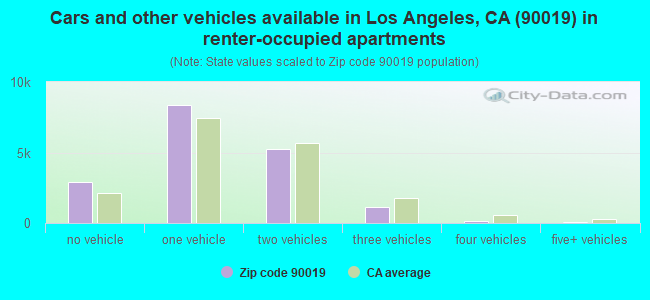
Houses and condos: 26,387 Renter-occupied apartments: 17,910
% of renters here:
75%
State:
44%
March 2022 cost of living index in zip code 90019: 150.6 (very high, U.S. average is 100)
Land area: 3.9 sq. mi. Water area: 0.0 sq. mi.
Population density: 15,153 people per square mile
(very high).
OSM Map
General Map
Google Map
MSN Map
OSM Map
General Map
Google Map
MSN Map
OSM Map
General Map
Google Map
MSN Map
OSM Map
General Map
Google Map
MSN Map
Please wait while loading the map...
Real estate property taxes paid for housing units in 2022:
This zip code:
0.5% ($6,446)
California:
0.7% ($4,831)
Median real estate property taxes paid for housing units with mortgages in 2022: $7,785 (0.6%) Median real estate property taxes paid for housing units with no mortgage in 2022: $3,656 (0.3%)
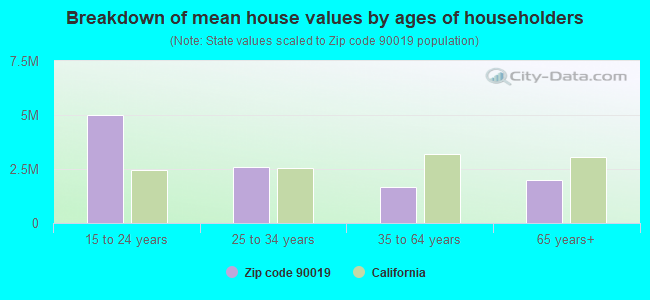
Estimated median house/condo value in 2022: $1,250,355
90019:
$1,250,355
California:
$715,900
According to our research of California and other state lists, there were 80 registered sex offenders living in 90019 zip code as of April 26, 2024. The ratio of all residents to sex offenders in zip code 90019 is 869 to 1. The ratio of registered sex offenders to all residents in this zip code is near the state average.
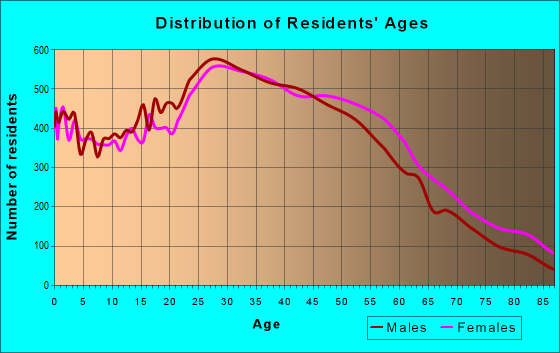
Median resident age:
This zip code:
39.4 years
California median age:
37.9 years
Average household size:
This zip code:
2.4 people
California:
2.8 people
Averages for the 2020 tax year for zip code 90019, filed in 2021:
Average Adjusted Gross Income (AGI) in 2020: $62,907 (Individual Income Tax Returns)
Here:
$62,907
State:
$95,910
Salary/wage: $57,706 (reported on 78.4% of returns)
Here:
$57,706
State:
$77,331
(% of AGI for various income ranges: 1202.0% for AGIs below $25k, 4171.9% for AGIs $25k-50k, 7859.9% for AGIs $50k-75k, 11789.6% for AGIs $75k-100k, 21807.6% for AGIs $100k-200k, 102382.2% for AGIs over 200k)
Taxable interest for individuals: $1,094 (reported on 23.0% of returns)
This zip code:
$1,094
California:
$2,294
(% of AGI for various income ranges: 9.8% for AGIs below $25k, 12.0% for AGIs $25k-50k, 38.1% for AGIs $50k-75k, 55.8% for AGIs $75k-100k, 125.6% for AGIs $100k-200k, 718.5% for AGIs over 200k)
Ordinary dividends: $4,838 (reported on 14.2% of returns)
Here:
$4,838
State:
$10,949
(% of AGI for various income ranges: 10.7% for AGIs below $25k, 17.7% for AGIs $25k-50k, 56.3% for AGIs $50k-75k, 86.8% for AGIs $75k-100k, 313.1% for AGIs $100k-200k, 3048.3% for AGIs over 200k)
Net capital gain/loss in AGI: +$17,244 (reported on 14.6% of returns)
Here:
+$17,244
State:
+$49,306
(% of AGI for various income ranges: 10.1% for AGIs below $25k, 20.7% for AGIs $25k-50k, 82.5% for AGIs $50k-75k, 165.2% for AGIs $75k-100k, 655.6% for AGIs $100k-200k, 15003.2% for AGIs over 200k)
Profit/loss from business: +$11,153 (reported on 28.0% of returns)
Here:
+$11,153
State:
+$15,671
(% of AGI for various income ranges: 338.8% for AGIs below $25k, 265.2% for AGIs $25k-50k, 351.6% for AGIs $50k-75k, 632.5% for AGIs $75k-100k, 1104.4% for AGIs $100k-200k, 6230.2% for AGIs over 200k)
Taxable individual retirement arrangement distribution: $18,026 (reported on 2.9% of returns)
90019:
$18,026
California:
$23,505
(% of AGI for various income ranges: 15.8% for AGIs below $25k, 27.3% for AGIs $25k-50k, 60.5% for AGIs $50k-75k, 159.4% for AGIs $75k-100k, 348.7% for AGIs $100k-200k, 1226.1% for AGIs over 200k)
Self-employed (Keogh) retirement plans: $24,817 (reported on 0.8% of returns)
90019:
$24,817
California:
$30,163
(% of AGI for various income ranges: 3.0% for AGIs $25k-50k, 20.7% for AGIs $50k-75k, 67.3% for AGIs $100k-200k, 1001.5% for AGIs over 200k)
Total itemized deductions: $32,680 (reported on 10.3% of returns)
Here:
$32,680
State:
$39,517
(% of AGI for various income ranges: 64.5% for AGIs below $25k, 144.2% for AGIs $25k-50k, 443.1% for AGIs $50k-75k, 925.7% for AGIs $75k-100k, 2040.4% for AGIs $100k-200k, 9694.1% for AGIs over 200k)
Charity contributions: $7,178 (reported on 8.4% of returns)
Here:
$7,178
State:
$12,598
(% of AGI for various income ranges: 3.9% for AGIs below $25k, 13.6% for AGIs $25k-50k, 67.3% for AGIs $50k-75k, 163.0% for AGIs $75k-100k, 349.4% for AGIs $100k-200k, 2162.2% for AGIs over 200k)
Taxes paid: $8,291 (reported on 10.3% of returns)
90019:
$8,291
State:
$8,807
(% of AGI for various income ranges: 15.0% for AGIs below $25k, 32.8% for AGIs $25k-50k, 99.6% for AGIs $50k-75k, 264.0% for AGIs $75k-100k, 608.4% for AGIs $100k-200k, 2202.4% for AGIs over 200k)
Earned income credit: $1,742 (reported on 16.8% of returns)
Here:
$1,742
State:
$2,074
(% of AGI for various income ranges: 89.1% for AGIs below $25k, 53.0% for AGIs $25k-50k, 0.6% for AGIs $50k-75k)
Percentage of individuals using paid preparers for their 2020 taxes: 91.1%
Here:
91%
State:
92%
(% for various income ranges: 87.9% for AGIs below $25k, 92.4% for AGIs $25k-50k, 92.9% for AGIs $50k-75k, 92.3% for AGIs $75k-100k, 93.9% for AGIs $100k-200k, 96.8% for AGIs over 200k)
Averages for the 2012 tax year for zip code 90019, filed in 2013:
Average Adjusted Gross Income (AGI) in 2012: $43,438 (Individual Income Tax Returns)
Here:
$43,438
State:
$72,726
Salary/wage: $41,309 (reported on 80.5% of returns)
Here:
$41,309
State:
$59,079
(% of AGI for various income ranges: 71.5% for AGIs below $25k, 84.7% for AGIs $25k-50k, 83.2% for AGIs $50k-75k, 79.6% for AGIs $75k-100k, 77.9% for AGIs $100k-200k, 62.0% for AGIs over 200k)
Taxable interest for individuals: $797 (reported on 22.2% of returns)
This zip code:
$797
California:
$2,146
(% of AGI for various income ranges: 0.4% for AGIs below $25k, 0.2% for AGIs $25k-50k, 0.3% for AGIs $50k-75k, 0.5% for AGIs $75k-100k, 0.4% for AGIs $100k-200k, 0.7% for AGIs over 200k)
Ordinary dividends: $3,496 (reported on 9.1% of returns)
Here:
$3,496
State:
$9,308
(% of AGI for various income ranges: 0.5% for AGIs below $25k, 0.3% for AGIs $25k-50k, 0.4% for AGIs $50k-75k, 1.0% for AGIs $75k-100k, 0.9% for AGIs $100k-200k, 1.4% for AGIs over 200k)
Net capital gain/loss in AGI: +$8,688 (reported on 8.0% of returns)
Here:
+$8,688
State:
+$30,460
(% of AGI for various income ranges: 0.1% for AGIs $50k-75k, 0.4% for AGIs $75k-100k, 1.4% for AGIs $100k-200k, 7.0% for AGIs over 200k)
Profit/loss from business: +$11,940 (reported on 25.8% of returns)
Here:
+$11,940
State:
+$17,064
(% of AGI for various income ranges: 19.3% for AGIs below $25k, 6.1% for AGIs $25k-50k, 4.0% for AGIs $50k-75k, 4.1% for AGIs $75k-100k, 4.6% for AGIs $100k-200k, 5.5% for AGIs over 200k)
Taxable individual retirement arrangement distribution: $11,764 (reported on 3.3% of returns)
90019:
$11,764
California:
$19,557
(% of AGI for various income ranges: 0.8% for AGIs below $25k, 0.6% for AGIs $25k-50k, 1.1% for AGIs $50k-75k, 1.4% for AGIs $75k-100k, 1.1% for AGIs $100k-200k, 0.5% for AGIs over 200k)
Self-employment retirement plans: $18,594 (reported on 0.6% of returns)
90019:
$18,594
California:
$24,530
(% of AGI for various income ranges: 0.2% for AGIs $25k-50k, 0.2% for AGIs $75k-100k, 0.4% for AGIs $100k-200k, 0.8% for AGIs over 200k)
Total itemized deductions: $25,709 (27% of AGI, reported on 24.8% of returns)
Here:
$25,709
State:
$34,004
Here:
26.5% of AGI
State:
22.7% of AGI
(% of AGI for various income ranges: 7.0% for AGIs below $25k, 10.2% for AGIs $25k-50k, 14.7% for AGIs $50k-75k, 18.0% for AGIs $75k-100k, 20.0% for AGIs $100k-200k, 18.4% for AGIs over 200k)
Charity contributions: $3,447 (reported on 20.1% of returns)
Here:
$3,447
State:
$4,659
(% of AGI for various income ranges: 0.5% for AGIs below $25k, 1.2% for AGIs $25k-50k, 1.9% for AGIs $50k-75k, 2.3% for AGIs $75k-100k, 2.1% for AGIs $100k-200k, 1.7% for AGIs over 200k)
Taxes paid: $9,136 (reported on 24.6% of returns)
90019:
$9,136
State:
$14,448
(% of AGI for various income ranges: 1.5% for AGIs below $25k, 2.2% for AGIs $25k-50k, 3.8% for AGIs $50k-75k, 6.0% for AGIs $75k-100k, 7.8% for AGIs $100k-200k, 9.5% for AGIs over 200k)
Earned income credit: $2,131 (reported on 24.6% of returns)
Here:
$2,131
State:
$2,286
(% of AGI for various income ranges: 6.7% for AGIs below $25k, 1.1% for AGIs $25k-50k)
Percentage of individuals using paid preparers for their 2012 taxes: 72.2%
Here:
72%
State:
64%
(% for various income ranges: 72.2% for AGIs below $25k, 71.7% for AGIs $25k-50k, 69.6% for AGIs $50k-75k, 71.4% for AGIs $75k-100k, 75.9% for AGIs $100k-200k, 84.1% for AGIs over 200k)
Averages for the 2004 tax year for zip code 90019, filed in 2005:
Average Adjusted Gross Income (AGI) in 2004: $32,955 (Individual Income Tax Returns)
Here:
$32,955
State:
$58,600
Salary/wage: $33,065 (reported on 80.9% of returns)
Here:
$33,065
State:
$49,455
(% of AGI for various income ranges: 139.6% for AGIs below $10k, 79.7% for AGIs $10k-25k, 86.6% for AGIs $25k-50k, 84.1% for AGIs $50k-75k, 80.6% for AGIs $75k-100k, 70.0% for AGIs over 100k)
Taxable interest for individuals: $926 (reported on 28.8% of returns)
This zip code:
$926
California:
$2,365
(% of AGI for various income ranges: 4.3% for AGIs below $10k, 0.6% for AGIs $10k-25k, 0.7% for AGIs $25k-50k, 0.7% for AGIs $50k-75k, 0.8% for AGIs $75k-100k, 0.9% for AGIs over 100k)
Taxable dividends: $1,745 (reported on 10.8% of returns)
Here:
$1,745
State:
$4,746
(% of AGI for various income ranges: 2.2% for AGIs below $10k, 0.3% for AGIs $10k-25k, 0.4% for AGIs $25k-50k, 0.6% for AGIs $50k-75k, 0.7% for AGIs $75k-100k, 0.9% for AGIs over 100k)
Net capital gain/loss: +$10,465 (reported on 9.1% of returns)
Here:
+$10,465
State:
+$23,418
(% of AGI for various income ranges: 1.2% for AGIs below $10k, 0.2% for AGIs $10k-25k, 0.5% for AGIs $25k-50k, 0.9% for AGIs $50k-75k, 1.9% for AGIs $75k-100k, 9.7% for AGIs over 100k)
Profit/loss from business: +$9,429 (reported on 24.0% of returns)
Here:
+$9,429
State:
+$16,826
(% of AGI for various income ranges: 42.0% for AGIs below $10k, 12.6% for AGIs $10k-25k, 5.1% for AGIs $25k-50k, 3.8% for AGIs $50k-75k, 5.3% for AGIs $75k-100k, 5.4% for AGIs over 100k)
IRA payment deduction: $2,426 (reported on 2.2% of returns)
90019:
$2,426
California:
$3,192
(% of AGI for various income ranges: 0.3% for AGIs below $10k, 0.2% for AGIs $10k-25k, 0.2% for AGIs $25k-50k, 0.1% for AGIs $50k-75k, 0.2% for AGIs $75k-100k, 0.1% for AGIs over 100k)
Self-employed pension: $13,060 (reported on 0.7% of returns)
Here:
$13,060
California:
$17,688
(% of AGI for various income ranges: 0.1% for AGIs $10k-25k, 0.1% for AGIs $25k-50k, 0.2% for AGIs $50k-75k, 0.4% for AGIs $75k-100k, 0.7% for AGIs over 100k)
Total itemized deductions: $21,498 (32% of AGI, reported on 26.4% of returns)
Here:
$21,498
State:
$28,113
Here:
32.0% of AGI
State:
25.3% of AGI
(% of AGI for various income ranges: 26.1% for AGIs below $10k, 8.3% for AGIs $10k-25k, 15.2% for AGIs $25k-50k, 19.4% for AGIs $50k-75k, 23.1% for AGIs $75k-100k, 21.3% for AGIs over 100k)
Charity contributions deductions: $3,338 (5% of AGI, reported on 22.6% of returns)
Here:
$3,338
State:
$3,923
Here:
4.7% of AGI
State:
3.3% of AGI
(% of AGI for various income ranges: 1.4% for AGIs below $10k, 0.9% for AGIs $10k-25k, 2.2% for AGIs $25k-50k, 3.0% for AGIs $50k-75k, 3.1% for AGIs $75k-100k, 2.7% for AGIs over 100k)
Total tax: $4,681 (reported on 70.1% of returns)
90019:
$4,681
State:
$10,761
(% of AGI for various income ranges: 11.8% for AGIs below $10k, 4.3% for AGIs $10k-25k, 6.5% for AGIs $25k-50k, 10.0% for AGIs $50k-75k, 11.6% for AGIs $75k-100k, 17.1% for AGIs over 100k)
Earned income credit: $1,780 (reported on 27.4% of returns)
Here:
$1,780
State:
$1,763
Percentage of individuals using paid preparers for their 2004 taxes: 75.4%
Here:
75%
State:
66%
(% for various income ranges: 72.1% for AGIs below $10k, 78.1% for AGIs $10k-25k, 74.1% for AGIs $25k-50k, 73.8% for AGIs $50k-75k, 76.1% for AGIs $75k-100k, 81.5% for AGIs over 100k)
Likely homosexual households (counted as self-reported same-sex unmarried-partner households)
Lesbian couples: 0.3% of all households
Gay men: 0.8% of all households
Household received Food Stamps/SNAP in the past 12 months: 3,609 Household did not receive Food Stamps/SNAP in the past 12 months: 20,499
Women who had a birth in the past 12 months: 516 (280 now married, 238 unmarried) Women who did not have a birth in the past 12 months: 14,620 (4,374 now married, 10,305 unmarried)
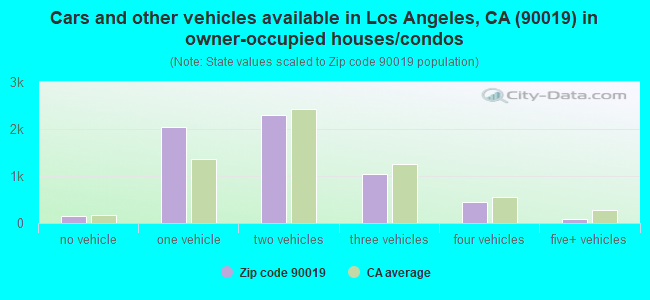
Housing units in zip code 90019 with a mortgage: 4,037 (583 second mortgage, 137 home equity loan, 447 both second mortgage and home equity loan) Houses without a mortgage: 21
Median monthly owner costs for units with a mortgage: $3,649 Median monthly owner costs for units without a mortgage: $814
Residents with income below the poverty level in 2022:
This zip code:
16.9%
Whole state:
12.2%
Residents with income below 50% of the poverty level in 2022:
This zip code:
9.1%
Whole state:
6.2%
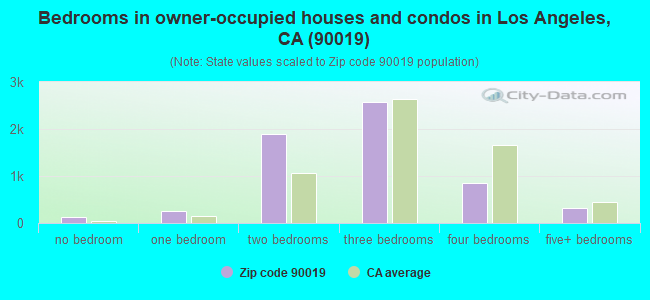
Median number of rooms in houses and condos:
Here:
5.7
State:
6.0
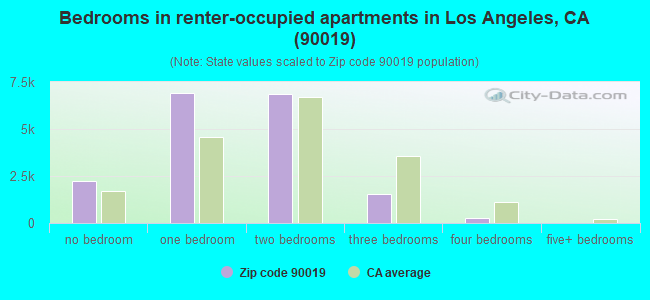
Median number of rooms in apartments:
Here:
3.5
State:
3.9
Notable locations in this zip code not listed on our city pages
Notable locations in zip code 90019: Electrical Sub-Station Number 8 (A), Westside Jewish Community Center (B), Wilshire Community Police Station (C), City of Los Angeles Fire Department Station 68 (D). Display/hide their locations on the map
Churches in zip code 90019 include: Arlington Avenue Christian Church (A), Wilshire Ward Church of Jesus Christ of Latter Day Saints (B), Convent of the Good Shepherd (C), Bethany Baptist Church (D), Church of Divine Guidance (E), First United Presbyterian Church (F), Mount Sinai Baptist Church (G), Saint Gregorys Roman Catholic Church (H), Saint Pauls Methodist Church (I). Display/hide their locations on the map
Parks in zip code 90019 include: Price Playground (1), Eleanor Green Roberts Aquatic Center (2), Los Angeles High Memorial Park (3), Queen Anne Recreation Center (4). Display/hide their locations on the map
Tourist attractions (not listed on the city page) : Amf Midtown Lanes (Amusement & Theme Parks; 4645 Venice Boulevard), Active West Bowling & Recreation Centers (Amusement & Theme Parks; 4645 Venice Boulevard).
4,604 married couples with children.
3,813 single-parent households (1,265 men, 2,548 women).
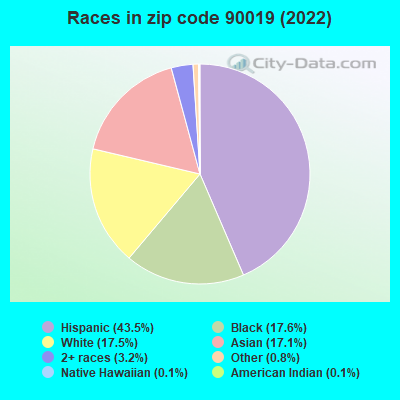
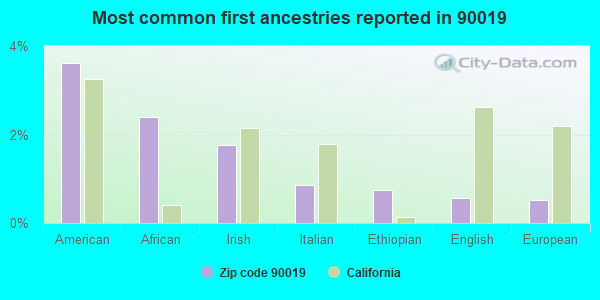
43.1% of residents of 90019 zip code speak English at home.
38.9% of residents speak Spanish at home (49% very well, 20% well, 21% not well, 10% not at all).
2.5% of residents speak other Indo-European language at home (86% very well, 11% well, 4% not well).
13.8% of residents speak Asian or Pacific Island language at home (44% very well, 21% well, 27% not well, 8% not at all).
1.7% of residents speak other language at home (77% very well, 9% well, 8% not well, 6% not at all).
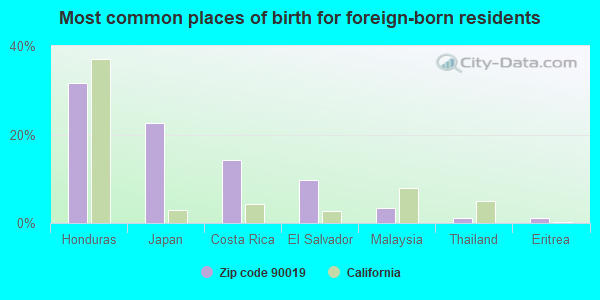
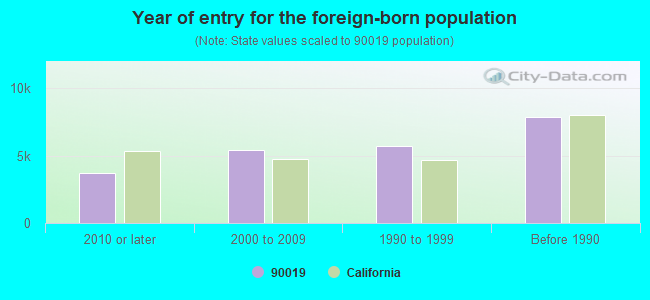
Foreign born population: 22,170 (37.6%) (41.7% of them are naturalized citizens)
Major facilities with environmental interests located in this zip code:
LAUSD-MAINTENANCE & OPERATIONS DIST D (1406 HIGHLAND AVE in LOS ANGELES, CA)
STATE MASTER (California - Hazardous Waste Tracking) - HAZARDOU WASTE PROGRAM HAZARDOUS WASTE BIENNIAL REPORTER (Resource Conservation and Recovery Act (tracking hazardous waste)) Large Quantity Generators, more that 1000 kg of hazardous waste/month (Resource Conservation and Recovery Act (tracking hazardous waste)) Alternative names: MAINTENANCE AND OPERATIONS DIST 2
EXXON MOBIL OIL CORPORATION (3309 WEST OLYMPIC BOULEVARD in LOS ANGELES, CA)
STATE MASTER (California - Hazardous Waste Tracking) - HAZARDOU WASTE PROGRAM Small Quantity Generators, between 100 kg and 1000 kg of hazardous waste/month (Resource Conservation and Recovery Act (tracking hazardous waste)) HAZARDOUS WASTE BIENNIAL REPORTER (Resource Conservation and Recovery Act (tracking hazardous waste)) Large Quantity Generators, more that 1000 kg of hazardous waste/month (Resource Conservation and Recovery Act (tracking hazardous waste)) Alternative names: EXXONMOBIL OIL CORPORATION #11294, MOBIL OIL CORP LLR
1 DAY PAINT AND BODY CENTERS INC (3153 W PICO BLVD in LOS ANGELES, CA)
STATE MASTER (California - Hazardous Waste Tracking) - HAZARDOU WASTE PROGRAM CRITERIA AND HAZARDOUS AIR POLLUTANT INVENTORY (Inventory of air pollution sources) Small Quantity Generators, between 100 kg and 1000 kg of hazardous waste/month (Resource Conservation and Recovery Act (tracking hazardous waste)) Business SIC classification: TOP, BODY, AND UPHOLSTERY REPAIR SHOPS AND PAINT SHOPS Business NAICS classification: AUTOMOTIVE BODY, PAINT, AND INTERIOR REPAIR AND MAINTENANCE.
LAUSD MT VERNON JUNIOR HIGH SCHOOL (4066 W 17TH ST in LOS ANGELES, CA)
STATE MASTER (California - Hazardous Waste Tracking) - HAZARDOU WASTE PROGRAM Small Quantity Generators, between 100 kg and 1000 kg of hazardous waste/month (Resource Conservation and Recovery Act (tracking hazardous waste)) - notification Alternative names: LAUSD/ MOUNT VERNON JH
LA USD ALTA LOMA EL (1745 VINEYARD AVE in LOS ANGELES, CA)
STATE MASTER (California - Hazardous Waste Tracking) - HAZARDOU WASTE PROGRAM Small Quantity Generators, between 100 kg and 1000 kg of hazardous waste/month (Resource Conservation and Recovery Act (tracking hazardous waste)) - notification Alternative names: ALTA LOMA ELEMENTARY
HARRYS CLEANER (5069 W PICO in LOS ANGELES, CA)
STATE MASTER (California - Hazardous Waste Tracking) - HAZARDOU WASTE PROGRAM Small Quantity Generators, between 100 kg and 1000 kg of hazardous waste/month (Resource Conservation and Recovery Act (tracking hazardous waste)) - notification Organizations: BUMIK PARK (CONTACT/OWNER)
LA USD ARLINGTON HTS EL (1717 SEVENTH AVE in LOS ANGELES, CA)
STATE MASTER (California - Hazardous Waste Tracking) - HAZARDOU WASTE PROGRAM Small Quantity Generators, between 100 kg and 1000 kg of hazardous waste/month (Resource Conservation and Recovery Act (tracking hazardous waste)) - notification Alternative names: ARLINGTON HEIGHTS ELEMENTARY, LAUSD/ ARLINGTON HEIGHTS ELEM
LA WILSHIRE ST MAINT YARD (1274 COCHRAN AVE in LOS ANGELES, CA)
STATE MASTER (California - Hazardous Waste Tracking) - HAZARDOU WASTE PROGRAM Small Quantity Generators, between 100 kg and 1000 kg of hazardous waste/month (Resource Conservation and Recovery Act (tracking hazardous waste)) - notification Organizations: CITY OF LOS ANGELES (CONTACT/OWNER)
MEZIAN MOTORS (1015 SOUTH LA BREA AVENUE in LOS ANGELES, CA)
STATE MASTER (California - Hazardous Waste Tracking) - HAZARDOU WASTE PROGRAM Small Quantity Generators, between 100 kg and 1000 kg of hazardous waste/month (Resource Conservation and Recovery Act (tracking hazardous waste)) - notification Organizations: HARRY MEZIAN (CONTACT/OWNER)
Alternative names: HARRY'S AUTO BODY INC
ACE-TECH AUTO CENTER (4334 W PICO BLVD in LOS ANGELES, CA)
STATE MASTER (California - Hazardous Waste Tracking) - HAZARDOU WASTE PROGRAM Small Quantity Generators, between 100 kg and 1000 kg of hazardous waste/month (Resource Conservation and Recovery Act (tracking hazardous waste)) Business NAICS classification: AUTOMOTIVE BODY, PAINT, AND INTERIOR REPAIR AND MAINTENANCE.
CHEVRON 92314 (5240 W VENICE in LOS ANGELES, CA) . Federal Facility
STATE MASTER (California - Hazardous Waste Tracking) - HAZARDOU WASTE PROGRAM Small Quantity Generators, between 100 kg and 1000 kg of hazardous waste/month (Resource Conservation and Recovery Act (tracking hazardous waste)) - notification Organizations: CHEVRON U S A PRODUCTS CO (CONTACT/OWNER)
Alternative names: CHEVRON STATION 9 2314
CHEVRON 91210 (1009 CRENSHAW in LOS ANGELES, CA) . Federal Facility
STATE MASTER (California - Hazardous Waste Tracking) - HAZARDOU WASTE PROGRAM Small Quantity Generators, between 100 kg and 1000 kg of hazardous waste/month (Resource Conservation and Recovery Act (tracking hazardous waste)) - notification Organizations: CHEVRON USA PRODUCTS CO (CONTACT/OWNER)
Alternative names: CHEVRON STATION 9 1210
EQUILON ENTERPRISES LLC (115 S BARRINGTON in LOS ANGELES, CA) . Federal Facility
STATE MASTER (California - Hazardous Waste Tracking) - HAZARDOU WASTE PROGRAM Small Quantity Generators, between 100 kg and 1000 kg of hazardous waste/month (Resource Conservation and Recovery Act (tracking hazardous waste)) - notification Organizations: EQUILON ENTERPRISES L L C (CONTACT/OWNER)
Alternative names: TEXACO SERVICE STATION
Housing units lacking complete plumbing facilities: 0.5% Housing units lacking complete kitchen facilities: 2.6%
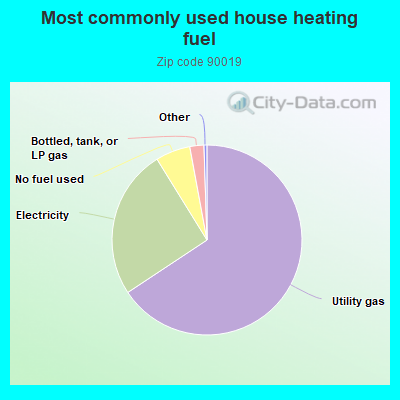
65.7%Utility gas
25.5%Electricity
5.9%No fuel used
2.4%Bottled, tank, or LP gas
Population in 1990: 64,996. Population change in the 1990s: +2,514 (+3.9%).
Place of birth for U.S.-born residents:
This state: 25,300
Northeast: 2,412
Midwest: 2,806
South: 4,083
West: 1,258
55% of the 90019 zip code residents lived in the same house 5 years ago. Out of people who lived in different houses, 88% lived in this county. Out of people who lived in different counties, 50% lived in California.
92% of the 90019 zip code residents lived in the same house 1 year ago. Out of people who lived in different houses, 67% moved from this county. Out of people who lived in different houses, 14% moved from different county within same state. Out of people who lived in different houses, 13% moved from different state. Out of people who lived in different houses, 7% moved from abroad.
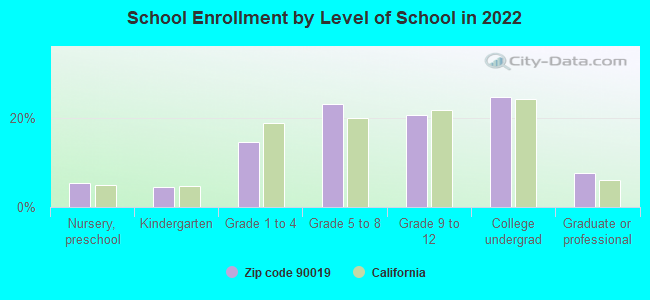
Private vs. public school enrollment:
Students in private schools in grades 1 to 8 (elementary and middle school): 569
Here:
13.4%
California:
10.5%
Students in private schools in grades 9 to 12 (high school): 179
Here:
7.8%
California:
8.5%
Students in private undergraduate colleges: 489
Here:
17.6%
California:
15.9%
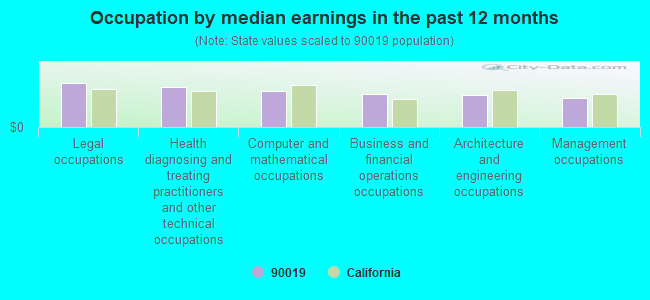
Occupation by median earnings in the past 12 months ($)
121,219Legal occupations
110,898Health diagnosing and treating practitioners and other technical occupations
99,148Computer and mathematical occupations
91,764Business and financial operations occupations
88,112Architecture and engineering occupations
81,137Management occupations
Companies with federal contracts located in this zip code:
GRAPHICS FACTORY, THE (5872 W PICO BLVD STEA in LOS ANGELES, CA; small business)
$28,017 with Air Force for Photographic Developing and Finishing Equipment. Signed on 2000-08-24. Completion date: 2000-09-05.
ANNEX GROUP INC (5470 W PICO BLVD in LOS ANGELES, CA; small business)
$5,245 with Army for Paints, Dopes, Varnishes, and Related Products. Taking place in AZ. Signed on 2004-04-29. Completion date: 2004-05-20.
Top industries in this zip code by the number of employees in 2005:
Health Care and Social Assistance: Nursing Care Facilities (100-249 employees: 2 establishments, 50-99 employees: 1 establishment)
2005 - 2018 National Fire Incident Reporting System (NFIRS) incidents
According to the data from the years 2005 - 2018 the average number of fires per year is 118. The highest number of fire incidents - 164 took place in 2006, and the least - 77 in 2012. The data has a decreasing trend.
When looking into fire subcategories, the most incidents belonged to: Structure Fires (51.1%), and Mobile Property/Vehicle Fires (23.7%).
Fire incident types reported to NFIRS in Zip Code 90019
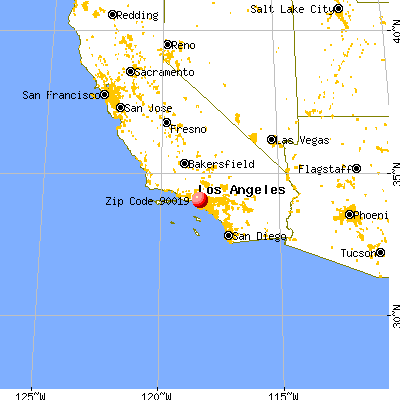


 Nearest zip codes: 90036, 90010, 90016, 90018, 90005, 90020.
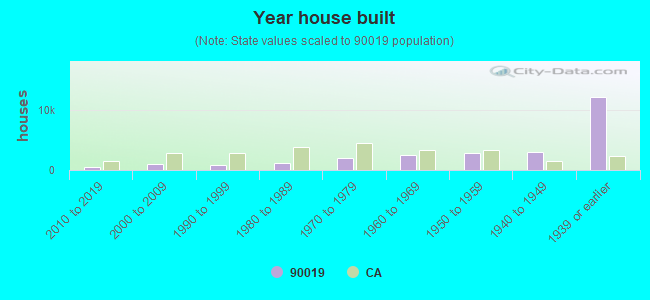


 According to the data from the years 2005 - 2018 the average number of fires per year is 118. The highest number of fire incidents - 164 took place in 2006, and the least - 77 in 2012. The data has a decreasing trend.
 When looking into fire subcategories, the most incidents belonged to: Structure Fires (51.1%), and Mobile Property/Vehicle Fires (23.7%).