Estimated zip code population in 2022: 38,081
Zip code population in 2010: 38,967
Zip code population in 2000: 42,383
Houses and condos: 19,247
Renter-occupied apartments: 15,894
% of renters here:
91%State:
44%
March 2022 cost of living index in zip code 90020: 142.3
(very high, U.S. average is 100)
Land area: 1.1
sq. mi.
Water area: 0.0
sq. mi.
Population density: 33,691 people per square mile (very high).
OSM Map
General Map
Google Map
MSN Map
OSM Map
General Map
Google Map
MSN Map
OSM Map
General Map
Google Map
MSN Map
OSM Map
General Map
Google Map
MSN Map
Please wait while loading the map...
Real estate property taxes paid for housing units in 2022:
This zip code:
0.8% ($6,240)California:
0.7% ($4,831)
Median real estate property taxes paid for housing units with mortgages in 2022: $6,362 (0.8%)
Profiles of local businesses
Business Search - 14 Million verified businesses
Males: 19,000 Females: 19,081
For population 25 years and over in 90020:
High school or higher: 84.9%Bachelor's degree or higher: 46.8%Graduate or professional degree: 13.0%Unemployed: 5.7%Mean travel time to work (commute): 31.2 minutes
For population 15 years and over in 90020:
Never married: 48.0%Now married: 39.6%Separated: 2.2%Widowed: 3.9%Divorced: 6.3%
Zip code 90020 compared to state average:
Median household income below state average. Foreign-born population percentage above state average. Renting percentage above state average. Length of stay since moving in significantly above state average. Number of rooms per house significantly below state average. 17,220 45.2% Asian 12,817 33.7% Hispanic or Latino 4,403 11.6% White 2,538 6.7% Black 817 2.1% Two or more races 144 0.4% Some other race 114 0.3% American Indian 24 0.06% Native Hawaiian and Other
Data:
Median household income ($)
Median household income (% change since 2000)
Household income diversity
Ratio of average income to average house value (%)
Ratio of average income to average rent
Median household income ($) - White
Median household income ($) - Black or African American
Median household income ($) - Asian
Median household income ($) - Hispanic or Latino
Median household income ($) - American Indian and Alaska Native
Median household income ($) - Multirace
Median household income ($) - Other Race
Median household income for houses/condos with a mortgage ($)
Median household income for apartments without a mortgage ($)
Races - White alone (%)
Races - White alone (% change since 2000)
Races - Black alone (%)
Races - Black alone (% change since 2000)
Races - American Indian alone (%)
Races - American Indian alone (% change since 2000)
Races - Asian alone (%)
Races - Asian alone (% change since 2000)
Races - Hispanic (%)
Races - Hispanic (% change since 2000)
Races - Native Hawaiian and Other Pacific Islander alone (%)
Races - Native Hawaiian and Other Pacific Islander alone (% change since 2000)
Races - Two or more races (%)
Races - Two or more races (% change since 2000)
Races - Other race alone (%)
Races - Other race alone (% change since 2000)
Racial diversity
Unemployment (%)
Unemployment (% change since 2000)
Unemployment (%) - White
Unemployment (%) - Black or African American
Unemployment (%) - Asian
Unemployment (%) - Hispanic or Latino
Unemployment (%) - American Indian and Alaska Native
Unemployment (%) - Multirace
Unemployment (%) - Other Race
Population density (people per square mile)
Population - Males (%)
Population - Females (%)
Population - Males (%) - White
Population - Males (%) - Black or African American
Population - Males (%) - Asian
Population - Males (%) - Hispanic or Latino
Population - Males (%) - American Indian and Alaska Native
Population - Males (%) - Multirace
Population - Males (%) - Other Race
Population - Females (%) - White
Population - Females (%) - Black or African American
Population - Females (%) - Asian
Population - Females (%) - Hispanic or Latino
Population - Females (%) - American Indian and Alaska Native
Population - Females (%) - Multirace
Population - Females (%) - Other Race
Coronavirus confirmed cases (Apr 27, 2024)
Deaths caused by coronavirus (Apr 27, 2024)
Coronavirus confirmed cases (per 100k population) (Apr 27, 2024)
Deaths caused by coronavirus (per 100k population) (Apr 27, 2024)
Daily increase in number of cases (Apr 27, 2024)
Weekly increase in number of cases (Apr 27, 2024)
Cases doubled (in days) (Apr 27, 2024)
Hospitalized patients (Apr 18, 2022)
Negative test results (Apr 18, 2022)
Total test results (Apr 18, 2022)
COVID Vaccine doses distributed (per 100k population) (Sep 19, 2023)
COVID Vaccine doses administered (per 100k population) (Sep 19, 2023)
COVID Vaccine doses distributed (Sep 19, 2023)
COVID Vaccine doses administered (Sep 19, 2023)
Likely homosexual households (%)
Likely homosexual households (% change since 2000)
Likely homosexual households - Lesbian couples (%)
Likely homosexual households - Lesbian couples (% change since 2000)
Likely homosexual households - Gay men (%)
Likely homosexual households - Gay men (% change since 2000)
Cost of living index
Median gross rent ($)
Median contract rent ($)
Median monthly housing costs ($)
Median house or condo value ($)
Median house or condo value ($ change since 2000)
Mean house or condo value by units in structure - 1, detached ($)
Mean house or condo value by units in structure - 1, attached ($)
Mean house or condo value by units in structure - 2 ($)
Mean house or condo value by units in structure by units in structure - 3 or 4 ($)
Mean house or condo value by units in structure - 5 or more ($)
Mean house or condo value by units in structure - Boat, RV, van, etc. ($)
Mean house or condo value by units in structure - Mobile home ($)
Median house or condo value ($) - White
Median house or condo value ($) - Black or African American
Median house or condo value ($) - Asian
Median house or condo value ($) - Hispanic or Latino
Median house or condo value ($) - American Indian and Alaska Native
Median house or condo value ($) - Multirace
Median house or condo value ($) - Other Race
Median resident age
Resident age diversity
Median resident age - Males
Median resident age - Females
Median resident age - White
Median resident age - Black or African American
Median resident age - Asian
Median resident age - Hispanic or Latino
Median resident age - American Indian and Alaska Native
Median resident age - Multirace
Median resident age - Other Race
Median resident age - Males - White
Median resident age - Males - Black or African American
Median resident age - Males - Asian
Median resident age - Males - Hispanic or Latino
Median resident age - Males - American Indian and Alaska Native
Median resident age - Males - Multirace
Median resident age - Males - Other Race
Median resident age - Females - White
Median resident age - Females - Black or African American
Median resident age - Females - Asian
Median resident age - Females - Hispanic or Latino
Median resident age - Females - American Indian and Alaska Native
Median resident age - Females - Multirace
Median resident age - Females - Other Race
Commute - mean travel time to work (minutes)
Travel time to work - Less than 5 minutes (%)
Travel time to work - Less than 5 minutes (% change since 2000)
Travel time to work - 5 to 9 minutes (%)
Travel time to work - 5 to 9 minutes (% change since 2000)
Travel time to work - 10 to 19 minutes (%)
Travel time to work - 10 to 19 minutes (% change since 2000)
Travel time to work - 20 to 29 minutes (%)
Travel time to work - 20 to 29 minutes (% change since 2000)
Travel time to work - 30 to 39 minutes (%)
Travel time to work - 30 to 39 minutes (% change since 2000)
Travel time to work - 40 to 59 minutes (%)
Travel time to work - 40 to 59 minutes (% change since 2000)
Travel time to work - 60 to 89 minutes (%)
Travel time to work - 60 to 89 minutes (% change since 2000)
Travel time to work - 90 or more minutes (%)
Travel time to work - 90 or more minutes (% change since 2000)
Marital status - Never married (%)
Marital status - Now married (%)
Marital status - Separated (%)
Marital status - Widowed (%)
Marital status - Divorced (%)
Median family income ($)
Median family income (% change since 2000)
Median non-family income ($)
Median non-family income (% change since 2000)
Median per capita income ($)
Median per capita income (% change since 2000)
Median family income ($) - White
Median family income ($) - Black or African American
Median family income ($) - Asian
Median family income ($) - Hispanic or Latino
Median family income ($) - American Indian and Alaska Native
Median family income ($) - Multirace
Median family income ($) - Other Race
Median year house/condo built
Median year apartment built
Year house built - Built 2005 or later (%)
Year house built - Built 2000 to 2004 (%)
Year house built - Built 1990 to 1999 (%)
Year house built - Built 1980 to 1989 (%)
Year house built - Built 1970 to 1979 (%)
Year house built - Built 1960 to 1969 (%)
Year house built - Built 1950 to 1959 (%)
Year house built - Built 1940 to 1949 (%)
Year house built - Built 1939 or earlier (%)
Average household size
Household density (households per square mile)
Average household size - White
Average household size - Black or African American
Average household size - Asian
Average household size - Hispanic or Latino
Average household size - American Indian and Alaska Native
Average household size - Multirace
Average household size - Other Race
Occupied housing units (%)
Vacant housing units (%)
Owner occupied housing units (%)
Renter occupied housing units (%)
Vacancy status - For rent (%)
Vacancy status - For sale only (%)
Vacancy status - Rented or sold, not occupied (%)
Vacancy status - For seasonal, recreational, or occasional use (%)
Vacancy status - For migrant workers (%)
Vacancy status - Other vacant (%)
Residents with income below the poverty level (%)
Residents with income below 50% of the poverty level (%)
Children below poverty level (%)
Poor families by family type - Married-couple family (%)
Poor families by family type - Male, no wife present (%)
Poor families by family type - Female, no husband present (%)
Poverty status for native-born residents (%)
Poverty status for foreign-born residents (%)
Poverty among high school graduates not in families (%)
Poverty among people who did not graduate high school not in families (%)
Residents with income below the poverty level (%) - White
Residents with income below the poverty level (%) - Black or African American
Residents with income below the poverty level (%) - Asian
Residents with income below the poverty level (%) - Hispanic or Latino
Residents with income below the poverty level (%) - American Indian and Alaska Native
Residents with income below the poverty level (%) - Multirace
Residents with income below the poverty level (%) - Other Race
Air pollution - Air Quality Index (AQI)
Air pollution - CO
Air pollution - NO2
Air pollution - SO2
Air pollution - Ozone
Air pollution - PM10
Air pollution - PM25
Air pollution - Pb
Crime - Murders per 100,000 population
Crime - Rapes per 100,000 population
Crime - Robberies per 100,000 population
Crime - Assaults per 100,000 population
Crime - Burglaries per 100,000 population
Crime - Thefts per 100,000 population
Crime - Auto thefts per 100,000 population
Crime - Arson per 100,000 population
Crime - City-data.com crime index
Crime - Violent crime index
Crime - Property crime index
Crime - Murders per 100,000 population (5 year average)
Crime - Rapes per 100,000 population (5 year average)
Crime - Robberies per 100,000 population (5 year average)
Crime - Assaults per 100,000 population (5 year average)
Crime - Burglaries per 100,000 population (5 year average)
Crime - Thefts per 100,000 population (5 year average)
Crime - Auto thefts per 100,000 population (5 year average)
Crime - Arson per 100,000 population (5 year average)
Crime - City-data.com crime index (5 year average)
Crime - Violent crime index (5 year average)
Crime - Property crime index (5 year average)
1996 Presidential Elections Results (%) - Democratic Party (Clinton)
1996 Presidential Elections Results (%) - Republican Party (Dole)
1996 Presidential Elections Results (%) - Other
2000 Presidential Elections Results (%) - Democratic Party (Gore)
2000 Presidential Elections Results (%) - Republican Party (Bush)
2000 Presidential Elections Results (%) - Other
2004 Presidential Elections Results (%) - Democratic Party (Kerry)
2004 Presidential Elections Results (%) - Republican Party (Bush)
2004 Presidential Elections Results (%) - Other
2008 Presidential Elections Results (%) - Democratic Party (Obama)
2008 Presidential Elections Results (%) - Republican Party (McCain)
2008 Presidential Elections Results (%) - Other
2012 Presidential Elections Results (%) - Democratic Party (Obama)
2012 Presidential Elections Results (%) - Republican Party (Romney)
2012 Presidential Elections Results (%) - Other
2016 Presidential Elections Results (%) - Democratic Party (Clinton)
2016 Presidential Elections Results (%) - Republican Party (Trump)
2016 Presidential Elections Results (%) - Other
2020 Presidential Elections Results (%) - Democratic Party (Biden)
2020 Presidential Elections Results (%) - Republican Party (Trump)
2020 Presidential Elections Results (%) - Other
Ancestries Reported - Arab (%)
Ancestries Reported - Czech (%)
Ancestries Reported - Danish (%)
Ancestries Reported - Dutch (%)
Ancestries Reported - English (%)
Ancestries Reported - French (%)
Ancestries Reported - French Canadian (%)
Ancestries Reported - German (%)
Ancestries Reported - Greek (%)
Ancestries Reported - Hungarian (%)
Ancestries Reported - Irish (%)
Ancestries Reported - Italian (%)
Ancestries Reported - Lithuanian (%)
Ancestries Reported - Norwegian (%)
Ancestries Reported - Polish (%)
Ancestries Reported - Portuguese (%)
Ancestries Reported - Russian (%)
Ancestries Reported - Scotch-Irish (%)
Ancestries Reported - Scottish (%)
Ancestries Reported - Slovak (%)
Ancestries Reported - Subsaharan African (%)
Ancestries Reported - Swedish (%)
Ancestries Reported - Swiss (%)
Ancestries Reported - Ukrainian (%)
Ancestries Reported - United States (%)
Ancestries Reported - Welsh (%)
Ancestries Reported - West Indian (%)
Ancestries Reported - Other (%)
Educational Attainment - No schooling completed (%)
Educational Attainment - Less than high school (%)
Educational Attainment - High school or equivalent (%)
Educational Attainment - Less than 1 year of college (%)
Educational Attainment - 1 or more years of college (%)
Educational Attainment - Associate degree (%)
Educational Attainment - Bachelor's degree (%)
Educational Attainment - Master's degree (%)
Educational Attainment - Professional school degree (%)
Educational Attainment - Doctorate degree (%)
School Enrollment - Nursery, preschool (%)
School Enrollment - Kindergarten (%)
School Enrollment - Grade 1 to 4 (%)
School Enrollment - Grade 5 to 8 (%)
School Enrollment - Grade 9 to 12 (%)
School Enrollment - College undergrad (%)
School Enrollment - Graduate or professional (%)
School Enrollment - Not enrolled in school (%)
School enrollment - Public schools (%)
School enrollment - Private schools (%)
School enrollment - Not enrolled (%)
Median number of rooms in houses and condos
Median number of rooms in apartments
Housing units lacking complete plumbing facilities (%)
Housing units lacking complete kitchen facilities (%)
Density of houses
Urban houses (%)
Rural houses (%)
Households with people 60 years and over (%)
Households with people 65 years and over (%)
Households with people 75 years and over (%)
Households with one or more nonrelatives (%)
Households with no nonrelatives (%)
Population in households (%)
Family households (%)
Nonfamily households (%)
Population in families (%)
Family households with own children (%)
Median number of bedrooms in owner occupied houses
Mean number of bedrooms in owner occupied houses
Median number of bedrooms in renter occupied houses
Mean number of bedrooms in renter occupied houses
Median number of vehichles in owner occupied houses
Mean number of vehichles in owner occupied houses
Median number of vehichles in renter occupied houses
Mean number of vehichles in renter occupied houses
Mortgage status - with mortgage (%)
Mortgage status - with second mortgage (%)
Mortgage status - with home equity loan (%)
Mortgage status - with both second mortgage and home equity loan (%)
Mortgage status - without a mortgage (%)
Average family size
Average family size - White
Average family size - Black or African American
Average family size - Asian
Average family size - Hispanic or Latino
Average family size - American Indian and Alaska Native
Average family size - Multirace
Average family size - Other Race
Geographical mobility - Same house 1 year ago (%)
Geographical mobility - Moved within same county (%)
Geographical mobility - Moved from different county within same state (%)
Geographical mobility - Moved from different state (%)
Geographical mobility - Moved from abroad (%)
Place of birth - Born in state of residence (%)
Place of birth - Born in other state (%)
Place of birth - Native, outside of US (%)
Place of birth - Foreign born (%)
Housing units in structures - 1, detached (%)
Housing units in structures - 1, attached (%)
Housing units in structures - 2 (%)
Housing units in structures - 3 or 4 (%)
Housing units in structures - 5 to 9 (%)
Housing units in structures - 10 to 19 (%)
Housing units in structures - 20 to 49 (%)
Housing units in structures - 50 or more (%)
Housing units in structures - Mobile home (%)
Housing units in structures - Boat, RV, van, etc. (%)
House/condo owner moved in on average (years ago)
Renter moved in on average (years ago)
Year householder moved into unit - Moved in 1999 to March 2000 (%)
Year householder moved into unit - Moved in 1995 to 1998 (%)
Year householder moved into unit - Moved in 1990 to 1994 (%)
Year householder moved into unit - Moved in 1980 to 1989 (%)
Year householder moved into unit - Moved in 1970 to 1979 (%)
Year householder moved into unit - Moved in 1969 or earlier (%)
Means of transportation to work - Drove car alone (%)
Means of transportation to work - Carpooled (%)
Means of transportation to work - Public transportation (%)
Means of transportation to work - Bus or trolley bus (%)
Means of transportation to work - Streetcar or trolley car (%)
Means of transportation to work - Subway or elevated (%)
Means of transportation to work - Railroad (%)
Means of transportation to work - Ferryboat (%)
Means of transportation to work - Taxicab (%)
Means of transportation to work - Motorcycle (%)
Means of transportation to work - Bicycle (%)
Means of transportation to work - Walked (%)
Means of transportation to work - Other means (%)
Working at home (%)
Industry diversity
Most Common Industries - Agriculture, forestry, fishing and hunting, and mining (%)
Most Common Industries - Agriculture, forestry, fishing and hunting (%)
Most Common Industries - Mining, quarrying, and oil and gas extraction (%)
Most Common Industries - Construction (%)
Most Common Industries - Manufacturing (%)
Most Common Industries - Wholesale trade (%)
Most Common Industries - Retail trade (%)
Most Common Industries - Transportation and warehousing, and utilities (%)
Most Common Industries - Transportation and warehousing (%)
Most Common Industries - Utilities (%)
Most Common Industries - Information (%)
Most Common Industries - Finance and insurance, and real estate and rental and leasing (%)
Most Common Industries - Finance and insurance (%)
Most Common Industries - Real estate and rental and leasing (%)
Most Common Industries - Professional, scientific, and management, and administrative and waste management services (%)
Most Common Industries - Professional, scientific, and technical services (%)
Most Common Industries - Management of companies and enterprises (%)
Most Common Industries - Administrative and support and waste management services (%)
Most Common Industries - Educational services, and health care and social assistance (%)
Most Common Industries - Educational services (%)
Most Common Industries - Health care and social assistance (%)
Most Common Industries - Arts, entertainment, and recreation, and accommodation and food services (%)
Most Common Industries - Arts, entertainment, and recreation (%)
Most Common Industries - Accommodation and food services (%)
Most Common Industries - Other services, except public administration (%)
Most Common Industries - Public administration (%)
Occupation diversity
Most Common Occupations - Management, business, science, and arts occupations (%)
Most Common Occupations - Management, business, and financial occupations (%)
Most Common Occupations - Management occupations (%)
Most Common Occupations - Business and financial operations occupations (%)
Most Common Occupations - Computer, engineering, and science occupations (%)
Most Common Occupations - Computer and mathematical occupations (%)
Most Common Occupations - Architecture and engineering occupations (%)
Most Common Occupations - Life, physical, and social science occupations (%)
Most Common Occupations - Education, legal, community service, arts, and media occupations (%)
Most Common Occupations - Community and social service occupations (%)
Most Common Occupations - Legal occupations (%)
Most Common Occupations - Education, training, and library occupations (%)
Most Common Occupations - Arts, design, entertainment, sports, and media occupations (%)
Most Common Occupations - Healthcare practitioners and technical occupations (%)
Most Common Occupations - Health diagnosing and treating practitioners and other technical occupations (%)
Most Common Occupations - Health technologists and technicians (%)
Most Common Occupations - Service occupations (%)
Most Common Occupations - Healthcare support occupations (%)
Most Common Occupations - Protective service occupations (%)
Most Common Occupations - Fire fighting and prevention, and other protective service workers including supervisors (%)
Most Common Occupations - Law enforcement workers including supervisors (%)
Most Common Occupations - Food preparation and serving related occupations (%)
Most Common Occupations - Building and grounds cleaning and maintenance occupations (%)
Most Common Occupations - Personal care and service occupations (%)
Most Common Occupations - Sales and office occupations (%)
Most Common Occupations - Sales and related occupations (%)
Most Common Occupations - Office and administrative support occupations (%)
Most Common Occupations - Natural resources, construction, and maintenance occupations (%)
Most Common Occupations - Farming, fishing, and forestry occupations (%)
Most Common Occupations - Construction and extraction occupations (%)
Most Common Occupations - Installation, maintenance, and repair occupations (%)
Most Common Occupations - Production, transportation, and material moving occupations (%)
Most Common Occupations - Production occupations (%)
Most Common Occupations - Transportation occupations (%)
Most Common Occupations - Material moving occupations (%)
People in Group quarters - Institutionalized population (%)
People in Group quarters - Correctional institutions (%)
People in Group quarters - Federal prisons and detention centers (%)
People in Group quarters - Halfway houses (%)
People in Group quarters - Local jails and other confinement facilities (including police lockups) (%)
People in Group quarters - Military disciplinary barracks (%)
People in Group quarters - State prisons (%)
People in Group quarters - Other types of correctional institutions (%)
People in Group quarters - Nursing homes (%)
People in Group quarters - Hospitals/wards, hospices, and schools for the handicapped (%)
People in Group quarters - Hospitals/wards and hospices for chronically ill (%)
People in Group quarters - Hospices or homes for chronically ill (%)
People in Group quarters - Military hospitals or wards for chronically ill (%)
People in Group quarters - Other hospitals or wards for chronically ill (%)
People in Group quarters - Hospitals or wards for drug/alcohol abuse (%)
People in Group quarters - Mental (Psychiatric) hospitals or wards (%)
People in Group quarters - Schools, hospitals, or wards for the mentally retarded (%)
People in Group quarters - Schools, hospitals, or wards for the physically handicapped (%)
People in Group quarters - Institutions for the deaf (%)
People in Group quarters - Institutions for the blind (%)
People in Group quarters - Orthopedic wards and institutions for the physically handicapped (%)
People in Group quarters - Wards in general hospitals for patients who have no usual home elsewhere (%)
People in Group quarters - Wards in military hospitals for patients who have no usual home elsewhere (%)
People in Group quarters - Juvenile institutions (%)
People in Group quarters - Long-term care (%)
People in Group quarters - Homes for abused, dependent, and neglected children (%)
People in Group quarters - Residential treatment centers for emotionally disturbed children (%)
People in Group quarters - Training schools for juvenile delinquents (%)
People in Group quarters - Short-term care, detention or diagnostic centers for delinquent children (%)
People in Group quarters - Type of juvenile institution unknown (%)
People in Group quarters - Noninstitutionalized population (%)
People in Group quarters - College dormitories (includes college quarters off campus) (%)
People in Group quarters - Military quarters (%)
People in Group quarters - On base (%)
People in Group quarters - Barracks, unaccompanied personnel housing (UPH), (Enlisted/Officer), ;and similar group living quarters for military personnel (%)
People in Group quarters - Transient quarters for temporary residents (%)
People in Group quarters - Military ships (%)
People in Group quarters - Group homes (%)
People in Group quarters - Homes or halfway houses for drug/alcohol abuse (%)
People in Group quarters - Homes for the mentally ill (%)
People in Group quarters - Homes for the mentally retarded (%)
People in Group quarters - Homes for the physically handicapped (%)
People in Group quarters - Other group homes (%)
People in Group quarters - Religious group quarters (%)
People in Group quarters - Dormitories (%)
People in Group quarters - Agriculture workers' dormitories on farms (%)
People in Group quarters - Job Corps and vocational training facilities (%)
People in Group quarters - Other workers' dormitories (%)
People in Group quarters - Crews of maritime vessels (%)
People in Group quarters - Other nonhousehold living situations (%)
People in Group quarters - Other noninstitutional group quarters (%)
Residents speaking English at home (%)
Residents speaking English at home - Born in the United States (%)
Residents speaking English at home - Native, born elsewhere (%)
Residents speaking English at home - Foreign born (%)
Residents speaking Spanish at home (%)
Residents speaking Spanish at home - Born in the United States (%)
Residents speaking Spanish at home - Native, born elsewhere (%)
Residents speaking Spanish at home - Foreign born (%)
Residents speaking other language at home (%)
Residents speaking other language at home - Born in the United States (%)
Residents speaking other language at home - Native, born elsewhere (%)
Residents speaking other language at home - Foreign born (%)
Class of Workers - Employee of private company (%)
Class of Workers - Self-employed in own incorporated business (%)
Class of Workers - Private not-for-profit wage and salary workers (%)
Class of Workers - Local government workers (%)
Class of Workers - State government workers (%)
Class of Workers - Federal government workers (%)
Class of Workers - Self-employed workers in own not incorporated business and Unpaid family workers (%)
House heating fuel used in houses and condos - Utility gas (%)
House heating fuel used in houses and condos - Bottled, tank, or LP gas (%)
House heating fuel used in houses and condos - Electricity (%)
House heating fuel used in houses and condos - Fuel oil, kerosene, etc. (%)
House heating fuel used in houses and condos - Coal or coke (%)
House heating fuel used in houses and condos - Wood (%)
House heating fuel used in houses and condos - Solar energy (%)
House heating fuel used in houses and condos - Other fuel (%)
House heating fuel used in houses and condos - No fuel used (%)
House heating fuel used in apartments - Utility gas (%)
House heating fuel used in apartments - Bottled, tank, or LP gas (%)
House heating fuel used in apartments - Electricity (%)
House heating fuel used in apartments - Fuel oil, kerosene, etc. (%)
House heating fuel used in apartments - Coal or coke (%)
House heating fuel used in apartments - Wood (%)
House heating fuel used in apartments - Solar energy (%)
House heating fuel used in apartments - Other fuel (%)
House heating fuel used in apartments - No fuel used (%)
Armed forces status - In Armed Forces (%)
Armed forces status - Civilian (%)
Armed forces status - Civilian - Veteran (%)
Armed forces status - Civilian - Nonveteran (%)
Fatal accidents locations in years 2005-2021
Fatal accidents locations in 2005
Fatal accidents locations in 2006
Fatal accidents locations in 2007
Fatal accidents locations in 2008
Fatal accidents locations in 2009
Fatal accidents locations in 2010
Fatal accidents locations in 2011
Fatal accidents locations in 2012
Fatal accidents locations in 2013
Fatal accidents locations in 2014
Fatal accidents locations in 2015
Fatal accidents locations in 2016
Fatal accidents locations in 2017
Fatal accidents locations in 2018
Fatal accidents locations in 2019
Fatal accidents locations in 2020
Fatal accidents locations in 2021
Alcohol use - People drinking some alcohol every month (%)
Alcohol use - People not drinking at all (%)
Alcohol use - Average days/month drinking alcohol
Alcohol use - Average drinks/week
Alcohol use - Average days/year people drink much
Audiometry - Average condition of hearing (%)
Audiometry - People that can hear a whisper from across a quiet room (%)
Audiometry - People that can hear normal voice from across a quiet room (%)
Audiometry - Ears ringing, roaring, buzzing (%)
Audiometry - Had a job exposure to loud noise (%)
Audiometry - Had off-work exposure to loud noise (%)
Blood Pressure & Cholesterol - Has high blood pressure (%)
Blood Pressure & Cholesterol - Checking blood pressure at home (%)
Blood Pressure & Cholesterol - Frequently checking blood cholesterol (%)
Blood Pressure & Cholesterol - Has high cholesterol level (%)
Consumer Behavior - Money monthly spent on food at supermarket/grocery store
Consumer Behavior - Money monthly spent on food at other stores
Consumer Behavior - Money monthly spent on eating out
Consumer Behavior - Money monthly spent on carryout/delivered foods
Consumer Behavior - Income spent on food at supermarket/grocery store (%)
Consumer Behavior - Income spent on food at other stores (%)
Consumer Behavior - Income spent on eating out (%)
Consumer Behavior - Income spent on carryout/delivered foods (%)
Current Health Status - General health condition (%)
Current Health Status - Blood donors (%)
Current Health Status - Has blood ever tested for HIV virus (%)
Current Health Status - Left-handed people (%)
Dermatology - People using sunscreen (%)
Diabetes - Diabetics (%)
Diabetes - Had a blood test for high blood sugar (%)
Diabetes - People taking insulin (%)
Diet Behavior & Nutrition - Diet health (%)
Diet Behavior & Nutrition - Milk product consumption (# of products/month)
Diet Behavior & Nutrition - Meals not home prepared (#/week)
Diet Behavior & Nutrition - Meals from fast food or pizza place (#/week)
Diet Behavior & Nutrition - Ready-to-eat foods (#/month)
Diet Behavior & Nutrition - Frozen meals/pizza (#/month)
Drug Use - People that ever used marijuana or hashish (%)
Drug Use - Ever used hard drugs (%)
Drug Use - Ever used any form of cocaine (%)
Drug Use - Ever used heroin (%)
Drug Use - Ever used methamphetamine (%)
Health Insurance - People covered by health insurance (%)
Kidney Conditions-Urology - Avg. # of times urinating at night
Medical Conditions - People with asthma (%)
Medical Conditions - People with anemia (%)
Medical Conditions - People with psoriasis (%)
Medical Conditions - People with overweight (%)
Medical Conditions - Elderly people having difficulties in thinking or remembering (%)
Medical Conditions - People who ever received blood transfusion (%)
Medical Conditions - People having trouble seeing even with glass/contacts (%)
Medical Conditions - People with arthritis (%)
Medical Conditions - People with gout (%)
Medical Conditions - People with congestive heart failure (%)
Medical Conditions - People with coronary heart disease (%)
Medical Conditions - People with angina pectoris (%)
Medical Conditions - People who ever had heart attack (%)
Medical Conditions - People who ever had stroke (%)
Medical Conditions - People with emphysema (%)
Medical Conditions - People with thyroid problem (%)
Medical Conditions - People with chronic bronchitis (%)
Medical Conditions - People with any liver condition (%)
Medical Conditions - People who ever had cancer or malignancy (%)
Mental Health - People who have little interest in doing things (%)
Mental Health - People feeling down, depressed, or hopeless (%)
Mental Health - People who have trouble sleeping or sleeping too much (%)
Mental Health - People feeling tired or having little energy (%)
Mental Health - People with poor appetite or overeating (%)
Mental Health - People feeling bad about themself (%)
Mental Health - People who have trouble concentrating on things (%)
Mental Health - People moving or speaking slowly or too fast (%)
Mental Health - People having thoughts they would be better off dead (%)
Oral Health - Average years since last visit a dentist
Oral Health - People embarrassed because of mouth (%)
Oral Health - People with gum disease (%)
Oral Health - General health of teeth and gums (%)
Oral Health - Average days a week using dental floss/device
Oral Health - Average days a week using mouthwash for dental problem
Oral Health - Average number of teeth
Pesticide Use - Households using pesticides to control insects (%)
Pesticide Use - Households using pesticides to kill weeds (%)
Physical Activity - People doing vigorous-intensity work activities (%)
Physical Activity - People doing moderate-intensity work activities (%)
Physical Activity - People walking or bicycling (%)
Physical Activity - People doing vigorous-intensity recreational activities (%)
Physical Activity - People doing moderate-intensity recreational activities (%)
Physical Activity - Average hours a day doing sedentary activities
Physical Activity - Average hours a day watching TV or videos
Physical Activity - Average hours a day using computer
Physical Functioning - People having limitations keeping them from working (%)
Physical Functioning - People limited in amount of work they can do (%)
Physical Functioning - People that need special equipment to walk (%)
Physical Functioning - People experiencing confusion/memory problems (%)
Physical Functioning - People requiring special healthcare equipment (%)
Prescription Medications - Average number of prescription medicines taking
Preventive Aspirin Use - Adults 40+ taking low-dose aspirin (%)
Reproductive Health - Vaginal deliveries (%)
Reproductive Health - Cesarean deliveries (%)
Reproductive Health - Deliveries resulted in a live birth (%)
Reproductive Health - Pregnancies resulted in a delivery (%)
Reproductive Health - Women breastfeeding newborns (%)
Reproductive Health - Women that had a hysterectomy (%)
Reproductive Health - Women that had both ovaries removed (%)
Reproductive Health - Women that have ever taken birth control pills (%)
Reproductive Health - Women taking birth control pills (%)
Reproductive Health - Women that have ever used Depo-Provera or injectables (%)
Reproductive Health - Women that have ever used female hormones (%)
Sexual Behavior - People 18+ that ever had sex (vaginal, anal, or oral) (%)
Sexual Behavior - Males 18+ that ever had vaginal sex with a woman (%)
Sexual Behavior - Males 18+ that ever performed oral sex on a woman (%)
Sexual Behavior - Males 18+ that ever had anal sex with a woman (%)
Sexual Behavior - Males 18+ that ever had any sex with a man (%)
Sexual Behavior - Females 18+ that ever had vaginal sex with a man (%)
Sexual Behavior - Females 18+ that ever performed oral sex on a man (%)
Sexual Behavior - Females 18+ that ever had anal sex with a man (%)
Sexual Behavior - Females 18+ that ever had any kind of sex with a woman (%)
Sexual Behavior - Average age people first had sex
Sexual Behavior - Average number of female sex partners in lifetime (males 18+)
Sexual Behavior - Average number of female vaginal sex partners in lifetime (males 18+)
Sexual Behavior - Average age people first performed oral sex on a woman (18+)
Sexual Behavior - Average number of woman performed oral sex on in lifetime (18+)
Sexual Behavior - Average number of male sex partners in lifetime (males 18+)
Sexual Behavior - Average number of male anal sex partners in lifetime (males 18+)
Sexual Behavior - Average age people first performed oral sex on a man (18+)
Sexual Behavior - Average number of male oral sex partners in lifetime (18+)
Sexual Behavior - People using protection when performing oral sex (%)
Sexual Behavior - Average number of times people have vaginal or anal sex a year
Sexual Behavior - People having sex without condom (%)
Sexual Behavior - Average number of male sex partners in lifetime (females 18+)
Sexual Behavior - Average number of male vaginal sex partners in lifetime (females 18+)
Sexual Behavior - Average number of female sex partners in lifetime (females 18+)
Sexual Behavior - Circumcised males 18+ (%)
Sleep Disorders - Average hours sleeping at night
Sleep Disorders - People that has trouble sleeping (%)
Smoking-Cigarette Use - People smoking cigarettes (%)
Taste & Smell - People 40+ having problems with smell (%)
Taste & Smell - People 40+ having problems with taste (%)
Taste & Smell - People 40+ that ever had wisdom teeth removed (%)
Taste & Smell - People 40+ that ever had tonsils teeth removed (%)
Taste & Smell - People 40+ that ever had a loss of consciousness because of a head injury (%)
Taste & Smell - People 40+ that ever had a broken nose or other serious injury to face or skull (%)
Taste & Smell - People 40+ that ever had two or more sinus infections (%)
Weight - Average height (inches)
Weight - Average weight (pounds)
Weight - Average BMI
Weight - People that are obese (%)
Weight - People that ever were obese (%)
Weight - People trying to lose weight (%)
100%
urban population.
Estimated median house/condo value in 2022: $765,415
90020:
$765,415California:
$715,900
According to our research of California and other state lists, there were 42 registered sex offenders living in 90020 zip code as of April 27, 2024 . The ratio of all residents to sex offenders in zip code 90020 is 970 to 1.The ratio of registered sex offenders to all residents in this zip code is lower than the state average.
Median resident age: This zip code:
37.4 yearsCalifornia median age:
37.9 years
Average household size: This zip code:
2.1 peopleCalifornia:
2.8 people
Averages for the 2020 tax year for zip code 90020, filed in 2021:
Average Adjusted Gross Income (AGI) in 2020: $71,672 (Individual Income Tax Returns) Here:
$71,672State:
$95,910
Salary/wage: $52,414 (reported on 79.2% of returns )Here:
$52,414State:
$77,331
(% of AGI for various income ranges: 1136.5% for AGIs below $25k , 4116.8% for AGIs $25k-50k , 8043.9% for AGIs $50k-75k , 12044.9% for AGIs $75k-100k , 21624.2% for AGIs $100k-200k , 267362.5% for AGIs over 200k ) Taxable interest for individuals: $6,465 (reported on 18.2% of returns )This zip code:
$6,465California:
$2,294
(% of AGI for various income ranges: 10.7% for AGIs below $25k , 18.1% for AGIs $25k-50k , 32.2% for AGIs $50k-75k , 60.4% for AGIs $75k-100k , 196.1% for AGIs $100k-200k , 23866.2% for AGIs over 200k ) Ordinary dividends: $16,211 (reported on 12.2% of returns )Here:
$16,211State:
$10,949
(% of AGI for various income ranges: 8.2% for AGIs below $25k , 14.8% for AGIs $25k-50k , 27.3% for AGIs $50k-75k , 48.0% for AGIs $75k-100k , 286.8% for AGIs $100k-200k , 42618.8% for AGIs over 200k ) Net capital gain/loss in AGI: +$55,006 (reported on 13.8% of returns )Here:
+$55,006State:
+$49,306
(% of AGI for various income ranges: 9.6% for AGIs below $25k , 23.0% for AGIs $25k-50k , 76.9% for AGIs $50k-75k , 173.6% for AGIs $75k-100k , 684.9% for AGIs $100k-200k , 171347.5% for AGIs over 200k ) Profit/loss from business: +$8,669 (reported on 27.3% of returns )Here:
+$8,669State:
+$15,671
(% of AGI for various income ranges: 318.9% for AGIs below $25k , 284.3% for AGIs $25k-50k , 284.9% for AGIs $50k-75k , 393.8% for AGIs $75k-100k , 755.6% for AGIs $100k-200k , 8491.2% for AGIs over 200k ) Taxable individual retirement arrangement distribution: $34,953 (reported on 1.8% of returns )90020:
$34,953California:
$23,505
(% of AGI for various income ranges: 12.1% for AGIs below $25k , 14.9% for AGIs $25k-50k , 32.7% for AGIs $50k-75k , 55.1% for AGIs $75k-100k , 304.7% for AGIs $100k-200k , 9911.2% for AGIs over 200k ) Self-employed (Keogh) retirement plans: $63,544 (reported on 0.5% of returns )90020:
$63,544California:
$30,163
(% of AGI for various income ranges: 21.2% for AGIs $50k-75k , 6673.8% for AGIs over 200k ) Total itemized deductions: $60,506 (reported on 5.4% of returns )Here:
$60,506State:
$39,517
(% of AGI for various income ranges: 22.8% for AGIs below $25k , 83.4% for AGIs $25k-50k , 188.5% for AGIs $50k-75k , 493.7% for AGIs $75k-100k , 1586.1% for AGIs $100k-200k , 51708.8% for AGIs over 200k ) Charity contributions: $38,741 (reported on 4.3% of returns )Here:
$38,741State:
$12,598
(% of AGI for various income ranges: 2.0% for AGIs below $25k , 11.5% for AGIs $25k-50k , 35.1% for AGIs $50k-75k , 101.5% for AGIs $75k-100k , 374.9% for AGIs $100k-200k , 34472.5% for AGIs over 200k ) Taxes paid: $7,914 (reported on 5.4% of returns )(% of AGI for various income ranges: 4.8% for AGIs below $25k , 18.2% for AGIs $25k-50k , 44.1% for AGIs $50k-75k , 126.9% for AGIs $75k-100k , 408.0% for AGIs $100k-200k , 3765.0% for AGIs over 200k ) Earned income credit: $1,564 (reported on 18.4% of returns )(% of AGI for various income ranges: 74.5% for AGIs below $25k , 53.3% for AGIs $25k-50k , 1.1% for AGIs $50k-75k ) Percentage of individuals using paid preparers for their 2020 taxes: 92.4%(% for various income ranges: 90.4% for AGIs below $25k , 93.4% for AGIs $25k-50k , 94.1% for AGIs $50k-75k , 94.7% for AGIs $75k-100k , 93.2% for AGIs $100k-200k , 96.0% for AGIs over 200k )
Averages for the 2012 tax year for zip code 90020, filed in 2013:
Average Adjusted Gross Income (AGI) in 2012: $60,923 (Individual Income Tax Returns) Here:
$60,923State:
$72,726
Salary/wage: $43,456 (reported on 81.2% of returns )Here:
$43,456State:
$59,079
(% of AGI for various income ranges: 73.7% for AGIs below $25k , 89.7% for AGIs $25k-50k , 89.3% for AGIs $50k-75k , 88.3% for AGIs $75k-100k , 79.1% for AGIs $100k-200k , 31.3% for AGIs over 200k ) Taxable interest for individuals: $3,652 (reported on 18.4% of returns )This zip code:
$3,652California:
$2,146
(% of AGI for various income ranges: 0.4% for AGIs below $25k , 0.2% for AGIs $25k-50k , 0.2% for AGIs $50k-75k , 0.6% for AGIs $75k-100k , 1.2% for AGIs $100k-200k , 1.7% for AGIs over 200k ) Ordinary dividends: $26,926 (reported on 6.6% of returns )(% of AGI for various income ranges: 0.4% for AGIs below $25k , 0.2% for AGIs $25k-50k , 0.4% for AGIs $50k-75k , 0.8% for AGIs $75k-100k , 2.0% for AGIs $100k-200k , 5.3% for AGIs over 200k ) Net capital gain/loss in AGI: +$92,587 (reported on 6.2% of returns )Here:
+$92,587State:
+$30,460
(% of AGI for various income ranges: 0.2% for AGIs $75k-100k , 1.4% for AGIs $100k-200k , 18.5% for AGIs over 200k ) Profit/loss from business: +$11,610 (reported on 25.2% of returns )Here:
+$11,610State:
+$17,064
(% of AGI for various income ranges: 20.8% for AGIs below $25k , 5.4% for AGIs $25k-50k , 3.4% for AGIs $50k-75k , 2.8% for AGIs $75k-100k , 3.5% for AGIs $100k-200k , 1.8% for AGIs over 200k ) Taxable individual retirement arrangement distribution: $19,211 (reported on 2.3% of returns )90020:
$19,211California:
$19,557
(% of AGI for various income ranges: 0.5% for AGIs below $25k , 0.5% for AGIs $25k-50k , 0.9% for AGIs $50k-75k , 0.6% for AGIs $75k-100k , 1.1% for AGIs $100k-200k , 0.7% for AGIs over 200k ) Self-employment retirement plans: $53,800 (reported on 0.3% of returns )90020:
$53,800California:
$24,530
Total itemized deductions: $52,370 (20% of AGI, reported on 15.3% of returns )Here:
$52,370State:
$34,004
Here:
20.4% of AGIState:
22.7% of AGI
(% of AGI for various income ranges: 7.3% for AGIs below $25k , 5.7% for AGIs $25k-50k , 9.6% for AGIs $50k-75k , 12.4% for AGIs $75k-100k , 17.2% for AGIs $100k-200k , 17.0% for AGIs over 200k ) Charity contributions: $12,866 (reported on 11.5% of returns )(% of AGI for various income ranges: 0.2% for AGIs below $25k , 0.8% for AGIs $25k-50k , 1.3% for AGIs $50k-75k , 2.0% for AGIs $75k-100k , 2.3% for AGIs $100k-200k , 3.8% for AGIs over 200k ) Taxes paid: $25,337 (reported on 15.1% of returns )90020:
$25,337State:
$14,448
(% of AGI for various income ranges: 0.6% for AGIs below $25k , 1.1% for AGIs $25k-50k , 2.5% for AGIs $50k-75k , 4.3% for AGIs $75k-100k , 6.9% for AGIs $100k-200k , 10.1% for AGIs over 200k ) Earned income credit: $1,943 (reported on 26.7% of returns )(% of AGI for various income ranges: 6.2% for AGIs below $25k , 1.0% for AGIs $25k-50k ) Percentage of individuals using paid preparers for their 2012 taxes: 72.1%(% for various income ranges: 73.4% for AGIs below $25k , 70.1% for AGIs $25k-50k , 67.5% for AGIs $50k-75k , 68.5% for AGIs $75k-100k , 73.7% for AGIs $100k-200k , 91.2% for AGIs over 200k )
Averages for the 2004 tax year for zip code 90020, filed in 2005:
Average Adjusted Gross Income (AGI) in 2004: $44,912 (Individual Income Tax Returns) Here:
$44,912State:
$58,600
Salary/wage: $35,898 (reported on 81.2% of returns )Here:
$35,898State:
$49,455
(% of AGI for various income ranges: 169.2% for AGIs below $10k , 82.6% for AGIs $10k-25k , 90.3% for AGIs $25k-50k , 86.8% for AGIs $50k-75k , 79.2% for AGIs $75k-100k , 42.0% for AGIs over 100k ) Taxable interest for individuals: $3,094 (reported on 23.7% of returns )This zip code:
$3,094California:
$2,365
(% of AGI for various income ranges: 6.7% for AGIs below $10k , 0.6% for AGIs $10k-25k , 0.6% for AGIs $25k-50k , 0.9% for AGIs $50k-75k , 1.3% for AGIs $75k-100k , 2.4% for AGIs over 100k ) Taxable dividends: $10,321 (reported on 7.9% of returns )(% of AGI for various income ranges: 3.5% for AGIs below $10k , 0.3% for AGIs $10k-25k , 0.3% for AGIs $25k-50k , 0.8% for AGIs $50k-75k , 1.7% for AGIs $75k-100k , 3.0% for AGIs over 100k ) Net capital gain/loss: +$31,919 (reported on 8.6% of returns )Here:
+$31,919State:
+$23,418
(% of AGI for various income ranges: -2.3% for AGIs below $10k , 0.1% for AGIs $10k-25k , 0.2% for AGIs $25k-50k , 0.8% for AGIs $50k-75k , 2.1% for AGIs $75k-100k , 11.7% for AGIs over 100k ) Profit/loss from business: +$11,882 (reported on 25.0% of returns )Here:
+$11,882State:
+$16,826
(% of AGI for various income ranges: 70.0% for AGIs below $10k , 13.3% for AGIs $10k-25k , 5.2% for AGIs $25k-50k , 3.3% for AGIs $50k-75k , 5.9% for AGIs $75k-100k , 4.6% for AGIs over 100k ) IRA payment deduction: $2,789 (reported on 2.2% of returns )90020:
$2,789California:
$3,192
(% of AGI for various income ranges: 0.3% for AGIs below $10k , 0.1% for AGIs $10k-25k , 0.3% for AGIs $25k-50k , 0.2% for AGIs $50k-75k , 0.4% for AGIs $75k-100k , 0.1% for AGIs over 100k ) Self-employed pension: $44,316 (reported on 0.6% of returns )Here:
$44,316California:
$17,688
Total itemized deductions: $45,470 (27% of AGI, reported on 16.5% of returns )Here:
$45,470State:
$28,113
Here:
26.9% of AGIState:
25.3% of AGI
(% of AGI for various income ranges: 9.5% for AGIs below $10k , 4.8% for AGIs $10k-25k , 8.4% for AGIs $25k-50k , 13.6% for AGIs $50k-75k , 16.9% for AGIs $75k-100k , 24.1% for AGIs over 100k ) Charity contributions deductions: $14,231 (8% of AGI, reported on 13.4% of returns )Here:
7.8% of AGIState:
3.3% of AGI
(% of AGI for various income ranges: 0.4% for AGIs below $10k , 0.5% for AGIs $10k-25k , 1.2% for AGIs $25k-50k , 2.0% for AGIs $50k-75k , 2.6% for AGIs $75k-100k , 7.1% for AGIs over 100k ) Total tax: $9,030 (reported on 70.6% of returns )90020:
$9,030State:
$10,761
(% of AGI for various income ranges: 14.0% for AGIs below $10k , 4.7% for AGIs $10k-25k , 6.7% for AGIs $25k-50k , 9.8% for AGIs $50k-75k , 12.1% for AGIs $75k-100k , 20.8% for AGIs over 100k ) Earned income credit: $1,573 (reported on 28.4% of returns )Percentage of individuals using paid preparers for their 2004 taxes: 74.9%(% for various income ranges: 73.7% for AGIs below $10k , 78.2% for AGIs $10k-25k , 71.0% for AGIs $25k-50k , 71.4% for AGIs $50k-75k , 73.6% for AGIs $75k-100k , 86.2% for AGIs over 100k )
Estimated median household income in 2022: This zip code:
$55,108California:
$91,551
Nearest zip codes: 90010 ,
90005 ,
90004 ,
90006 ,
90038 ,
90029 .
Los Angeles Zip Code Map
Percentage of family households: This zip code:
35.8%California:
46.8%
Percentage of households with unmarried partners: This zip code:
6.6%California:
48.1%
Likely homosexual households (counted as self-reported same-sex unmarried-partner households)
Lesbian couples: 0.3% of all households Gay men: 0.1% of all households
Household received Food Stamps/SNAP in the past 12 months: 2,656Household did not receive Food Stamps/SNAP in the past 12 months: 15,056
Women who had a birth in the past 12 months: 418 (318 now married , 100 unmarried) Women who did not have a birth in the past 12 months: 10,095 (3,614 now married , 6,496 unmarried)
Housing units in zip code 90020 with a mortgage: 1,078 (125
second mortgage , 122
both second mortgage and home equity loan )
Median monthly owner costs for units with a mortgage: $2,810
Median monthly owner costs for units without a mortgage: $945
Residents with income below the poverty level in 2022:
This zip code:
18.1%Whole state:
12.2%
Residents with income below 50% of the poverty level in 2022:
This zip code:
9.4%Whole state:
6.2%
Median number of rooms in houses and condos: Median number of rooms in apartments: Notable locations in this zip code not listed on our city pages
Click to draw/clear zip code borders Notable locations in zip code 90020: (A) , Sigmund Hecht Library (B) . Display/hide their locations on the map
Churches in zip code 90020 include: (A) , Korean Royal Church (B) , Ninth Church of Christ Scientist (C) , Wilshire Boulevard Temple of B'nai B'rith (D) , Church of the New Jerusalem (E) , First Church of the Nazarene (F) , First English Lutheran Church (G) , Founders Church of Religious Science (H) , Wilshire Presbyterian Church (I) . Display/hide their locations on the map
Parks in zip code 90020 include: (1) , South Serrano Avenue Historic District (2) . Display/hide their locations on the map
Tourist attraction (not listed on the city page) :
Year house built (houses)
25 2020 or later843 2010 to 2019792 2000 to 20091,889 1990 to 19992,514 1980 to 19893,948 1970 to 19793,202 1960 to 19691,292 1950 to 1959587 1940 to 19493,853 1939 or earlier
Zip code 90020 household income distribution in 2022 1,663 Less than $10,000722 $10,000 to $14,999457 $15,000 to $19,999820 $20,000 to $24,9991,219 $25,000 to $29,9991,069 $30,000 to $34,999831 $35,000 to $39,999852 $40,000 to $44,999489 $45,000 to $49,9991,522 $50,000 to $59,9991,732 $60,000 to $74,9992,292 $75,000 to $99,9991,325 $100,000 to $124,999738 $125,000 to $149,999807 $150,000 to $199,9991,105 $200,000 or moreEstimate of home value of owner-occupied houses/condos in 2022 in zip code 90020 60 Less than $10,0007 $25,000 to $29,99913 $50,000 to $59,9998 $100,000 to $124,99999 $300,000 to $399,999161 $400,000 to $499,999543 $500,000 to $749,999226 $750,000 to $999,99978 $1,000,000 to $1,499,99951 $1,500,000 to $1,999,999526 $2,000,000 or moreRent paid by renters in 2022 in zip code 90020 137 $250 to $29910 $350 to $399102 $400 to $44940 $450 to $4999 $500 to $5499 $550 to $59933 $600 to $64979 $650 to $699216 $700 to $74935 $750 to $799201 $800 to $899436 $900 to $9992,638 $1,000 to $1,2492,740 $1,250 to $1,4996,126 $1,500 to $1,9991,765 $2,000 to $2,499569 $2,500 to $2,999226 $3,000 to $3,49966 $3,500 or more395 No cash rent
Median gross rent in 2022: $1,664.
Median price asked for vacant for-sale houses and condos in 2022: $951,356.
Estimated median house (or condo) value in 2022 for: White Non-Hispanic householders: $3,581,728Black or African American householders: $1,343,146Asian householders: $1,440,569Some other race householders: $3,581,728Hispanic or Latino householders: $2,462,436Estimated median house or condo value in 2022: $765,415
90020:
$765,415California:
$715,900
Lower value quartile - upper value quartile: $569,360 - $1,897,905
Mean price in 2022: Detached houses: $1,324,769Here:
$1,324,769State:
$988,808
Townhouses or other attached units: $832,477Here:
$832,477State:
$838,546
In 2-unit structures: $1,127,961Here:
$1,127,961State:
$1,138,100
In 3-to-4-unit structures: $930,211Here:
$930,211State:
$824,253
In 5-or-more-unit structures: $784,826Here:
$784,826State:
$730,996
Mobile homes: $255,082Here:
$255,082State:
$184,506
Occupied boats, RVs, vans, etc.: $63,014Here:
$63,014State:
$204,957
Housing units in structures:
One, detached: 722One, attached: 111Two: 1423 or 4: 5585 to 9: 97810 to 19: 2,31820 to 49: 7,58750 or more: 7,030Mobile homes: 64Unemployment : 5.7%
Means of transportation to work in zip code 90020 50.1% 10,403 Drove a car alone7.0% 1,451 Carpooled12.1% 2,516 Bus or trolley bus1.8% 368 Streetcar or trolley car0.1% 13 Railroad0.7% 144 Taxi0.3% 72 Motorcycle1.3% 272 Bicycle5.6% 1,170 Walked1.6% 339 Other means16.3% 3,380 Worked at homeTravel time to work (commute) in zip code 90020 105 Less than 5 minutes1,101 5 to 9 minutes1,206 10 to 14 minutes2,058 15 to 19 minutes1,980 20 to 24 minutes703 25 to 29 minutes4,543 30 to 34 minutes525 35 to 39 minutes949 40 to 44 minutes2,122 45 to 59 minutes1,466 60 to 89 minutes559 90 or more minutes
Neighborhoods in zip code 90020: Percentage of zip code residents living and working in this county: 100.2%
Household type by relationship:
Households: 38,081
Male householders: 8,913 (3,542 living alone ), Female householders: 8,715 (3,631 living alone )5,686 spouses (5,567 opposite-sex spouses ), 1,410 unmarried partners , (1,332 opposite-sex unmarried partners ), 8,430 children (8,081 natural , 60 adopted , 289 stepchildren ), 380 grandchildren , 969 brothers or sisters , 1,232 parents , 0 foster children , 635 other relatives , 1,657 non-relatives In group quarters: 290 (-1 institutionalized population )
Size of family households: 3,895 2-persons , 2,228 3-persons , 1,765 4-persons , 571 5-persons , 279 6-persons , 6 7-or-more-persons
Size of nonfamily households: 7,167 1-person , 1,643 2-persons , 149 3-persons , 47 4-persons , 5 5-persons
3,797 married couples with children. single-parent households (561 men , 1,115 women ).
28.8% of residents of 90020 zip code speak English at home. of residents speak Spanish at home (52% very well, 19% well, 20% not well, 8% not at all ).of residents speak other Indo-European language at home (52% very well, 33% well, 13% not well, 2% not at all ).of residents speak Asian or Pacific Island language at home (39% very well, 34% well, 21% not well, 5% not at all ).of residents speak other language at home (82% very well, 15% well, 3% not well ).
Foreign born population: 20,703 (54.4%)
(49.2%
of them are naturalized citizens )
This zip code:
54.4%Whole state:
26.7%
34% Japan 13% Honduras 12% Malaysia 9% Costa Rica 7% El Salvador 6% Afghanistan 3% Korea 3% American 1% Nigerian 1% Irish 1% African 0% European 0% Italian 0% Armenian
Year of entry for the foreign-born population
6,516 2010 or later 4,811 2000 to 2009 4,186 1990 to 1999 6,077 Before 1990
There are
98 Social Workers 335 Other Medical Specialists in Zip Code 90020.
Facilities with environmental interests located in this zip code:
AGAJANIAN RECYCLING CO (405 S IRVING BLVD in LOS ANGELES, CA)
(Resource Conservation and Recovery Act (tracking hazardous waste)) Organizations: CARY JC AGAJANIAN (CONTACT/OWNER)
A 1 BODY SHOP & AUTO REPAIR (3525 W 3RD ST in LOS ANGELES, CA)
Small Quantity Generators, between 100 kg and 1000 kg of hazardous waste/month (Resource Conservation and Recovery Act (tracking hazardous waste)) - notification Business NAICS classification: AUTOMOTIVE BODY, PAINT, AND INTERIOR REPAIR AND MAINTENANCE.
AMERICAN ONE HOUR PHOTO (3670 W 3RD STREET in LOS ANGELES, CA)
Small Quantity Generators, between 100 kg and 1000 kg of hazardous waste/month (Resource Conservation and Recovery Act (tracking hazardous waste)) Organizations: HYUNG KYU KO (CONTACT/OWNER)
ANDRESEN TYPOGRAPHICS (3501 W 6TH ST in LOS ANGELES, CA)
Small Quantity Generators, between 100 kg and 1000 kg of hazardous waste/month (Resource Conservation and Recovery Act (tracking hazardous waste)) - notification Organizations: ANDREW ANDRESEN JR (CONTACT/OWNER)
CINDERELLA CLEANERS (4062-1/2 W 6TH ST ANDREW in LOS ANGELES, CA)
Small Quantity Generators, between 100 kg and 1000 kg of hazardous waste/month (Resource Conservation and Recovery Act (tracking hazardous waste)) - notification Organizations: KIM YONG SEUNG (CONTACT/OWNER)
MOTCCH (664 S CATALINA AVE in LOS ANGELES, CA)
Small Quantity Generators, between 100 kg and 1000 kg of hazardous waste/month (Resource Conservation and Recovery Act (tracking hazardous waste)) - notification Organizations: C E PENNY CO JOE KHAIR (CONTACT/OWNER)
MASTER SYSTEM CLEANERS (3311 W 6TH in LOS ANGELES, CA)
Small Quantity Generators, between 100 kg and 1000 kg of hazardous waste/month (Resource Conservation and Recovery Act (tracking hazardous waste)) - notification Organizations: JONG DUK LEE (CONTACT/OWNER)
CHEVRON STATION 93674 (561 S VERMONT AVE in LOS ANGELES, CA)
Small Quantity Generators, between 100 kg and 1000 kg of hazardous waste/month (Resource Conservation and Recovery Act (tracking hazardous waste)) - notification Organizations: CHEVRON USA PRODUCTS CO (CONTACT/OWNER)
MYUNG SUP IM DBA DYNO AUTO CARE (3151 W 6TH ST in LOS ANGELES, CA)
Small Quantity Generators, between 100 kg and 1000 kg of hazardous waste/month (Resource Conservation and Recovery Act (tracking hazardous waste)) - notification
Housing units lacking complete plumbing facilities: 0.1%
Housing units lacking complete kitchen facilities: 5.3%
52.1% Electricity 35.2% Utility gas 10.2% No fuel used 1.9% Bottled, tank, or LP gas
Population in 1990: 34,926. Population change in the 1990s: +7,457 (+21.4%).
Place of birth for U.S.-born residents:
This state: 12,585Northeast: 1,590Midwest: 963South: 1,353West: 413
48% of the 90020 zip code residents lived in the same house 5 years ago.
Out of people who lived in different houses, 83% lived in this county.
Out of people who lived in different counties, 50% lived in California.
88% of the 90020 zip code residents lived in the same house 1 year ago.
Out of people who lived in different houses, 66% moved from this county.
Out of people who lived in different houses, 11% moved from different county within same state.
Out of people who lived in different houses, 5% moved from different state.
Out of people who lived in different houses, 18% moved from abroad.
Private vs. public school enrollment:
Students in private schools in grades 1 to 8 (elementary and middle school): 385
Here:
15.6%California:
10.5%
Students in private schools in grades 9 to 12 (high school): 195
Here:
12.7%California:
8.5%
Students in private undergraduate colleges: 387
Here:
17.9%California:
15.9%
Occupation by median earnings in the past 12 months ($)
91,440 Legal occupations 85,520 Health diagnosing and treating practitioners and other technical occupations 83,094 Computer and mathematical occupations 81,962 Architecture and engineering occupations 69,679 Business and financial operations occupations 69,380 Management occupations
Top industries in this zip code by the number of employees in 2005:
Health Care and Social Assistance: Services for the Elderly and Persons with Disabilities (100-249 employees: 1 establishment, 50-99 employees: 2 establishments, 20-49 employees: 2 establishments)Other Services (except Public Administration): Labor Unions and Similar Labor Organizations (100-249: 1, 50-99: 1, 20-49: 2, 5-9: 1, 1-4: 1)Accommodation and Food Services: Full-Service Restaurants (20-49: 2, 10-19: 7, 5-9: 6, 1-4: 34)Other Services (except Public Administration): Religious Organizations (50-99: 1, 20-49: 2, 10-19: 4, 5-9: 5, 1-4: 19)Accommodation and Food Services: Limited-Service Restaurants (50-99: 1, 20-49: 3, 10-19: 3, 5-9: 4, 1-4: 11)Educational Services: Elementary and Secondary Schools (100-249: 1, 1-4: 5)Health Care and Social Assistance: Other Individual and Family Services (100-249: 1, 5-9: 1, 1-4: 1)Finance and Insurance: Commercial Banking (100-249: 1, 1-4: 1)
People in group quarters in 2010:
68 people in other noninstitutional facilities
45 people in group homes intended for adults
21 people in emergency and transitional shelters (with sleeping facilities) for people experiencing homelessness
13 people in college/university student housing
8 people in residential treatment centers for juveniles (non-correctional)
People in group quarters in 2000:
84 people in other noninstitutional group quarters
40 people in homes for the mentally retarded
36 people in orthopedic wards and institutions for the physically handicapped
19 people in college dormitories (includes college quarters off campus)
19 people in religious group quarters
13 people in homes or halfway houses for drug/alcohol abuse
10 people in homes for the mentally ill
4 people in other nonhousehold living situations
Fatal accident statistics in 2010:
Fatal accident count: 2Vehicles involved in fatal accidents: 2Fatal accidents caused by drunken drivers: 0Fatalities: 2Persons involved in fatal accidents: 2Pedestrians involved in fatal accidents: 2
Home Mortgage Disclosure Act Aggregated Statistics For Year 2009(Based on 3 full and 14 partial tracts) A) FHA, FSA/RHS & VA B) Conventional C) Refinancings D) Home Improvement Loans E) Loans on Dwellings For 5+ Families F) Non-occupant Loans on Number Average Value Number Average Value Number Average Value Number Average Value Number Average Value Number Average Value
LOANS ORIGINATED 13 $254,517 139 $449,263 179 $644,840 11 $355,460 18 $1,312,087 23 $489,297 APPLICATIONS APPROVED, NOT ACCEPTED 4 $193,988 25 $425,781 19 $489,158 0 $0 2 $918,595 4 $349,555 APPLICATIONS DENIED 5 $282,158 36 $383,550 76 $645,457 1 $2,105,600 7 $1,365,820 18 $356,893 APPLICATIONS WITHDRAWN 9 $253,738 35 $385,957 45 $512,983 1 $26,320 0 $0 11 $369,110 FILES CLOSED FOR INCOMPLETENESS 3 $252,947 2 $519,230 22 $452,279 1 $329,000 0 $0 5 $303,820
Aggregated Statistics For Year 2008(Based on 3 full and 14 partial tracts) A) FHA, FSA/RHS & VA B) Conventional C) Refinancings D) Home Improvement Loans E) Loans on Dwellings For 5+ Families F) Non-occupant Loans on G) Loans On Manufactured Number Average Value Number Average Value Number Average Value Number Average Value Number Average Value Number Average Value Number Average Value
LOANS ORIGINATED 2 $302,675 108 $529,710 103 $659,347 6 $408,917 26 $2,542,731 11 $304,624 0 $0 APPLICATIONS APPROVED, NOT ACCEPTED 0 $0 35 $508,462 23 $512,436 2 $138,540 1 $2,718,920 5 $267,492 1 $47,380 APPLICATIONS DENIED 2 $347,760 46 $341,052 98 $667,794 3 $49,533 4 $2,440,348 24 $327,327 0 $0 APPLICATIONS WITHDRAWN 1 $277,360 32 $383,141 39 $528,714 3 $816,450 1 $2,288,260 12 $204,805 0 $0 FILES CLOSED FOR INCOMPLETENESS 0 $0 9 $693,470 9 $580,076 1 $131,600 2 $1,483,270 2 $309,650 0 $0
Aggregated Statistics For Year 2007(Based on 3 full and 14 partial tracts) B) Conventional C) Refinancings D) Home Improvement Loans E) Loans on Dwellings For 5+ Families F) Non-occupant Loans on G) Loans On Manufactured Number Average Value Number Average Value Number Average Value Number Average Value Number Average Value Number Average Value
LOANS ORIGINATED 214 $516,192 233 $660,305 19 $752,563 72 $2,413,801 30 $401,427 2 $84,230 APPLICATIONS APPROVED, NOT ACCEPTED 67 $436,200 68 $564,646 13 $310,144 0 $0 11 $406,473 0 $0 APPLICATIONS DENIED 95 $600,073 195 $527,022 30 $378,146 4 $4,833,810 27 $366,651 0 $0 APPLICATIONS WITHDRAWN 47 $408,480 74 $610,715 7 $189,220 2 $5,607,015 5 $409,378 0 $0 FILES CLOSED FOR INCOMPLETENESS 11 $339,824 42 $427,737 5 $209,958 2 $561,540 5 $370,162 0 $0
Aggregated Statistics For Year 2006(Based on 3 full and 14 partial tracts) B) Conventional C) Refinancings D) Home Improvement Loans E) Loans on Dwellings For 5+ Families F) Non-occupant Loans on G) Loans On Manufactured Number Average Value Number Average Value Number Average Value Number Average Value Number Average Value Number Average Value
LOANS ORIGINATED 319 $460,458 310 $545,647 31 $455,713 70 $1,763,493 54 $380,293 0 $0 APPLICATIONS APPROVED, NOT ACCEPTED 74 $457,807 63 $452,629 2 $828,220 3 $1,380,830 12 $310,108 1 $99,170 APPLICATIONS DENIED 99 $440,151 129 $659,303 14 $388,950 5 $678,540 16 $261,406 0 $0 APPLICATIONS WITHDRAWN 99 $431,564 89 $648,225 8 $317,526 2 $2,185,605 13 $498,319 0 $0 FILES CLOSED FOR INCOMPLETENESS 16 $289,206 11 $567,727 1 $853,880 1 $405,000 1 $210,030 0 $0
Aggregated Statistics For Year 2005(Based on 3 full and 14 partial tracts) A) FHA, FSA/RHS & VA B) Conventional C) Refinancings D) Home Improvement Loans E) Loans on Dwellings For 5+ Families F) Non-occupant Loans on G) Loans On Manufactured Number Average Value Number Average Value Number Average Value Number Average Value Number Average Value Number Average Value Number Average Value
LOANS ORIGINATED 1 $99,000 672 $392,910 339 $514,395 30 $499,704 93 $1,775,557 97 $325,158 0 $0 APPLICATIONS APPROVED, NOT ACCEPTED 0 $0 108 $512,614 72 $429,074 12 $291,629 0 $0 14 $241,341 0 $0 APPLICATIONS DENIED 0 $0 200 $357,960 155 $429,150 22 $178,844 1 $342,160 38 $388,251 1 $20,000 APPLICATIONS WITHDRAWN 0 $0 128 $372,990 132 $419,873 12 $235,111 3 $2,023,830 27 $414,262 0 $0 FILES CLOSED FOR INCOMPLETENESS 0 $0 22 $471,057 27 $551,713 3 $649,010 0 $0 8 $517,045 0 $0
Aggregated Statistics For Year 2004(Based on 3 full and 14 partial tracts) B) Conventional C) Refinancings D) Home Improvement Loans E) Loans on Dwellings For 5+ Families F) Non-occupant Loans on G) Loans On Manufactured Number Average Value Number Average Value Number Average Value Number Average Value Number Average Value Number Average Value
LOANS ORIGINATED 353 $413,614 388 $493,629 23 $414,240 75 $1,693,235 53 $316,327 1 $68,630 APPLICATIONS APPROVED, NOT ACCEPTED 81 $409,376 85 $436,543 5 $128,048 1 $6,120,150 5 $352,866 0 $0 APPLICATIONS DENIED 109 $382,083 157 $386,043 27 $176,843 4 $926,345 20 $264,374 0 $0 APPLICATIONS WITHDRAWN 67 $404,600 79 $312,989 9 $83,152 9 $1,874,491 13 $332,138 2 $36,900 FILES CLOSED FOR INCOMPLETENESS 20 $350,939 25 $336,064 3 $20,587 0 $0 1 $74,800 0 $0
Aggregated Statistics For Year 2003(Based on 3 full and 14 partial tracts) A) FHA, FSA/RHS & VA B) Conventional C) Refinancings D) Home Improvement Loans E) Loans on Dwellings For 5+ Families F) Non-occupant Loans on Number Average Value Number Average Value Number Average Value Number Average Value Number Average Value Number Average Value
LOANS ORIGINATED 0 $0 339 $309,204 815 $405,085 17 $106,580 109 $1,659,337 63 $205,617 APPLICATIONS APPROVED, NOT ACCEPTED 0 $0 74 $280,039 131 $354,844 3 $46,440 3 $1,918,937 26 $232,466 APPLICATIONS DENIED 1 $365,830 58 $236,013 193 $410,449 15 $53,702 2 $511,590 25 $345,100 APPLICATIONS WITHDRAWN 0 $0 47 $293,496 141 $300,718 9 $37,743 5 $2,014,718 4 $102,915 FILES CLOSED FOR INCOMPLETENESS 0 $0 15 $423,375 37 $353,088 4 $47,512 5 $1,716,646 0 $0
Aggregated Statistics For Year 2002(Based on 1 full and 10 partial tracts) A) FHA, FSA/RHS & VA B) Conventional C) Refinancings D) Home Improvement Loans E) Loans on Dwellings For 5+ Families F) Non-occupant Loans on Number Average Value Number Average Value Number Average Value Number Average Value Number Average Value Number Average Value
LOANS ORIGINATED 3 $81,360 285 $335,921 499 $491,790 18 $72,137 74 $1,153,976 31 $160,633 APPLICATIONS APPROVED, NOT ACCEPTED 1 $65,000 47 $372,108 74 $398,900 5 $65,750 1 $535,000 8 $178,788 APPLICATIONS DENIED 0 $0 54 $295,694 117 $337,361 14 $41,853 7 $721,961 14 $132,237 APPLICATIONS WITHDRAWN 1 $51,180 42 $299,115 82 $347,298 2 $451,515 16 $1,442,851 4 $315,418 FILES CLOSED FOR INCOMPLETENESS 1 $90,540 9 $432,469 42 $364,006 1 $147,220 3 $603,490 2 $479,645
Aggregated Statistics For Year 2001(Based on 1 full and 10 partial tracts) A) FHA, FSA/RHS & VA B) Conventional C) Refinancings D) Home Improvement Loans E) Loans on Dwellings For 5+ Families F) Non-occupant Loans on Number Average Value Number Average Value Number Average Value Number Average Value Number Average Value Number Average Value
LOANS ORIGINATED 44 $181,829 197 $322,321 345 $424,303 32 $46,482 50 $1,193,254 19 $248,677 APPLICATIONS APPROVED, NOT ACCEPTED 5 $178,476 29 $432,297 59 $361,107 5 $44,768 2 $762,090 5 $102,944 APPLICATIONS DENIED 3 $81,770 46 $353,564 119 $293,218 26 $31,594 14 $1,081,711 5 $306,962 APPLICATIONS WITHDRAWN 2 $279,130 41 $278,725 77 $316,830 11 $123,722 10 $1,393,228 2 $277,415 FILES CLOSED FOR INCOMPLETENESS 2 $102,680 6 $409,528 19 $322,984 3 $38,757 15 $1,654,574 2 $101,825
Aggregated Statistics For Year 2000(Based on 1 full and 10 partial tracts) A) FHA, FSA/RHS & VA B) Conventional C) Refinancings D) Home Improvement Loans E) Loans on Dwellings For 5+ Families F) Non-occupant Loans on Number Average Value Number Average Value Number Average Value Number Average Value Number Average Value Number Average Value
LOANS ORIGINATED 4 $166,395 284 $267,610 86 $349,300 13 $122,420 45 $922,603 21 $131,993 APPLICATIONS APPROVED, NOT ACCEPTED 1 $276,770 34 $247,082 23 $366,196 8 $36,635 0 $0 1 $189,890 APPLICATIONS DENIED 4 $163,912 50 $327,968 77 $243,763 16 $51,604 10 $1,175,732 6 $235,018 APPLICATIONS WITHDRAWN 2 $244,585 31 $203,711 53 $140,816 7 $113,011 5 $2,173,638 4 $128,675 FILES CLOSED FOR INCOMPLETENESS 0 $0 14 $280,927 13 $233,546 1 $26,320 9 $1,082,870 0 $0
Aggregated Statistics For Year 1999(Based on 2 full and 7 partial tracts) A) FHA, FSA/RHS & VA B) Conventional C) Refinancings D) Home Improvement Loans E) Loans on Dwellings For 5+ Families F) Non-occupant Loans on Number Average Value Number Average Value Number Average Value Number Average Value Number Average Value Number Average Value
LOANS ORIGINATED 9 $138,640 138 $373,856 114 $371,342 47 $15,617 33 $938,759 9 $157,087 APPLICATIONS APPROVED, NOT ACCEPTED 1 $186,280 17 $349,714 33 $304,789 11 $29,988 1 $712,980 1 $145,130 APPLICATIONS DENIED 1 $392,380 35 $417,885 59 $283,308 29 $26,977 3 $977,247 9 $98,598 APPLICATIONS WITHDRAWN 1 $179,320 32 $195,818 46 $192,637 1 $128,880 4 $490,778 5 $162,388 FILES CLOSED FOR INCOMPLETENESS 0 $0 6 $378,345 20 $206,814 1 $7,900 10 $953,805 1 $134,440
Private Mortgage Insurance Companies Aggregated Statistics For Year 2009(Based on 6 partial tracts) A) Conventional B) Refinancings Number Average Value Number Average Value
LOANS ORIGINATED 2 $98,670 2 $271,145 APPLICATIONS APPROVED, NOT ACCEPTED 0 $0 0 $0 APPLICATIONS DENIED 1 $394,020 0 $0 APPLICATIONS WITHDRAWN 2 $98,670 0 $0 FILES CLOSED FOR INCOMPLETENESS 1 $145,660 0 $0
Aggregated Statistics For Year 2008(Based on 2 full and 10 partial tracts) A) Conventional B) Refinancings C) Non-occupant Loans on Number Average Value Number Average Value Number Average Value
LOANS ORIGINATED 17 $295,430 10 $314,127 1 $285,460 APPLICATIONS APPROVED, NOT ACCEPTED 9 $323,850 7 $355,456 1 $140,000 APPLICATIONS DENIED 6 $476,867 1 $244,080 1 $599,000 APPLICATIONS WITHDRAWN 4 $380,790 0 $0 1 $722,850 FILES CLOSED FOR INCOMPLETENESS 0 $0 0 $0 0 $0
Aggregated Statistics For Year 2007(Based on 3 full and 8 partial tracts) A) Conventional B) Refinancings Number Average Value Number Average Value
LOANS ORIGINATED 10 $274,747 11 $349,415 APPLICATIONS APPROVED, NOT ACCEPTED 0 $0 1 $252,940 APPLICATIONS DENIED 0 $0 1 $252,940 APPLICATIONS WITHDRAWN 0 $0 0 $0 FILES CLOSED FOR INCOMPLETENESS 0 $0 0 $0
Aggregated Statistics For Year 2006(Based on 1 full and 8 partial tracts) A) Conventional B) Refinancings Number Average Value Number Average Value
LOANS ORIGINATED 14 $351,474 6 $329,177 APPLICATIONS APPROVED, NOT ACCEPTED 5 $402,314 0 $0 APPLICATIONS DENIED 0 $0 0 $0 APPLICATIONS WITHDRAWN 3 $418,750 0 $0 FILES CLOSED FOR INCOMPLETENESS 0 $0 0 $0
Aggregated Statistics For Year 2005(Based on 3 full and 8 partial tracts) A) Conventional B) Refinancings Number Average Value Number Average Value
LOANS ORIGINATED 15 $307,677 6 $230,185 APPLICATIONS APPROVED, NOT ACCEPTED 3 $221,443 0 $0 APPLICATIONS DENIED 0 $0 0 $0 APPLICATIONS WITHDRAWN 3 $236,600 0 $0 FILES CLOSED FOR INCOMPLETENESS 0 $0 0 $0
Aggregated Statistics For Year 2004(Based on 3 full and 10 partial tracts) A) Conventional B) Refinancings C) Non-occupant Loans on Number Average Value Number Average Value Number Average Value
LOANS ORIGINATED 29 $232,882 4 $120,618 0 $0 APPLICATIONS APPROVED, NOT ACCEPTED 9 $266,362 2 $250,715 1 $233,000 APPLICATIONS DENIED 2 $251,090 0 $0 0 $0 APPLICATIONS WITHDRAWN 2 $173,355 1 $95,000 0 $0 FILES CLOSED FOR INCOMPLETENESS 3 $344,137 0 $0 0 $0
Aggregated Statistics For Year 2003(Based on 3 full and 14 partial tracts) A) Conventional B) Refinancings C) Non-occupant Loans on Number Average Value Number Average Value Number Average Value
LOANS ORIGINATED 51 $212,034 14 $209,636 5 $148,578 APPLICATIONS APPROVED, NOT ACCEPTED 17 $248,007 6 $168,135 3 $146,017 APPLICATIONS DENIED 0 $0 0 $0 0 $0 APPLICATIONS WITHDRAWN 2 $104,830 0 $0 1 $62,990 FILES CLOSED FOR INCOMPLETENESS 0 $0 0 $0 0 $0
Aggregated Statistics For Year 2002(Based on 1 full and 10 partial tracts) A) Conventional B) Refinancings C) Non-occupant Loans on Number Average Value Number Average Value Number Average Value
LOANS ORIGINATED 52 $196,729 10 $206,296 3 $59,400 APPLICATIONS APPROVED, NOT ACCEPTED 19 $264,232 3 $272,873 1 $379,010 APPLICATIONS DENIED 4 $280,940 0 $0 0 $0 APPLICATIONS WITHDRAWN 1 $397,490 1 $344,470 0 $0 FILES CLOSED FOR INCOMPLETENESS 0 $0 0 $0 0 $0
Aggregated Statistics For Year 2001(Based on 1 full and 10 partial tracts) A) Conventional B) Refinancings C) Non-occupant Loans on Number Average Value Number Average Value Number Average Value
LOANS ORIGINATED 52 $174,056 12 $158,999 2 $299,520 APPLICATIONS APPROVED, NOT ACCEPTED 9 $180,546 3 $187,363 0 $0 APPLICATIONS DENIED 2 $221,845 2 $421,955 1 $220,040 APPLICATIONS WITHDRAWN 3 $235,920 0 $0 0 $0 FILES CLOSED FOR INCOMPLETENESS 1 $154,190 0 $0 0 $0
Aggregated Statistics For Year 2000(Based on 1 full and 10 partial tracts) A) Conventional B) Refinancings C) Non-occupant Loans on Number Average Value Number Average Value Number Average Value
LOANS ORIGINATED 62 $172,377 5 $301,434 4 $107,640 APPLICATIONS APPROVED, NOT ACCEPTED 13 $154,045 7 $147,141 0 $0 APPLICATIONS DENIED 7 $186,134 1 $473,760 0 $0 APPLICATIONS WITHDRAWN 3 $111,690 0 $0 0 $0 FILES CLOSED FOR INCOMPLETENESS 2 $78,615 0 $0 0 $0
Aggregated Statistics For Year 1999(Based on 2 full and 7 partial tracts) A) Conventional B) Refinancings Number Average Value Number Average Value
LOANS ORIGINATED 34 $139,763 3 $192,920 APPLICATIONS APPROVED, NOT ACCEPTED 8 $155,474 3 $130,773 APPLICATIONS DENIED 5 $99,046 0 $0 APPLICATIONS WITHDRAWN 1 $991,110 1 $130,000 FILES CLOSED FOR INCOMPLETENESS 0 $0 0 $0
2005 - 2018 National Fire Incident Reporting System (NFIRS) incidents See full 2006 National Fire Incident Reporting System statistics for zip code 90020, California
Most common first names in zip code 90020 among deceased individuals Name Count Lived (average)
Mary 93 80.4 years William 76 71.8 years Robert 69 64.9 years John 67 70.7 years Joseph 62 72.8 years Charles 60 73.6 years James 56 65.5 years George 49 75.5 years Helen 48 80.7 years Dorothy 47 76.9 years
Most common last names in zip code 90020 among deceased individuals Last name Count Lived (average)
Kim 84 73.7 years Lee 50 72.6 years Johnson 42 70.6 years Smith 34 70.8 years Park 24 74.5 years Brown 22 75.7 years Choi 19 74.8 years Moore 18 74.4 years Miller 17 76.6 years Williams 17 70.3 years
Businesses in zip code 90020
Name Count Name Count
Ace Hardware 1 Payless 1 Baskin-Robbins 1 Rite Aid 1 Carl\s Jr. 2 Safeway 1 DHL 1 Starbucks 1 FedEx 4 T-Mobile 1 H&R Block 2 UPS 2 IHOP 1 Vons 1 Kroger 1 Walgreens 1 McDonald's 1

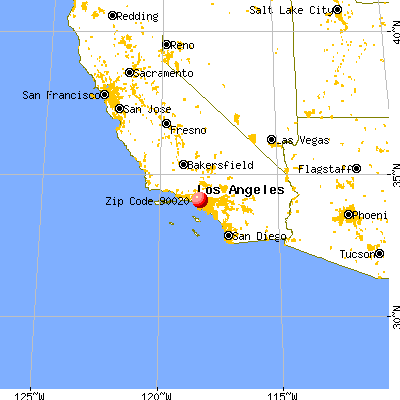


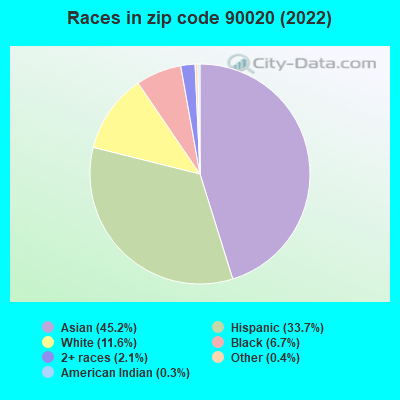


 Nearest zip codes: 90010, 90005, 90004, 90006, 90038, 90029.
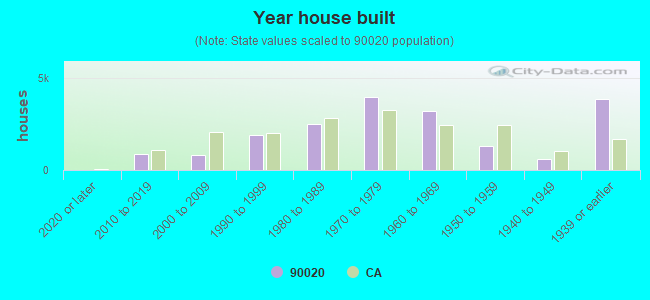

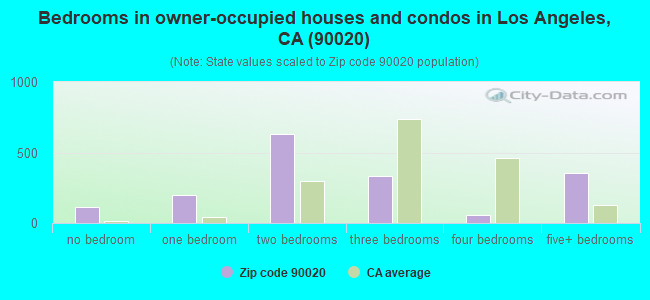
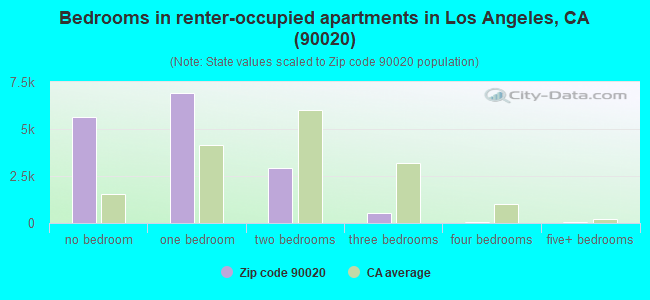
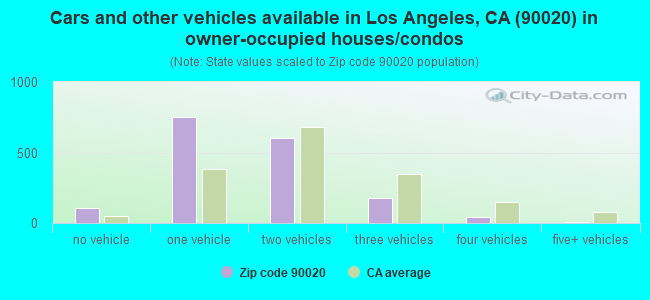
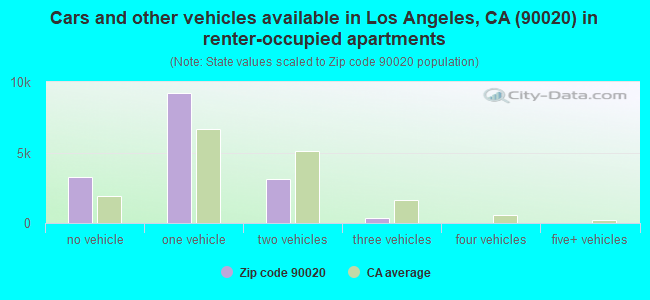


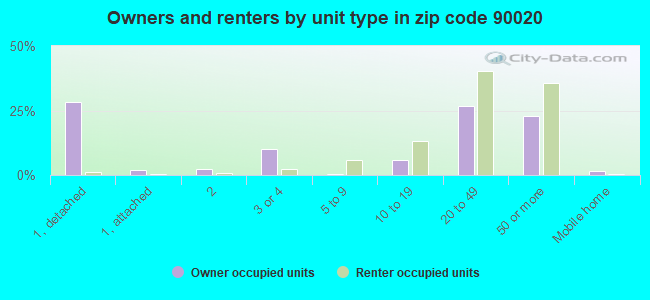


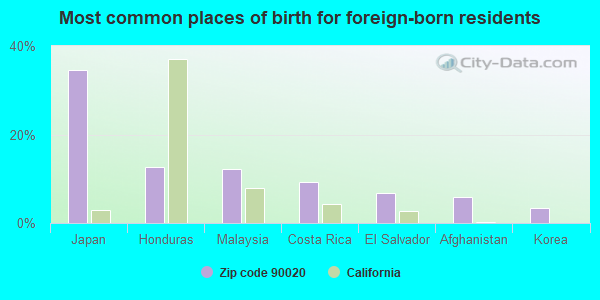
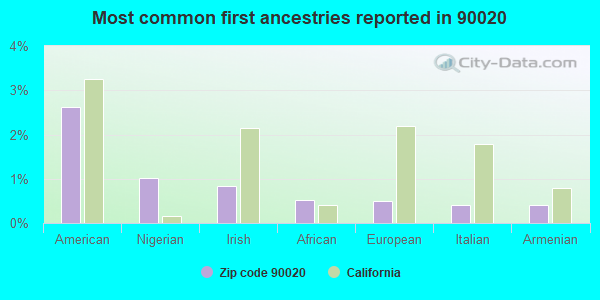
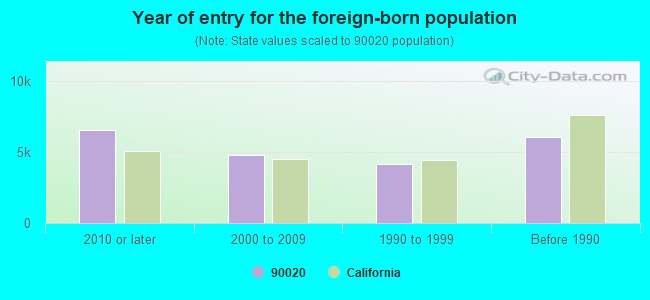

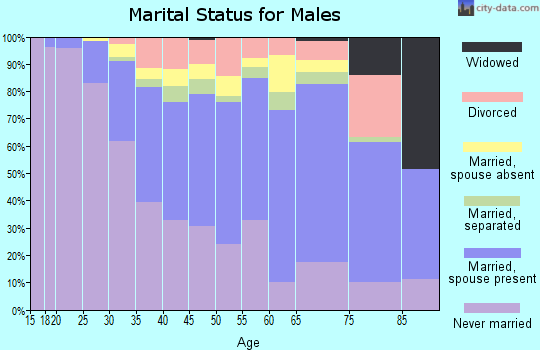
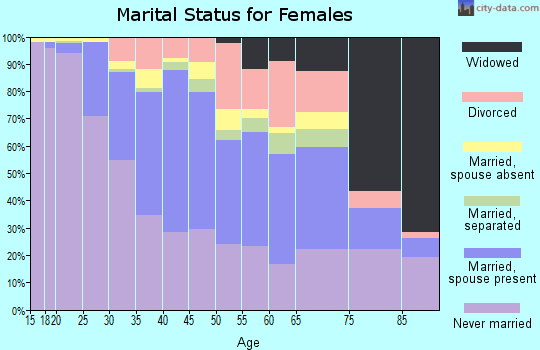
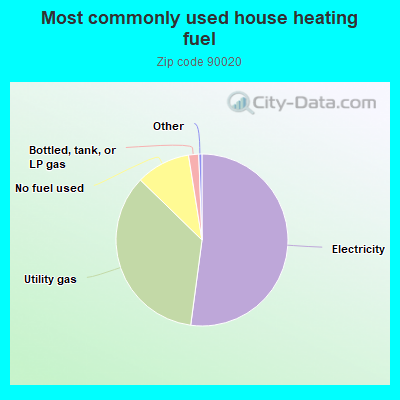
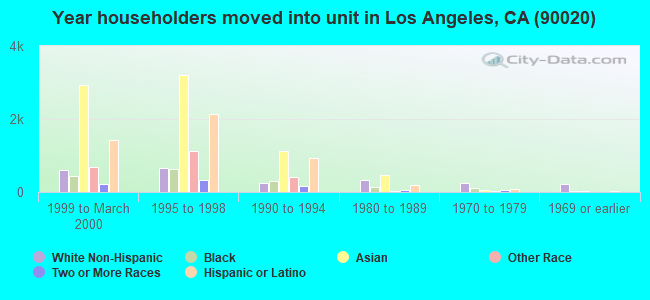
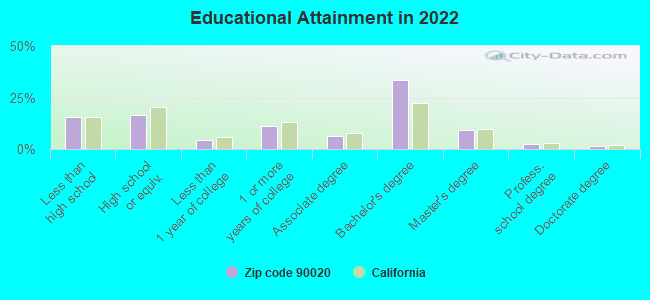
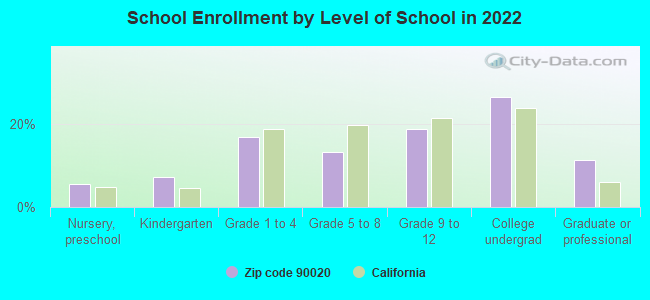
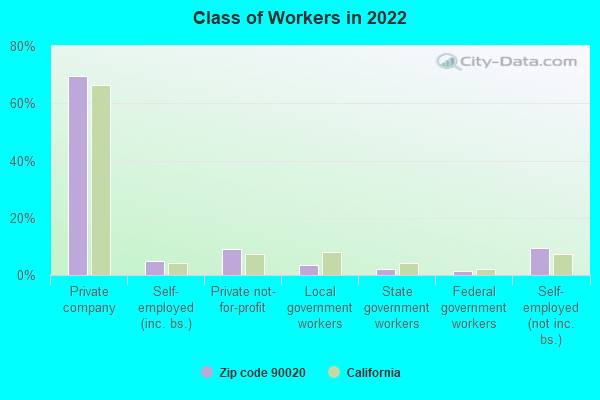
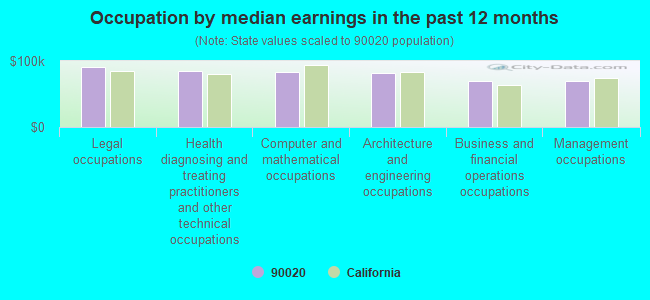
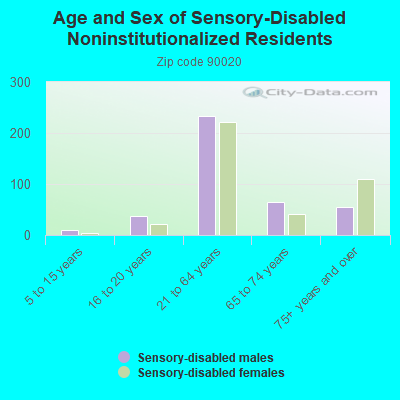
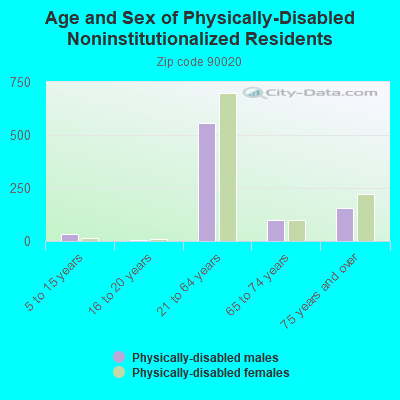
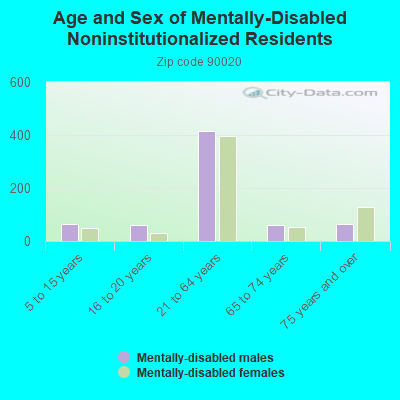
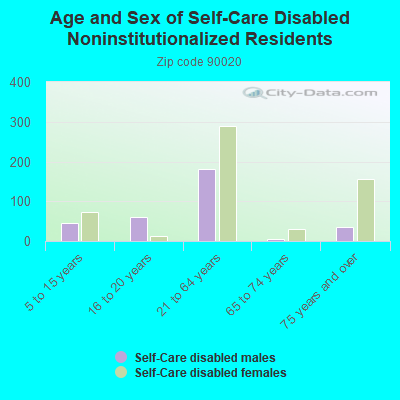
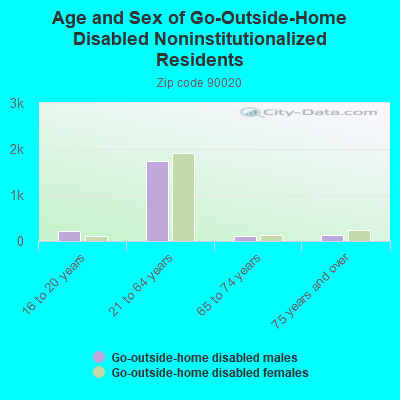
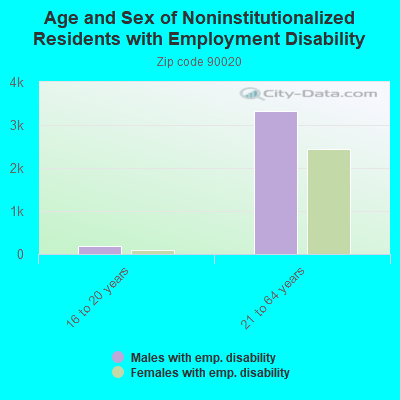
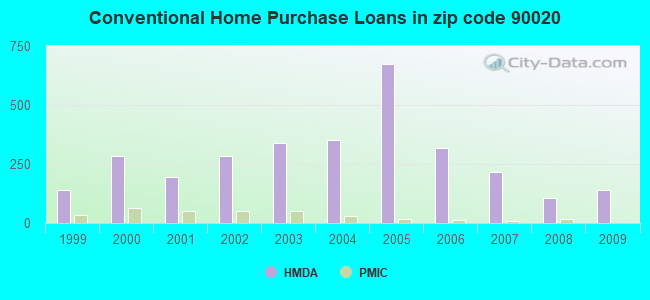
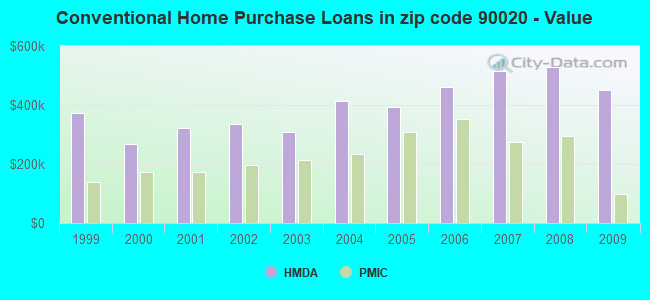
 According to the data from the years 2005 - 2018 the average number of fires per year is 53. The highest number of fire incidents - 86 took place in 2006, and the least - 35 in 2010. The data has a decreasing trend.
 When looking into fire subcategories, the most incidents belonged to: Structure Fires (62.5%), and Outside Fires (22.3%).