Estimated zip code population in 2022: 34,361 Zip code population in 2010: 38,617 Zip code population in 2000: 41,697
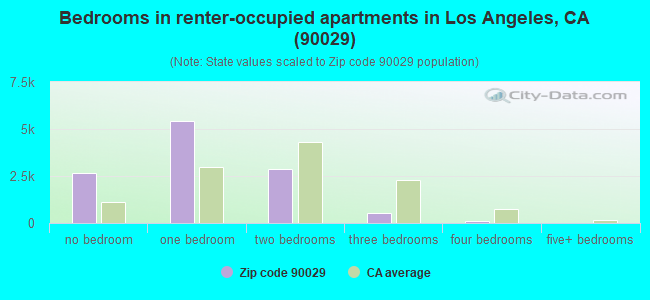
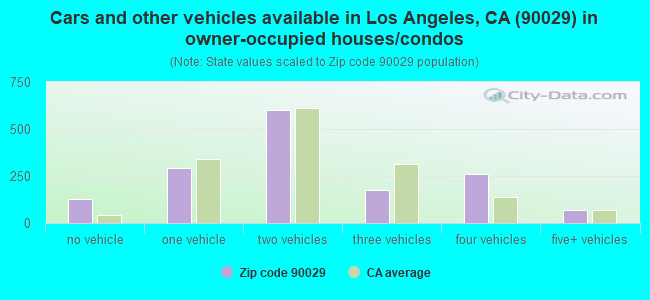
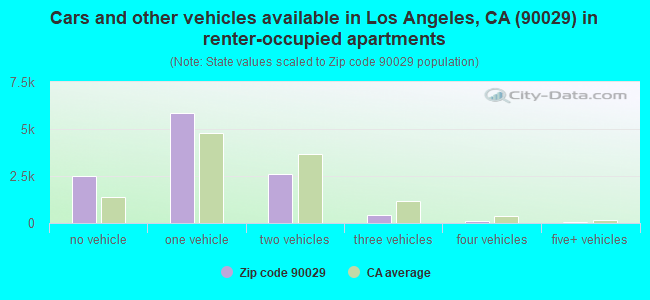
Houses and condos: 14,644 Renter-occupied apartments: 11,498
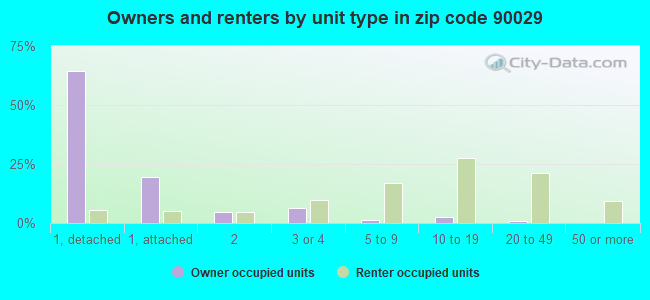
% of renters here:
88%
State:
44%
March 2022 cost of living index in zip code 90029: 151.4 (very high, U.S. average is 100)
Land area: 1.4 sq. mi. Water area: 0.0 sq. mi.
Population density: 25,233 people per square mile
(very high).
OSM Map
General Map
Google Map
MSN Map
OSM Map
General Map
Google Map
MSN Map
OSM Map
General Map
Google Map
MSN Map
OSM Map
General Map
Google Map
MSN Map
Please wait while loading the map...
Real estate property taxes paid for housing units in 2022:
This zip code:
0.5% ($6,038)
California:
0.7% ($4,831)
Median real estate property taxes paid for housing units with mortgages in 2022: $6,959 (0.6%) Median real estate property taxes paid for housing units with no mortgage in 2022: $4,652 (0.4%)
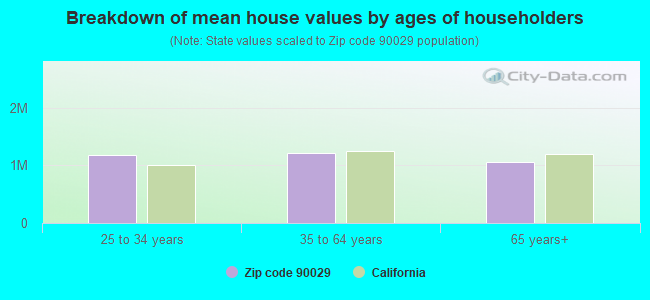
Estimated median house/condo value in 2022: $1,120,922
90029:
$1,120,922
California:
$715,900
According to our research of California and other state lists, there were 30 registered sex offenders living in 90029 zip code as of April 27, 2024. The ratio of all residents to sex offenders in zip code 90029 is 1,361 to 1. The ratio of registered sex offenders to all residents in this zip code is lower than the state average.
Median resident age:
This zip code:
37.3 years
California median age:
37.9 years
Average household size:
This zip code:
2.5 people
California:
2.8 people
Averages for the 2020 tax year for zip code 90029, filed in 2021:
Average Adjusted Gross Income (AGI) in 2020: $43,911 (Individual Income Tax Returns)
Here:
$43,911
State:
$95,910
Salary/wage: $41,427 (reported on 79.4% of returns)
Here:
$41,427
State:
$77,331
(% of AGI for various income ranges: 1224.9% for AGIs below $25k, 4126.0% for AGIs $25k-50k, 7674.8% for AGIs $50k-75k, 12191.0% for AGIs $75k-100k, 20438.0% for AGIs $100k-200k, 93025.7% for AGIs over 200k)
Taxable interest for individuals: $1,103 (reported on 15.5% of returns)
This zip code:
$1,103
California:
$2,294
(% of AGI for various income ranges: 7.5% for AGIs below $25k, 9.4% for AGIs $25k-50k, 18.2% for AGIs $50k-75k, 34.2% for AGIs $75k-100k, 227.6% for AGIs $100k-200k, 838.6% for AGIs over 200k)
Ordinary dividends: $2,585 (reported on 9.1% of returns)
Here:
$2,585
State:
$10,949
(% of AGI for various income ranges: 7.2% for AGIs below $25k, 11.7% for AGIs $25k-50k, 30.2% for AGIs $50k-75k, 94.8% for AGIs $75k-100k, 201.6% for AGIs $100k-200k, 1780.0% for AGIs over 200k)
Net capital gain/loss in AGI: +$13,273 (reported on 9.8% of returns)
Here:
+$13,273
State:
+$49,306
(% of AGI for various income ranges: 6.9% for AGIs below $25k, 15.6% for AGIs $25k-50k, 46.6% for AGIs $50k-75k, 146.8% for AGIs $75k-100k, 426.5% for AGIs $100k-200k, 25852.9% for AGIs over 200k)
Profit/loss from business: +$7,826 (reported on 28.7% of returns)
Here:
+$7,826
State:
+$15,671
(% of AGI for various income ranges: 362.3% for AGIs below $25k, 257.3% for AGIs $25k-50k, 307.3% for AGIs $50k-75k, 451.0% for AGIs $75k-100k, 710.5% for AGIs $100k-200k, 3848.6% for AGIs over 200k)
Taxable individual retirement arrangement distribution: $12,666 (reported on 1.8% of returns)
90029:
$12,666
California:
$23,505
(% of AGI for various income ranges: 14.2% for AGIs below $25k, 17.6% for AGIs $25k-50k, 39.1% for AGIs $50k-75k, 96.9% for AGIs $75k-100k, 284.9% for AGIs $100k-200k)
Self-employed (Keogh) retirement plans: $19,760 (reported on 0.3% of returns)
90029:
$19,760
California:
$30,163
(% of AGI for various income ranges: 179.6% for AGIs $100k-200k)
Total itemized deductions: $33,757 (reported on 4.3% of returns)
Here:
$33,757
State:
$39,517
(% of AGI for various income ranges: 24.6% for AGIs below $25k, 76.4% for AGIs $25k-50k, 255.1% for AGIs $50k-75k, 472.9% for AGIs $75k-100k, 1277.3% for AGIs $100k-200k, 11118.6% for AGIs over 200k)
Charity contributions: $6,465 (reported on 3.5% of returns)
Here:
$6,465
State:
$12,598
(% of AGI for various income ranges: 1.2% for AGIs below $25k, 10.2% for AGIs $25k-50k, 40.8% for AGIs $50k-75k, 102.3% for AGIs $75k-100k, 221.1% for AGIs $100k-200k, 1552.9% for AGIs over 200k)
Taxes paid: $7,316 (reported on 4.3% of returns)
90029:
$7,316
State:
$8,807
(% of AGI for various income ranges: 5.0% for AGIs below $25k, 12.8% for AGIs $25k-50k, 51.2% for AGIs $50k-75k, 124.2% for AGIs $75k-100k, 374.2% for AGIs $100k-200k, 1765.7% for AGIs over 200k)
Earned income credit: $1,650 (reported on 19.3% of returns)
Here:
$1,650
State:
$2,074
(% of AGI for various income ranges: 83.9% for AGIs below $25k, 52.1% for AGIs $25k-50k)
Percentage of individuals using paid preparers for their 2020 taxes: 90.9%
Here:
91%
State:
92%
(% for various income ranges: 88.2% for AGIs below $25k, 92.1% for AGIs $25k-50k, 93.2% for AGIs $50k-75k, 94.2% for AGIs $75k-100k, 94.2% for AGIs $100k-200k, 93.3% for AGIs over 200k)
Averages for the 2012 tax year for zip code 90029, filed in 2013:
Average Adjusted Gross Income (AGI) in 2012: $30,564 (Individual Income Tax Returns)
Here:
$30,564
State:
$72,726
Salary/wage: $30,514 (reported on 82.0% of returns)
Here:
$30,514
State:
$59,079
(% of AGI for various income ranges: 75.5% for AGIs below $25k, 89.7% for AGIs $25k-50k, 85.9% for AGIs $50k-75k, 86.3% for AGIs $75k-100k, 82.5% for AGIs $100k-200k, 50.4% for AGIs over 200k)
Taxable interest for individuals: $719 (reported on 14.4% of returns)
This zip code:
$719
California:
$2,146
(% of AGI for various income ranges: 0.3% for AGIs below $25k, 0.2% for AGIs $25k-50k, 0.3% for AGIs $50k-75k, 0.3% for AGIs $75k-100k, 0.4% for AGIs $100k-200k, 1.2% for AGIs over 200k)
Ordinary dividends: $3,199 (reported on 5.5% of returns)
Here:
$3,199
State:
$9,308
(% of AGI for various income ranges: 0.3% for AGIs below $25k, 0.4% for AGIs $25k-50k, 0.7% for AGIs $50k-75k, 0.7% for AGIs $75k-100k, 0.8% for AGIs $100k-200k, 1.6% for AGIs over 200k)
Net capital gain/loss in AGI: +$4,554 (reported on 4.6% of returns)
Here:
+$4,554
State:
+$30,460
(% of AGI for various income ranges: 0.2% for AGIs $50k-75k, 0.6% for AGIs $75k-100k, 0.7% for AGIs $100k-200k, 7.9% for AGIs over 200k)
Profit/loss from business: +$9,046 (reported on 25.5% of returns)
Here:
+$9,046
State:
+$17,064
(% of AGI for various income ranges: 18.3% for AGIs below $25k, 4.9% for AGIs $25k-50k, 3.6% for AGIs $50k-75k, 3.1% for AGIs $75k-100k, 2.1% for AGIs $100k-200k, 6.4% for AGIs over 200k)
Taxable individual retirement arrangement distribution: $12,481 (reported on 2.2% of returns)
90029:
$12,481
California:
$19,557
(% of AGI for various income ranges: 0.5% for AGIs below $25k, 0.6% for AGIs $25k-50k, 1.2% for AGIs $50k-75k, 0.6% for AGIs $75k-100k, 2.5% for AGIs $100k-200k)
Self-employment retirement plans: $13,733 (reported on 0.2% of returns)
90029:
$13,733
California:
$24,530
Total itemized deductions: $20,566 (28% of AGI, reported on 13.8% of returns)
Here:
$20,566
State:
$34,004
Here:
27.8% of AGI
State:
22.7% of AGI
(% of AGI for various income ranges: 3.7% for AGIs below $25k, 6.6% for AGIs $25k-50k, 11.0% for AGIs $50k-75k, 14.0% for AGIs $75k-100k, 17.4% for AGIs $100k-200k, 17.6% for AGIs over 200k)
Charity contributions: $2,463 (reported on 10.7% of returns)
Here:
$2,463
State:
$4,659
(% of AGI for various income ranges: 0.3% for AGIs below $25k, 0.6% for AGIs $25k-50k, 1.2% for AGIs $50k-75k, 1.4% for AGIs $75k-100k, 1.7% for AGIs $100k-200k, 0.9% for AGIs over 200k)
Taxes paid: $6,264 (reported on 13.7% of returns)
90029:
$6,264
State:
$14,448
(% of AGI for various income ranges: 0.6% for AGIs below $25k, 1.2% for AGIs $25k-50k, 2.8% for AGIs $50k-75k, 5.0% for AGIs $75k-100k, 6.7% for AGIs $100k-200k, 8.6% for AGIs over 200k)
Earned income credit: $2,088 (reported on 29.1% of returns)
Here:
$2,088
State:
$2,286
(% of AGI for various income ranges: 6.8% for AGIs below $25k, 1.0% for AGIs $25k-50k)
Percentage of individuals using paid preparers for their 2012 taxes: 71.7%
Here:
72%
State:
64%
(% for various income ranges: 73.0% for AGIs below $25k, 70.4% for AGIs $25k-50k, 66.2% for AGIs $50k-75k, 70.9% for AGIs $75k-100k, 72.3% for AGIs $100k-200k, 88.9% for AGIs over 200k)
Averages for the 2004 tax year for zip code 90029, filed in 2005:
Average Adjusted Gross Income (AGI) in 2004: $24,338 (Individual Income Tax Returns)
Here:
$24,338
State:
$58,600
Salary/wage: $25,091 (reported on 83.5% of returns)
Here:
$25,091
State:
$49,455
(% of AGI for various income ranges: 101.4% for AGIs below $10k, 85.2% for AGIs $10k-25k, 92.1% for AGIs $25k-50k, 89.2% for AGIs $50k-75k, 83.8% for AGIs $75k-100k, 60.1% for AGIs over 100k)
Taxable interest for individuals: $828 (reported on 19.9% of returns)
This zip code:
$828
California:
$2,365
(% of AGI for various income ranges: 2.1% for AGIs below $10k, 0.5% for AGIs $10k-25k, 0.5% for AGIs $25k-50k, 0.6% for AGIs $50k-75k, 1.2% for AGIs $75k-100k, 1.1% for AGIs over 100k)
Taxable dividends: $1,607 (reported on 5.5% of returns)
Here:
$1,607
State:
$4,746
(% of AGI for various income ranges: 0.8% for AGIs below $10k, 0.2% for AGIs $10k-25k, 0.2% for AGIs $25k-50k, 0.7% for AGIs $50k-75k, 1.0% for AGIs $75k-100k, 0.4% for AGIs over 100k)
Net capital gain/loss: +$8,079 (reported on 5.1% of returns)
Here:
+$8,079
State:
+$23,418
(% of AGI for various income ranges: -0.9% for AGIs below $10k, 0.0% for AGIs $10k-25k, 0.3% for AGIs $25k-50k, 0.8% for AGIs $50k-75k, 2.0% for AGIs $75k-100k, 12.8% for AGIs over 100k)
Profit/loss from business: +$7,214 (reported on 24.5% of returns)
Here:
+$7,214
State:
+$16,826
(% of AGI for various income ranges: 49.0% for AGIs below $10k, 11.2% for AGIs $10k-25k, 3.4% for AGIs $25k-50k, 2.8% for AGIs $50k-75k, 2.8% for AGIs $75k-100k, 4.8% for AGIs over 100k)
IRA payment deduction: $2,455 (reported on 1.6% of returns)
90029:
$2,455
California:
$3,192
(% of AGI for various income ranges: 0.3% for AGIs below $10k, 0.1% for AGIs $10k-25k, 0.2% for AGIs $25k-50k, 0.2% for AGIs $50k-75k, 0.1% for AGIs $75k-100k, 0.2% for AGIs over 100k)
Self-employed pension: $10,481 (reported on 0.2% of returns)
Here:
$10,481
California:
$17,688
Total itemized deductions: $18,594 (34% of AGI, reported on 15.5% of returns)
Here:
$18,594
State:
$28,113
Here:
34.3% of AGI
State:
25.3% of AGI
(% of AGI for various income ranges: 7.5% for AGIs below $10k, 5.1% for AGIs $10k-25k, 9.7% for AGIs $25k-50k, 16.4% for AGIs $50k-75k, 20.2% for AGIs $75k-100k, 26.0% for AGIs over 100k)
Charity contributions deductions: $2,974 (5% of AGI, reported on 13.0% of returns)
Here:
$2,974
State:
$3,923
Here:
5.3% of AGI
State:
3.3% of AGI
(% of AGI for various income ranges: 0.3% for AGIs below $10k, 0.5% for AGIs $10k-25k, 1.4% for AGIs $25k-50k, 2.6% for AGIs $50k-75k, 2.8% for AGIs $75k-100k, 3.4% for AGIs over 100k)
Total tax: $2,682 (reported on 67.1% of returns)
90029:
$2,682
State:
$10,761
(% of AGI for various income ranges: 8.7% for AGIs below $10k, 4.1% for AGIs $10k-25k, 6.1% for AGIs $25k-50k, 9.3% for AGIs $50k-75k, 11.3% for AGIs $75k-100k, 14.6% for AGIs over 100k)
Earned income credit: $1,820 (reported on 35.0% of returns)
Here:
$1,820
State:
$1,763
Percentage of individuals using paid preparers for their 2004 taxes: 75.2%
Here:
75%
State:
66%
(% for various income ranges: 72.6% for AGIs below $10k, 77.5% for AGIs $10k-25k, 73.6% for AGIs $25k-50k, 75.1% for AGIs $50k-75k, 81.1% for AGIs $75k-100k, 81.1% for AGIs over 100k)
Likely homosexual households (counted as self-reported same-sex unmarried-partner households)
Lesbian couples: 0.3% of all households
Gay men: 0.5% of all households
Household received Food Stamps/SNAP in the past 12 months: 2,205 Household did not receive Food Stamps/SNAP in the past 12 months: 10,972
Women who had a birth in the past 12 months: 295 (138 now married, 159 unmarried) Women who did not have a birth in the past 12 months: 9,022 (3,049 now married, 5,994 unmarried)
Housing units in zip code 90029 with a mortgage: 1,044 (107 second mortgage, 100 both second mortgage and home equity loan) Median monthly owner costs for units with a mortgage: $3,526 Median monthly owner costs for units without a mortgage: $802
Residents with income below the poverty level in 2022:
This zip code:
22.4%
Whole state:
12.2%
Residents with income below 50% of the poverty level in 2022:
This zip code:
11.3%
Whole state:
6.2%
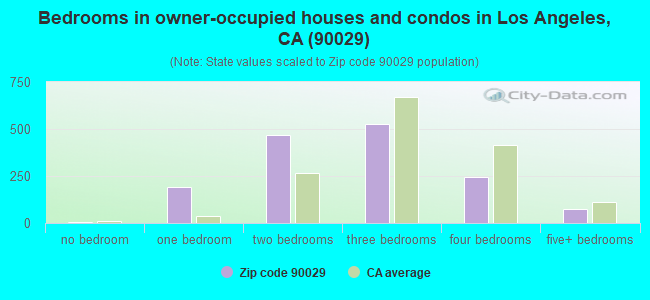
Median number of rooms in houses and condos:
Here:
5.5
State:
6.0
Median number of rooms in apartments:
Here:
2.6
State:
3.9
Notable locations in this zip code not listed on our city pages
Notable locations in zip code 90029: Cahuenga Branch Los Angeles Public Library (A), Whitson Hall (B), Ukranian Culture Center (C), Margaret Hall (D), Leitzel Hall (E), Laird Hall (F), Holmes Hall (G), City of Los Angeles Fire Department Station 52 (H), Martin Luther King Library (I), Jefferson Hall (J), Hollywood South Workforce Center (K), Franklin Hall (L), Da Vinici Hall (M), Cub Center (N), Clausen Hall (O), Cesar Chavez Administration Building (P). Display/hide their locations on the map
Churches in zip code 90029 include: Immaculate Heart of Mary Church (A), Monroe Street Christian Church (B), Saint Valdimir Orthodox Church (C), South Hollywood Presbyterian Church (D), Anavath Israel Synagogue (E), First Church of the Nazarene (F), Hollywood Independent Church (G), Hollywood Seventh Day Adventist Church (H), Knesseth Israel Synagogue (I). Display/hide their locations on the map
2,682 married couples with children.
1,939 single-parent households (674 men, 1,265 women).
31.5% of residents of 90029 zip code speak English at home.
46.8% of residents speak Spanish at home (40% very well, 26% well, 25% not well, 9% not at all).
8.1% of residents speak other Indo-European language at home (54% very well, 19% well, 16% not well, 12% not at all).
12.4% of residents speak Asian or Pacific Island language at home (40% very well, 40% well, 16% not well, 4% not at all).
1.6% of residents speak other language at home (48% very well, 52% well).
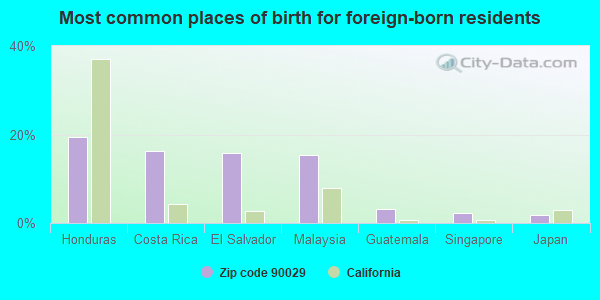
Foreign born population: 17,293 (50.3%) (44.3% of them are naturalized citizens)
Major facilities with environmental interests located in this zip code:
LAUSD KING THOMAS STARR JR HIGH SCHOOL (4201 FOUNTAIN AVE in LOS ANGELES, CA)
STATE MASTER (California - Hazardous Waste Tracking) - HAZARDOU WASTE PROGRAM Small Quantity Generators, between 100 kg and 1000 kg of hazardous waste/month (Resource Conservation and Recovery Act (tracking hazardous waste)) - notification Small Quantity Generators, between 100 kg and 1000 kg of hazardous waste/month (Resource Conservation and Recovery Act (tracking hazardous waste)) - notification Organizations: LA USD (CONTACT/OWNER)
Alternative names: LA USD KING JH, LAUSD/ KING THOMAS STARR JH
LA USD LOCKWOOD EL (4345 LOCKWOOD AVE in LOS ANGELES, CA)
STATE MASTER (California - Hazardous Waste Tracking) - HAZARDOU WASTE PROGRAM Small Quantity Generators, between 100 kg and 1000 kg of hazardous waste/month (Resource Conservation and Recovery Act (tracking hazardous waste)) - notification Alternative names: LAUSD/LOCKWOOD AVE ELEM., LOCKWOOD AVENUE ELEMENTARY
KAROS TRUCKING (1001 AND ONE HALF N NORMANDIE in LOS ANGELES, CA)
STATE MASTER (California - Hazardous Waste Tracking) - HAZARDOU WASTE PROGRAM TRANSPORTER (Resource Conservation and Recovery Act (tracking hazardous waste)) Organizations: KARAPET TEKEIAN (CONTACT/OWNER)
CHEVRON STATION 90074 (4666 SANTA MONICA BLVD in LOS ANGELES, CA)
STATE MASTER (California - Hazardous Waste Tracking) - HAZARDOU WASTE PROGRAM Small Quantity Generators, between 100 kg and 1000 kg of hazardous waste/month (Resource Conservation and Recovery Act (tracking hazardous waste)) - notification Organizations: CHEVRON PRODUCTS CO (CONTACT/OWNER)
CHEVRON STATION 90905 (4590 MELROSE AV in LOS ANGELES, CA)
STATE MASTER (California - Hazardous Waste Tracking) - HAZARDOU WASTE PROGRAM Small Quantity Generators, between 100 kg and 1000 kg of hazardous waste/month (Resource Conservation and Recovery Act (tracking hazardous waste)) - notification Organizations: CHEVRON USA PRODUCTS CO (CONTACT/OWNER)
CHEVRON STATION 98723 (1276 N WESTERN AVE in LOS ANGELES, CA)
STATE MASTER (California - Hazardous Waste Tracking) - HAZARDOU WASTE PROGRAM Small Quantity Generators, between 100 kg and 1000 kg of hazardous waste/month (Resource Conservation and Recovery Act (tracking hazardous waste)) - notification Organizations: CHEVRON PRODUCTS CO (CONTACT/OWNER)
Alternative names: CHEVRON STATION NO 98723
KING (THOMAS STARR) MIDDLE (4201 FOUNTAIN AVE. in LOS ANGELES, CA)
(National Center for Education Statistics) - STATE ID-6058085 Organizations: LOS ANGELES UNIFIED (SCHOOL DISTRICT)
LIBERTY & TAGS FORMS INC (1019 NO MADISON AVENUE in LOS ANGELES, CA)
Small Quantity Generators, between 100 kg and 1000 kg of hazardous waste/month (Resource Conservation and Recovery Act (tracking hazardous waste)) Small Quantity Generators, between 100 kg and 1000 kg of hazardous waste/month (Resource Conservation and Recovery Act (tracking hazardous waste)) Business NAICS classification: OTHER COMMERCIAL PRINTING. Alternative names: LIBERTY TAGS FORMS INC
ACME RENTS (4969 SANTA MONICA BLVD in LOS ANGELES, CA)
Small Quantity Generators, between 100 kg and 1000 kg of hazardous waste/month (Resource Conservation and Recovery Act (tracking hazardous waste)) - notification Organizations: ACME RENTS INC (CONTACT/OWNER)
FOUNTAIN MOTORS (4370 FOUNTAIN AVE in LOS ANGELES, CA)
Small Quantity Generators, between 100 kg and 1000 kg of hazardous waste/month (Resource Conservation and Recovery Act (tracking hazardous waste)) - notification Business NAICS classification: GENERAL AUTOMOTIVE REPAIR. Organizations: RALPH H MIZRAHIE (CONTACT/OWNER)
LA CAHUENGA LIBRARY (4591 SANTA MONICA BLVD in LOS ANGELES, CA)
Small Quantity Generators, between 100 kg and 1000 kg of hazardous waste/month (Resource Conservation and Recovery Act (tracking hazardous waste)) - notification Organizations: CITY OF LOS ANGELES (CONTACT/OWNER)
LA VIRGIL AVENUE YARD (4550 SANTA MONICA BLVD in LOS ANGELES, CA)
Small Quantity Generators, between 100 kg and 1000 kg of hazardous waste/month (Resource Conservation and Recovery Act (tracking hazardous waste)) - notification Organizations: CITY OF LOS ANGELES (CONTACT/OWNER)
NIFTY SVCS CORP (4707 MELROSE AVE in LOS ANGELES, CA)
Small Quantity Generators, between 100 kg and 1000 kg of hazardous waste/month (Resource Conservation and Recovery Act (tracking hazardous waste)) Organizations: WILLIAM WOLFENBARGER (CONTACT/OWNER)
Housing units lacking complete plumbing facilities: 1.6% Housing units lacking complete kitchen facilities: 2.3%
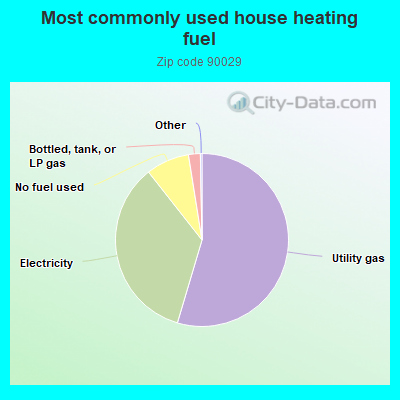
54.6%Utility gas
34.8%Electricity
8.1%No fuel used
2.2%Bottled, tank, or LP gas
Population in 1990: 41,120. Population change in the 1990s: +577 (+1.4%).
Place of birth for U.S.-born residents:
This state: 11,662
Northeast: 1,525
Midwest: 1,363
South: 1,205
West: 816
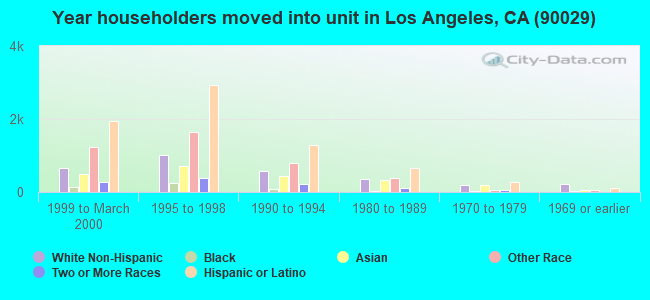
53% of the 90029 zip code residents lived in the same house 5 years ago. Out of people who lived in different houses, 90% lived in this county. Out of people who lived in different counties, 50% lived in California.
90% of the 90029 zip code residents lived in the same house 1 year ago. Out of people who lived in different houses, 71% moved from this county. Out of people who lived in different houses, 9% moved from different county within same state. Out of people who lived in different houses, 14% moved from different state. Out of people who lived in different houses, 4% moved from abroad.
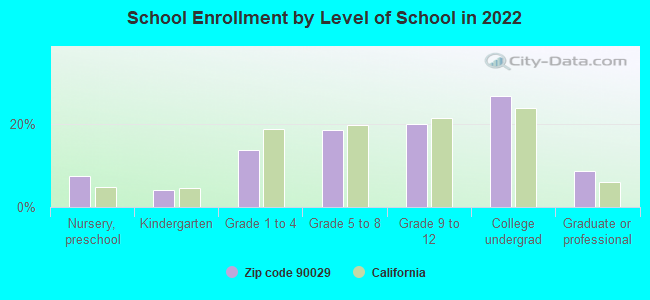
Private vs. public school enrollment:
Students in private schools in grades 1 to 8 (elementary and middle school): 210
Here:
10.0%
California:
10.5%
Students in private schools in grades 9 to 12 (high school): 47
Here:
3.7%
California:
8.5%
Students in private undergraduate colleges: 164
Here:
9.5%
California:
15.9%
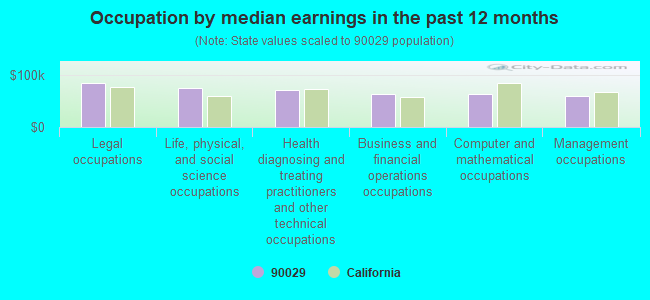
Occupation by median earnings in the past 12 months ($)
84,971Legal occupations
75,603Life, physical, and social science occupations
71,683Health diagnosing and treating practitioners and other technical occupations
63,853Business and financial operations occupations
62,982Computer and mathematical occupations
60,415Management occupations
Top industries in this zip code by the number of employees in 2005:
2005 - 2018 National Fire Incident Reporting System (NFIRS) incidents
According to the data from the years 2005 - 2018 the average number of fires per year is 81. The highest number of fire incidents - 137 took place in 2017, and the least - 50 in 2012. The data has an increasing trend.
When looking into fire subcategories, the most incidents belonged to: Structure Fires (49.4%), and Outside Fires (31.5%).
Fire incident types reported to NFIRS in Zip Code 90029

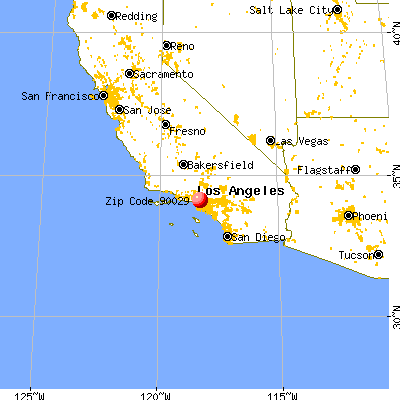


 Nearest zip codes: 90004, 90020, 90038, 90005, 90057, 90026.


 According to the data from the years 2005 - 2018 the average number of fires per year is 81. The highest number of fire incidents - 137 took place in 2017, and the least - 50 in 2012. The data has an increasing trend.
 When looking into fire subcategories, the most incidents belonged to: Structure Fires (49.4%), and Outside Fires (31.5%).