Estimated zip code population in 2022: 64,231 Zip code population in 2010: 67,869 Zip code population in 2000: 73,671
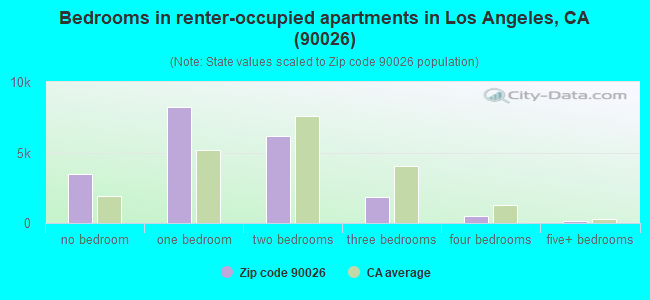
Houses and condos: 28,574 Renter-occupied apartments: 20,264
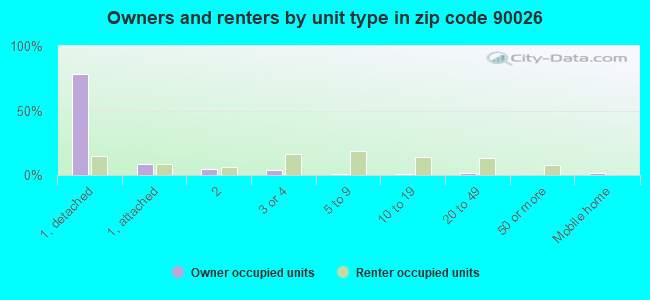
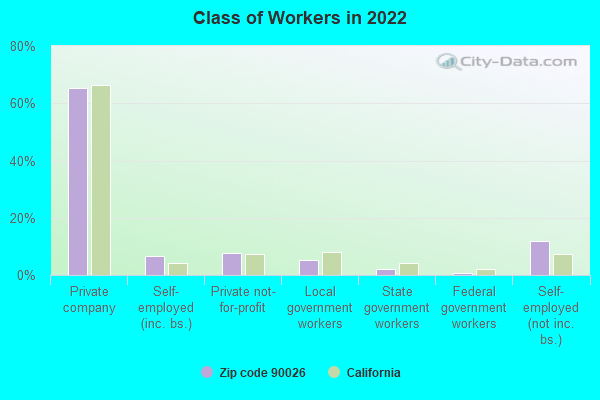
% of renters here:
76%
State:
44%
March 2022 cost of living index in zip code 90026: 144.2 (very high, U.S. average is 100)
Land area: 4.2 sq. mi. Water area: 0.1 sq. mi.
Population density: 15,199 people per square mile
(very high).
OSM Map
General Map
Google Map
MSN Map
OSM Map
General Map
Google Map
MSN Map
OSM Map
General Map
Google Map
MSN Map
OSM Map
General Map
Google Map
MSN Map
Please wait while loading the map...
Real estate property taxes paid for housing units in 2022:
This zip code:
0.6% ($6,689)
California:
0.7% ($4,831)
Median real estate property taxes paid for housing units with mortgages in 2022: $7,521 (0.6%) Median real estate property taxes paid for housing units with no mortgage in 2022: $3,494 (0.3%)
Estimated median house/condo value in 2022: $1,203,663
90026:
$1,203,663
California:
$715,900
According to our research of California and other state lists, there were 67 registered sex offenders living in 90026 zip code as of April 26, 2024. The ratio of all residents to sex offenders in zip code 90026 is 1,023 to 1. The ratio of registered sex offenders to all residents in this zip code is lower than the state average.
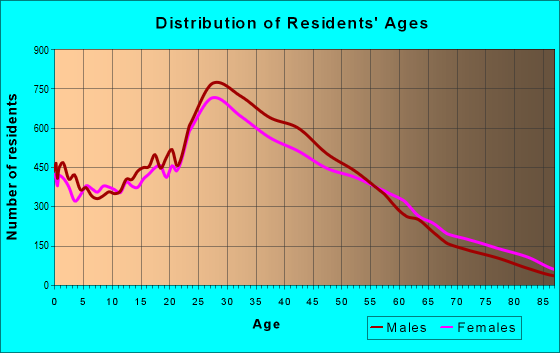
Median resident age:
This zip code:
36.7 years
California median age:
37.9 years
Average household size:
This zip code:
2.3 people
California:
2.8 people
Averages for the 2020 tax year for zip code 90026, filed in 2021:
Average Adjusted Gross Income (AGI) in 2020: $65,078 (Individual Income Tax Returns)
Here:
$65,078
State:
$95,910
Salary/wage: $57,927 (reported on 81.1% of returns)
Here:
$57,927
State:
$77,331
(% of AGI for various income ranges: 1163.6% for AGIs below $25k, 4068.5% for AGIs $25k-50k, 7741.7% for AGIs $50k-75k, 11493.2% for AGIs $75k-100k, 20810.2% for AGIs $100k-200k, 105942.5% for AGIs over 200k)
Taxable interest for individuals: $1,063 (reported on 23.7% of returns)
This zip code:
$1,063
California:
$2,294
(% of AGI for various income ranges: 10.3% for AGIs below $25k, 16.8% for AGIs $25k-50k, 25.0% for AGIs $50k-75k, 44.7% for AGIs $75k-100k, 115.2% for AGIs $100k-200k, 748.5% for AGIs over 200k)
Ordinary dividends: $4,593 (reported on 16.2% of returns)
Here:
$4,593
State:
$10,949
(% of AGI for various income ranges: 18.8% for AGIs below $25k, 32.8% for AGIs $25k-50k, 61.9% for AGIs $50k-75k, 123.3% for AGIs $75k-100k, 415.1% for AGIs $100k-200k, 2484.8% for AGIs over 200k)
Net capital gain/loss in AGI: +$25,641 (reported on 16.4% of returns)
Here:
+$25,641
State:
+$49,306
(% of AGI for various income ranges: 10.5% for AGIs below $25k, 42.3% for AGIs $25k-50k, 97.8% for AGIs $50k-75k, 213.3% for AGIs $75k-100k, 674.5% for AGIs $100k-200k, 28801.8% for AGIs over 200k)
Profit/loss from business: +$10,682 (reported on 28.4% of returns)
Here:
+$10,682
State:
+$15,671
(% of AGI for various income ranges: 320.5% for AGIs below $25k, 316.0% for AGIs $25k-50k, 421.4% for AGIs $50k-75k, 474.6% for AGIs $75k-100k, 1157.6% for AGIs $100k-200k, 4346.2% for AGIs over 200k)
Taxable individual retirement arrangement distribution: $13,151 (reported on 2.8% of returns)
90026:
$13,151
California:
$23,505
(% of AGI for various income ranges: 20.0% for AGIs below $25k, 25.6% for AGIs $25k-50k, 51.0% for AGIs $50k-75k, 114.6% for AGIs $75k-100k, 216.0% for AGIs $100k-200k, 465.8% for AGIs over 200k)
Self-employed (Keogh) retirement plans: $21,573 (reported on 0.8% of returns)
90026:
$21,573
California:
$30,163
(% of AGI for various income ranges: 6.0% for AGIs $25k-50k, 16.0% for AGIs $50k-75k, 78.3% for AGIs $100k-200k, 853.8% for AGIs over 200k)
Total itemized deductions: $29,823 (reported on 8.7% of returns)
Here:
$29,823
State:
$39,517
(% of AGI for various income ranges: 55.8% for AGIs below $25k, 130.7% for AGIs $25k-50k, 292.5% for AGIs $50k-75k, 523.7% for AGIs $75k-100k, 1428.0% for AGIs $100k-200k, 7679.0% for AGIs over 200k)
Charity contributions: $5,670 (reported on 7.2% of returns)
Here:
$5,670
State:
$12,598
(% of AGI for various income ranges: 2.6% for AGIs below $25k, 17.0% for AGIs $25k-50k, 40.5% for AGIs $50k-75k, 68.6% for AGIs $75k-100k, 190.8% for AGIs $100k-200k, 1588.0% for AGIs over 200k)
Taxes paid: $8,372 (reported on 8.7% of returns)
90026:
$8,372
State:
$8,807
(% of AGI for various income ranges: 10.7% for AGIs below $25k, 29.9% for AGIs $25k-50k, 79.2% for AGIs $50k-75k, 165.7% for AGIs $75k-100k, 469.5% for AGIs $100k-200k, 1973.3% for AGIs over 200k)
Earned income credit: $1,625 (reported on 15.6% of returns)
Here:
$1,625
State:
$2,074
(% of AGI for various income ranges: 78.5% for AGIs below $25k, 48.0% for AGIs $25k-50k, 0.5% for AGIs $50k-75k)
Percentage of individuals using paid preparers for their 2020 taxes: 92.4%
Here:
92%
State:
92%
(% for various income ranges: 89.9% for AGIs below $25k, 92.7% for AGIs $25k-50k, 93.4% for AGIs $50k-75k, 94.5% for AGIs $75k-100k, 95.2% for AGIs $100k-200k, 96.8% for AGIs over 200k)
Averages for the 2012 tax year for zip code 90026, filed in 2013:
Average Adjusted Gross Income (AGI) in 2012: $42,168 (Individual Income Tax Returns)
Here:
$42,168
State:
$72,726
Salary/wage: $40,459 (reported on 83.8% of returns)
Here:
$40,459
State:
$59,079
(% of AGI for various income ranges: 74.5% for AGIs below $25k, 86.4% for AGIs $25k-50k, 86.2% for AGIs $50k-75k, 83.9% for AGIs $75k-100k, 80.7% for AGIs $100k-200k, 67.3% for AGIs over 200k)
Taxable interest for individuals: $779 (reported on 22.1% of returns)
This zip code:
$779
California:
$2,146
(% of AGI for various income ranges: 0.4% for AGIs below $25k, 0.3% for AGIs $25k-50k, 0.3% for AGIs $50k-75k, 0.4% for AGIs $75k-100k, 0.5% for AGIs $100k-200k, 0.7% for AGIs over 200k)
Ordinary dividends: $3,670 (reported on 10.8% of returns)
Here:
$3,670
State:
$9,308
(% of AGI for various income ranges: 0.7% for AGIs below $25k, 0.5% for AGIs $25k-50k, 0.8% for AGIs $50k-75k, 0.8% for AGIs $75k-100k, 1.2% for AGIs $100k-200k, 1.8% for AGIs over 200k)
Net capital gain/loss in AGI: +$6,346 (reported on 8.8% of returns)
Here:
+$6,346
State:
+$30,460
(% of AGI for various income ranges: 0.2% for AGIs $25k-50k, 0.4% for AGIs $50k-75k, 0.4% for AGIs $75k-100k, 1.6% for AGIs $100k-200k, 5.9% for AGIs over 200k)
Profit/loss from business: +$10,287 (reported on 26.6% of returns)
Here:
+$10,287
State:
+$17,064
(% of AGI for various income ranges: 16.9% for AGIs below $25k, 6.2% for AGIs $25k-50k, 3.6% for AGIs $50k-75k, 4.3% for AGIs $75k-100k, 4.3% for AGIs $100k-200k, 4.6% for AGIs over 200k)
Taxable individual retirement arrangement distribution: $11,326 (reported on 3.0% of returns)
90026:
$11,326
California:
$19,557
(% of AGI for various income ranges: 0.8% for AGIs below $25k, 0.6% for AGIs $25k-50k, 0.9% for AGIs $50k-75k, 1.2% for AGIs $75k-100k, 0.8% for AGIs $100k-200k, 0.8% for AGIs over 200k)
Self-employment retirement plans: $14,244 (reported on 0.6% of returns)
90026:
$14,244
California:
$24,530
(% of AGI for various income ranges: 0.2% for AGIs $75k-100k, 0.3% for AGIs $100k-200k, 0.6% for AGIs over 200k)
Total itemized deductions: $23,532 (25% of AGI, reported on 22.9% of returns)
Here:
$23,532
State:
$34,004
Here:
24.9% of AGI
State:
22.7% of AGI
(% of AGI for various income ranges: 5.7% for AGIs below $25k, 8.0% for AGIs $25k-50k, 12.2% for AGIs $50k-75k, 15.5% for AGIs $75k-100k, 18.3% for AGIs $100k-200k, 18.3% for AGIs over 200k)
Charity contributions: $2,347 (reported on 17.9% of returns)
Here:
$2,347
State:
$4,659
(% of AGI for various income ranges: 0.3% for AGIs below $25k, 0.7% for AGIs $25k-50k, 1.1% for AGIs $50k-75k, 1.3% for AGIs $75k-100k, 1.4% for AGIs $100k-200k, 1.3% for AGIs over 200k)
Taxes paid: $8,498 (reported on 22.9% of returns)
90026:
$8,498
State:
$14,448
(% of AGI for various income ranges: 0.9% for AGIs below $25k, 1.5% for AGIs $25k-50k, 3.4% for AGIs $50k-75k, 5.8% for AGIs $75k-100k, 7.8% for AGIs $100k-200k, 9.2% for AGIs over 200k)
Earned income credit: $1,958 (reported on 23.9% of returns)
Here:
$1,958
State:
$2,286
(% of AGI for various income ranges: 6.2% for AGIs below $25k, 0.9% for AGIs $25k-50k)
Percentage of individuals using paid preparers for their 2012 taxes: 69.3%
Here:
69%
State:
64%
(% for various income ranges: 70.0% for AGIs below $25k, 67.3% for AGIs $25k-50k, 66.2% for AGIs $50k-75k, 67.3% for AGIs $75k-100k, 75.4% for AGIs $100k-200k, 84.2% for AGIs over 200k)
Averages for the 2004 tax year for zip code 90026, filed in 2005:
Average Adjusted Gross Income (AGI) in 2004: $31,968 (Individual Income Tax Returns)
Here:
$31,968
State:
$58,600
Salary/wage: $31,260 (reported on 85.0% of returns)
Here:
$31,260
State:
$49,455
(% of AGI for various income ranges: 101.7% for AGIs below $10k, 84.2% for AGIs $10k-25k, 91.0% for AGIs $25k-50k, 87.6% for AGIs $50k-75k, 85.0% for AGIs $75k-100k, 65.8% for AGIs over 100k)
Taxable interest for individuals: $971 (reported on 28.1% of returns)
This zip code:
$971
California:
$2,365
(% of AGI for various income ranges: 3.1% for AGIs below $10k, 0.7% for AGIs $10k-25k, 0.6% for AGIs $25k-50k, 0.6% for AGIs $50k-75k, 1.0% for AGIs $75k-100k, 1.1% for AGIs over 100k)
Taxable dividends: $2,511 (reported on 10.8% of returns)
Here:
$2,511
State:
$4,746
(% of AGI for various income ranges: 2.3% for AGIs below $10k, 0.5% for AGIs $10k-25k, 0.4% for AGIs $25k-50k, 0.5% for AGIs $50k-75k, 0.7% for AGIs $75k-100k, 1.8% for AGIs over 100k)
Net capital gain/loss: +$9,819 (reported on 9.2% of returns)
Here:
+$9,819
State:
+$23,418
(% of AGI for various income ranges: -0.2% for AGIs below $10k, 0.2% for AGIs $10k-25k, 0.2% for AGIs $25k-50k, 1.1% for AGIs $50k-75k, 1.3% for AGIs $75k-100k, 10.5% for AGIs over 100k)
Profit/loss from business: +$7,988 (reported on 22.7% of returns)
Here:
+$7,988
State:
+$16,826
(% of AGI for various income ranges: 33.3% for AGIs below $10k, 9.7% for AGIs $10k-25k, 3.8% for AGIs $25k-50k, 2.9% for AGIs $50k-75k, 2.9% for AGIs $75k-100k, 5.0% for AGIs over 100k)
IRA payment deduction: $2,560 (reported on 2.4% of returns)
90026:
$2,560
California:
$3,192
(% of AGI for various income ranges: 0.4% for AGIs below $10k, 0.2% for AGIs $10k-25k, 0.2% for AGIs $25k-50k, 0.2% for AGIs $50k-75k, 0.2% for AGIs $75k-100k, 0.1% for AGIs over 100k)
Self-employed pension: $9,848 (reported on 0.6% of returns)
Here:
$9,848
California:
$17,688
(% of AGI for various income ranges: 0.1% for AGIs $10k-25k, 0.1% for AGIs $25k-50k, 0.1% for AGIs $50k-75k, 0.2% for AGIs $75k-100k, 0.4% for AGIs over 100k)
Total itemized deductions: $21,060 (31% of AGI, reported on 23.4% of returns)
Here:
$21,060
State:
$28,113
Here:
31.0% of AGI
State:
25.3% of AGI
(% of AGI for various income ranges: 10.4% for AGIs below $10k, 7.3% for AGIs $10k-25k, 14.2% for AGIs $25k-50k, 18.0% for AGIs $50k-75k, 21.5% for AGIs $75k-100k, 19.5% for AGIs over 100k)
Charity contributions deductions: $2,516 (3% of AGI, reported on 19.9% of returns)
Here:
$2,516
State:
$3,923
Here:
3.5% of AGI
State:
3.3% of AGI
(% of AGI for various income ranges: 0.5% for AGIs below $10k, 0.6% for AGIs $10k-25k, 1.3% for AGIs $25k-50k, 2.1% for AGIs $50k-75k, 2.0% for AGIs $75k-100k, 2.2% for AGIs over 100k)
Total tax: $4,528 (reported on 69.4% of returns)
90026:
$4,528
State:
$10,761
(% of AGI for various income ranges: 7.3% for AGIs below $10k, 4.1% for AGIs $10k-25k, 6.7% for AGIs $25k-50k, 10.2% for AGIs $50k-75k, 12.2% for AGIs $75k-100k, 17.6% for AGIs over 100k)
Earned income credit: $1,742 (reported on 27.7% of returns)
Here:
$1,742
State:
$1,763
Percentage of individuals using paid preparers for their 2004 taxes: 74.7%
Here:
75%
State:
66%
(% for various income ranges: 71.3% for AGIs below $10k, 77.4% for AGIs $10k-25k, 73.0% for AGIs $25k-50k, 73.7% for AGIs $50k-75k, 76.6% for AGIs $75k-100k, 81.9% for AGIs over 100k)
Likely homosexual households (counted as self-reported same-sex unmarried-partner households)
Lesbian couples: 0.5% of all households
Gay men: 0.8% of all households
Household received Food Stamps/SNAP in the past 12 months: 4,211 Household did not receive Food Stamps/SNAP in the past 12 months: 22,653
Women who had a birth in the past 12 months: 952 (629 now married, 323 unmarried) Women who did not have a birth in the past 12 months: 17,690 (4,349 now married, 13,452 unmarried)
Housing units in zip code 90026 with a mortgage: 4,505 (379 second mortgage, 21 home equity loan, 345 both second mortgage and home equity loan) Houses without a mortgage: 68
Median monthly owner costs for units with a mortgage: $3,369 Median monthly owner costs for units without a mortgage: $768
Residents with income below the poverty level in 2022:
This zip code:
17.9%
Whole state:
12.2%
Residents with income below 50% of the poverty level in 2022:
This zip code:
10.2%
Whole state:
6.2%
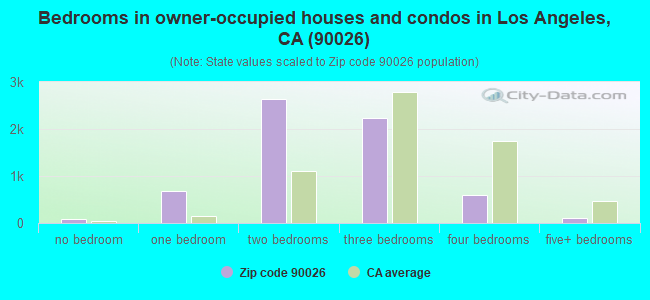
Median number of rooms in houses and condos:
Here:
5.1
State:
6.0
Median number of rooms in apartments:
Here:
3.3
State:
3.9
Notable locations in this zip code not listed on our city pages
Notable locations in zip code 90026: Toluca Sub-Station (A), Echo Park Branch Los Angeles Public Library (B), Saint Francis of Assisi Hall (C), Immaculate Conception Home for Girls (D), Rampart Community Police Station (E), Bob Baker Marionette Theater (F), City of Los Angeles Fire Department Station 20 (G). Display/hide their locations on the map
Churches in zip code 90026 include: Angelus Temple (A), Holy Virgin Mary Russian Orthodox Cathedral (B), Saint Athanasius Episcopal Church (C), Saint Columban Catholic Church (D), Alvarado Church of Christ (E), Armenian Evangelical Brethren Church (F), Bethany Presbyterian Church (G), Calvary Church (H), Providence Congregational Christian Church (I). Display/hide their locations on the map
Parks in zip code 90026 include: Bellevue Park (1), Echo Park (2), Silver Lake Recreation Center (3), Everett Park (4). Display/hide their locations on the map
4,554 married couples with children.
3,283 single-parent households (1,079 men, 2,204 women).
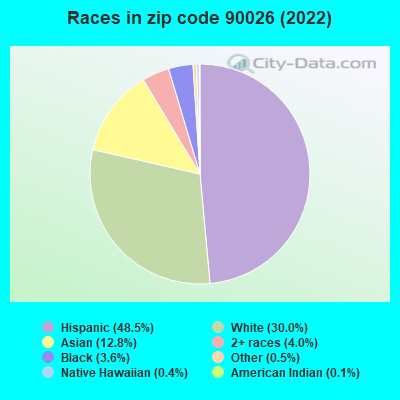
44.1% of residents of 90026 zip code speak English at home.
42.3% of residents speak Spanish at home (55% very well, 16% well, 16% not well, 12% not at all).
3.1% of residents speak other Indo-European language at home (82% very well, 10% well, 6% not well, 3% not at all).
9.9% of residents speak Asian or Pacific Island language at home (56% very well, 26% well, 14% not well, 4% not at all).
0.6% of residents speak other language at home (59% very well, 26% well, 3% not well, 12% not at all).
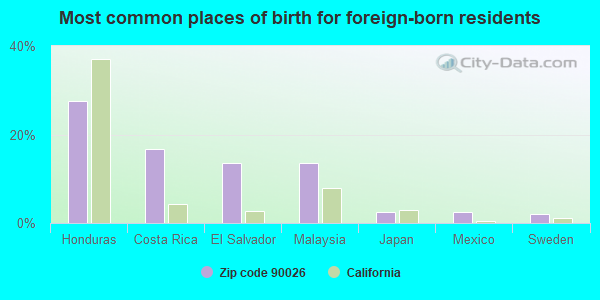
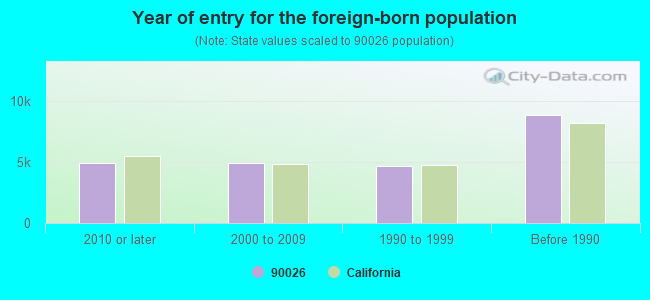
Foreign born population: 22,548 (35.1%) (48.3% of them are naturalized citizens)
Major facilities with environmental interests located in this zip code:
LA USD BELMONT HIGH SCHOOL (1575 W 2ND ST in LOS ANGELES, CA)
STATE MASTER (California - Hazardous Waste Tracking) - HAZARDOU WASTE PROGRAM Small Quantity Generators, between 100 kg and 1000 kg of hazardous waste/month (Resource Conservation and Recovery Act (tracking hazardous waste)) - notification Alternative names: BELMONT SENIOR HIGH
AMIGO TRUCKING (820 N CORONADO TERR in LOS ANGELES, CA)
STATE MASTER (California - Hazardous Waste Tracking) - HAZARDOU WASTE PROGRAM TRANSPORTER (Resource Conservation and Recovery Act (tracking hazardous waste)) Business NAICS classification: SOLID WASTE COLLECTION.; HAZARDOUS WASTE COLLECTION. Organizations: CARLOS A ORELLANA (CONTACT/OPERATOR)
LA USD MICHELTORENA EL (1511 MICHELTORENA ST in LOS ANGELES, CA)
STATE MASTER (California - Hazardous Waste Tracking) - HAZARDOU WASTE PROGRAM Small Quantity Generators, between 100 kg and 1000 kg of hazardous waste/month (Resource Conservation and Recovery Act (tracking hazardous waste)) - notification Alternative names: LAUSD/MICHELTORENA ST EL, MICHELTORENA STREET ELEMENTARY
LA CENTRAL DISTRICT ST MAINT YARD (1274 W 2ND ST in LOS ANGELES, CA)
STATE MASTER (California - Hazardous Waste Tracking) - HAZARDOU WASTE PROGRAM Small Quantity Generators, between 100 kg and 1000 kg of hazardous waste/month (Resource Conservation and Recovery Act (tracking hazardous waste)) - notification Organizations: CITY OF LOS ANGELES (CONTACT/OWNER)
LAUSD ELYSIAN ELEM SCHOOL (1562 BAXTER ST in LOS ANGELES, CA)
STATE MASTER (California - Hazardous Waste Tracking) - HAZARDOU WASTE PROGRAM Small Quantity Generators, between 100 kg and 1000 kg of hazardous waste/month (Resource Conservation and Recovery Act (tracking hazardous waste)) - notification Alternative names: ELYSIAN HEIGHTS ELEMENTARY, LAUSD/ ELYSIAN HIEGHTS ELEM
LOS ANGELES FIRE STATION 20 (2144 SUNSET BLVD in LOS ANGELES, CA)
STATE MASTER (California - Hazardous Waste Tracking) - HAZARDOU WASTE PROGRAM Small Quantity Generators, between 100 kg and 1000 kg of hazardous waste/month (Resource Conservation and Recovery Act (tracking hazardous waste)) - notification Organizations: CITY OF LA (CONTACT/OWNER)
Alternative names: CITY OF LA GENERAL SERVICES, LA FIRE STATION 20
LOS ANGELES USD LOGAN ELEM SCHOOL (1711 W MONTANA ST in LOS ANGELES, CA)
STATE MASTER (California - Hazardous Waste Tracking) - HAZARDOU WASTE PROGRAM Small Quantity Generators, between 100 kg and 1000 kg of hazardous waste/month (Resource Conservation and Recovery Act (tracking hazardous waste)) - notification Organizations: LOS ANGELES UNIFIED SCHOOL DISTRICT (CONTACT/OWNER)
Alternative names: LAUSD/ LOGAN ST ELEM, LOGAN STREET ELEMENTARY
LOS ANGELES USD PLASENCIA ELEM SCHOOL (1321 CORTEZ ST in LOS ANGELES, CA)
STATE MASTER (California - Hazardous Waste Tracking) - HAZARDOU WASTE PROGRAM Small Quantity Generators, between 100 kg and 1000 kg of hazardous waste/month (Resource Conservation and Recovery Act (tracking hazardous waste)) - notification Organizations: LOS ANGELES UNIFIED SCHOOL DISTRICT (CONTACT/OWNER)
Alternative names: LAUSD/ PLASENCIA ELEM, PLASENCIA (BETTY) ELEMENTARY
LOS ANGELES USD ROSEMONT ELEM SCHOOL (421 N ROSEMONT AVE in LOS ANGELES, CA)
STATE MASTER (California - Hazardous Waste Tracking) - HAZARDOU WASTE PROGRAM Small Quantity Generators, between 100 kg and 1000 kg of hazardous waste/month (Resource Conservation and Recovery Act (tracking hazardous waste)) - notification Organizations: LOS ANGELES UNIFIED SCHOOL DISTRICT (CONTACT/OWNER)
Alternative names: LAUSD/ ROSEMONT ELEM SCHOOL, ROSEMONT AVENUE ELEMENTARY
I A CLEANERS (3729 SUNSET BLVD in LOS ANGELES, CA)
STATE MASTER (California - Hazardous Waste Tracking) - HAZARDOU WASTE PROGRAM Small Quantity Generators, between 100 kg and 1000 kg of hazardous waste/month (Resource Conservation and Recovery Act (tracking hazardous waste)) - notification Organizations: KARINE SIMONIAN (CONTACT/OWNER)
Alternative names: I&A CLEANERS
MAYBERRY STREET ELEMENTARY (2414 MAYBERRY ST. in LOS ANGELES, CA)
(National Center for Education Statistics) - STATE ID-6018097 Organizations: LOS ANGELES UNIFIED (SCHOOL DISTRICT)
MCALISTER (HAROLD) HIGH (OPPORTUNITY) (155 N. OCCIDENTAL BLVD. in LOS ANGELES, CA)
(National Center for Education Statistics) - STATE ID-1930619 Organizations: LOS ANGELES UNIFIED (SCHOOL DISTRICT)
NEWMARK (HARRIS) CONTINUATION (135 WITMER ST. in LOS ANGELES, CA)
(National Center for Education Statistics) - STATE ID-1930296 Organizations: LOS ANGELES UNIFIED (SCHOOL DISTRICT)
Housing units lacking complete plumbing facilities: 0.7% Housing units lacking complete kitchen facilities: 1.9%
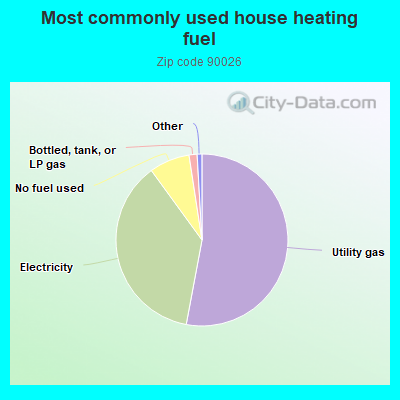
52.9%Utility gas
37.0%Electricity
7.6%No fuel used
1.5%Bottled, tank, or LP gas
Population in 1990: 74,751.
Place of birth for U.S.-born residents:
This state: 27,858
Northeast: 4,004
Midwest: 3,379
South: 3,901
West: 1,554
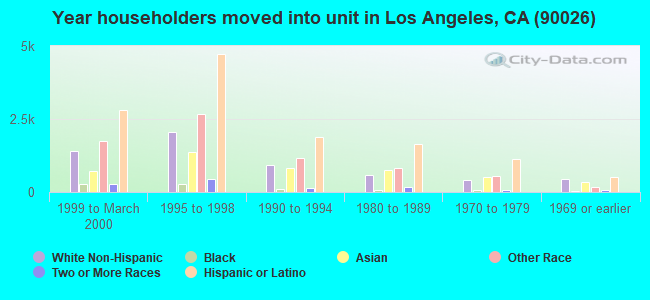
55% of the 90026 zip code residents lived in the same house 5 years ago. Out of people who lived in different houses, 85% lived in this county. Out of people who lived in different counties, 50% lived in California.
88% of the 90026 zip code residents lived in the same house 1 year ago. Out of people who lived in different houses, 65% moved from this county. Out of people who lived in different houses, 9% moved from different county within same state. Out of people who lived in different houses, 20% moved from different state. Out of people who lived in different houses, 4% moved from abroad.
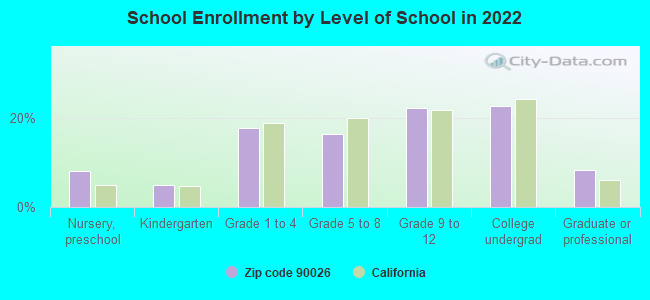
Private vs. public school enrollment:
Students in private schools in grades 1 to 8 (elementary and middle school): 354
Here:
9.4%
California:
10.5%
Students in private schools in grades 9 to 12 (high school): 323
Here:
13.1%
California:
8.5%
Students in private undergraduate colleges: 449
Here:
17.9%
California:
15.9%
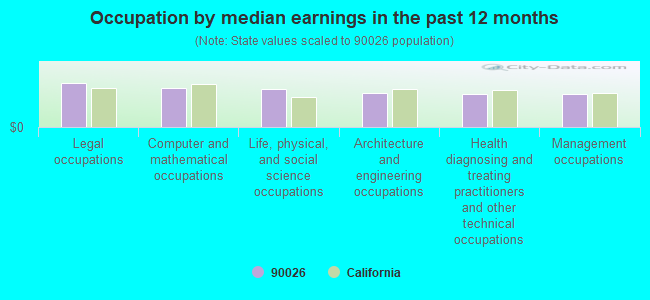
Occupation by median earnings in the past 12 months ($)
103,218Legal occupations
91,531Computer and mathematical occupations
89,598Life, physical, and social science occupations
79,344Architecture and engineering occupations
77,638Health diagnosing and treating practitioners and other technical occupations
77,202Management occupations
Companies with federal contracts located in this zip code:
PELTAR CORP (1282 WEST SECOND STREET in LOS ANGELES, CA; small business) : $120,666 in 6 contractsfrom 2002 to 2003
Contracts for ADP Supplies, ADP Components, ADP Support Equipment by Farm Service Agency, Minerals Management Service, Army Signed by year:2000: $0; 2001: $0; 2002: $49,800; 2003: $70,866; 2004: $0; 2005: $0; 2006: $0.
Biggest contracts:
$49,800 with Farm Service Agency for ADP Supplies. Taking place in MO. Signed on 2002-12-15. Completion date: 2003-01-15.
$31,970 with Minerals Management Service for ADP Components. Taking place in LA. Signed on 2003-09-15. Completion date: 2003-10-15.
$31,970, same as above.Signed on 2003-09-22. Completion date: 2003-09-27.
$6,400 with Army for ADP Support Equipment. Signed on 2003-12-11. Completion date: 2003-12-22.
F & E HEDMAN LOS ANGELES INC (1910 W SUNSET BLVD STE 825 in LOS ANGELES, CA; small business)
$5,595 with Navy for Office Devices and Accessories. Signed on 2005-08-26. Completion date: 2005-09-09.
Top industries in this zip code by the number of employees in 2005:
Health Care and Social Assistance: Specialty (except Psychiatric and Substance Abuse) Hospitals (500-999 employees: 1 establishment, 100-249 employees: 1 establishment)
Other Services (except Public Administration): Religious Organizations (250-499: 1, 50-99: 1, 20-49: 1, 10-19: 2, 5-9: 6, 1-4: 16)
2005 - 2018 National Fire Incident Reporting System (NFIRS) incidents
According to the data from the years 2005 - 2018 the average number of fires per year is 135. The highest number of fire incidents - 212 took place in 2006, and the least - 62 in 2012. The data has a decreasing trend.
When looking into fire subcategories, the most incidents belonged to: Structure Fires (43.8%), and Outside Fires (30.8%).
Fire incident types reported to NFIRS in Zip Code 90026


 Nearest zip codes: 90090, 90057, 90017, 90012, 90071, 90039.


 According to the data from the years 2005 - 2018 the average number of fires per year is 135. The highest number of fire incidents - 212 took place in 2006, and the least - 62 in 2012. The data has a decreasing trend.
 When looking into fire subcategories, the most incidents belonged to: Structure Fires (43.8%), and Outside Fires (30.8%).