Averages for the 2020 tax year for zip code 90017, filed in 2021:
Average Adjusted Gross Income (AGI) in 2020: $65,437 (Individual Income Tax Returns)
Here:
$65,437
State:
$95,910
Salary/wage: $53,363 (reported on 81.0% of returns)
Here:
$53,363
State:
$77,331
(% of AGI for various income ranges: 1303.7% for AGIs below $25k, 4351.1% for AGIs $25k-50k, 8113.5% for AGIs $50k-75k, 11523.3% for AGIs $75k-100k, 22077.0% for AGIs $100k-200k, 94835.8% for AGIs over 200k)
Taxable interest for individuals: $4,938 (reported on 15.3% of returns)
This zip code:
$4,938
California:
$2,294
(% of AGI for various income ranges: 6.6% for AGIs below $25k, 9.0% for AGIs $25k-50k, 28.7% for AGIs $50k-75k, 65.4% for AGIs $75k-100k, 96.4% for AGIs $100k-200k, 5895.8% for AGIs over 200k)
Ordinary dividends: $6,129 (reported on 11.8% of returns)
Here:
$6,129
State:
$10,949
(% of AGI for various income ranges: 5.7% for AGIs below $25k, 14.5% for AGIs $25k-50k, 31.0% for AGIs $50k-75k, 55.8% for AGIs $75k-100k, 113.6% for AGIs $100k-200k, 5438.3% for AGIs over 200k)
Net capital gain/loss in AGI: +$37,589 (reported on 14.0% of returns)
Here:
+$37,589
State:
+$49,306
(% of AGI for various income ranges: 3.0% for AGIs below $25k, 31.1% for AGIs $25k-50k, 65.6% for AGIs $50k-75k, 165.8% for AGIs $75k-100k, 469.3% for AGIs $100k-200k, 45560.0% for AGIs over 200k)
Profit/loss from business: +$12,824 (reported on 25.4% of returns)
Here:
+$12,824
State:
+$15,671
(% of AGI for various income ranges: 348.9% for AGIs below $25k, 207.9% for AGIs $25k-50k, 284.8% for AGIs $50k-75k, 294.6% for AGIs $75k-100k, 757.3% for AGIs $100k-200k, 12531.7% for AGIs over 200k)
Taxable individual retirement arrangement distribution: $24,580 (reported on 1.3% of returns)
90017:
$24,580
California:
$23,505
(% of AGI for various income ranges: 5.7% for AGIs below $25k, 15.4% for AGIs $25k-50k, 42.0% for AGIs $50k-75k, 165.0% for AGIs $100k-200k, 1605.8% for AGIs over 200k)
Self-employed (Keogh) retirement plans: $46,771 (reported on 0.6% of returns)
90017:
$46,771
California:
$30,163
(% of AGI for various income ranges: 51.2% for AGIs $50k-75k, 2361.7% for AGIs over 200k)
Total itemized deductions: $54,603 (reported on 5.7% of returns)
Here:
$54,603
State:
$39,517
(% of AGI for various income ranges: 21.4% for AGIs below $25k, 80.8% for AGIs $25k-50k, 176.0% for AGIs $50k-75k, 295.2% for AGIs $75k-100k, 951.1% for AGIs $100k-200k, 20357.5% for AGIs over 200k)
Charity contributions: $20,522 (reported on 4.3% of returns)
Here:
$20,522
State:
$12,598
(% of AGI for various income ranges: 15.2% for AGIs $25k-50k, 30.1% for AGIs $50k-75k, 69.6% for AGIs $75k-100k, 242.9% for AGIs $100k-200k, 6487.5% for AGIs over 200k)
Taxes paid: $8,392 (reported on 5.7% of returns)
90017:
$8,392
State:
$8,807
(% of AGI for various income ranges: 4.9% for AGIs below $25k, 16.6% for AGIs $25k-50k, 50.9% for AGIs $50k-75k, 94.6% for AGIs $75k-100k, 343.8% for AGIs $100k-200k, 1730.8% for AGIs over 200k)
Earned income credit: $1,863 (reported on 17.6% of returns)
Here:
$1,863
State:
$2,074
(% of AGI for various income ranges: 92.8% for AGIs below $25k, 58.8% for AGIs $25k-50k)
Percentage of individuals using paid preparers for their 2020 taxes: 90.0%
Here:
90%
State:
92%
(% for various income ranges: 86.1% for AGIs below $25k, 91.4% for AGIs $25k-50k, 93.8% for AGIs $50k-75k, 94.4% for AGIs $75k-100k, 94.3% for AGIs $100k-200k, 91.7% for AGIs over 200k)
Averages for the 2012 tax year for zip code 90017, filed in 2013:
Average Adjusted Gross Income (AGI) in 2012: $60,150 (Individual Income Tax Returns)
Here:
$60,150
State:
$72,726
Salary/wage: $40,634 (reported on 84.5% of returns)
Here:
$40,634
State:
$59,079
(% of AGI for various income ranges: 81.0% for AGIs below $25k, 92.0% for AGIs $25k-50k, 92.3% for AGIs $50k-75k, 90.3% for AGIs $75k-100k, 84.0% for AGIs $100k-200k, 24.4% for AGIs over 200k)
Taxable interest for individuals: $4,286 (reported on 15.4% of returns)
This zip code:
$4,286
California:
$2,146
(% of AGI for various income ranges: 0.2% for AGIs below $25k, 0.2% for AGIs $25k-50k, 0.4% for AGIs $50k-75k, 0.3% for AGIs $75k-100k, 1.4% for AGIs $100k-200k, 1.7% for AGIs over 200k)
Ordinary dividends: $12,651 (reported on 7.4% of returns)
Here:
$12,651
State:
$9,308
(% of AGI for various income ranges: 0.2% for AGIs below $25k, 0.3% for AGIs $25k-50k, 0.4% for AGIs $50k-75k, 0.4% for AGIs $75k-100k, 0.9% for AGIs $100k-200k, 2.8% for AGIs over 200k)
Net capital gain/loss in AGI: +$57,880 (reported on 7.2% of returns)
Here:
+$57,880
State:
+$30,460
(% of AGI for various income ranges: 0.1% for AGIs $25k-50k, 0.9% for AGIs $50k-75k, 1.9% for AGIs $100k-200k, 13.8% for AGIs over 200k)
Profit/loss from business: +$11,887 (reported on 22.2% of returns)
Here:
+$11,887
State:
+$17,064
(% of AGI for various income ranges: 16.8% for AGIs below $25k, 3.5% for AGIs $25k-50k, 3.3% for AGIs $50k-75k, 3.2% for AGIs $75k-100k, 3.8% for AGIs $100k-200k, 1.9% for AGIs over 200k)
Taxable individual retirement arrangement distribution: $31,854 (reported on 1.6% of returns)
90017:
$31,854
California:
$19,557
(% of AGI for various income ranges: 0.4% for AGIs below $25k, 1.0% for AGIs $50k-75k, 1.2% for AGIs $100k-200k, 1.2% for AGIs over 200k)
Self-employment retirement plans: $47,140 (reported on 0.6% of returns)
90017:
$47,140
California:
$24,530
Total itemized deductions: $39,389 (16% of AGI, reported on 16.2% of returns)
Here:
$39,389
State:
$34,004
Here:
16.0% of AGI
State:
22.7% of AGI
(% of AGI for various income ranges: 1.8% for AGIs below $25k, 4.9% for AGIs $25k-50k, 8.4% for AGIs $50k-75k, 14.5% for AGIs $75k-100k, 16.0% for AGIs $100k-200k, 12.9% for AGIs over 200k)
Charity contributions: $8,569 (reported on 12.0% of returns)
Here:
$8,569
State:
$4,659
(% of AGI for various income ranges: 0.5% for AGIs $25k-50k, 0.7% for AGIs $50k-75k, 1.5% for AGIs $75k-100k, 1.4% for AGIs $100k-200k, 2.7% for AGIs over 200k)
Taxes paid: $20,829 (reported on 16.1% of returns)
90017:
$20,829
State:
$14,448
(% of AGI for various income ranges: 0.3% for AGIs below $25k, 1.0% for AGIs $25k-50k, 2.5% for AGIs $50k-75k, 5.7% for AGIs $75k-100k, 7.5% for AGIs $100k-200k, 8.1% for AGIs over 200k)
Earned income credit: $2,369 (reported on 25.9% of returns)
Here:
$2,369
State:
$2,286
(% of AGI for various income ranges: 7.1% for AGIs below $25k, 1.2% for AGIs $25k-50k)
Percentage of individuals using paid preparers for their 2012 taxes: 70.9%
Here:
71%
State:
64%
(% for various income ranges: 73.7% for AGIs below $25k, 71.2% for AGIs $25k-50k, 58.2% for AGIs $50k-75k, 56.8% for AGIs $75k-100k, 64.4% for AGIs $100k-200k, 84.6% for AGIs over 200k)
Averages for the 2004 tax year for zip code 90017, filed in 2005:
Average Adjusted Gross Income (AGI) in 2004: $46,972 (Individual Income Tax Returns)
Here:
$46,972
State:
$58,600
Salary/wage: $30,659 (reported on 83.6% of returns)
Here:
$30,659
State:
$49,455
(% of AGI for various income ranges: 89.4% for AGIs $10k-25k, 92.4% for AGIs $25k-50k, 87.9% for AGIs $50k-75k, 82.3% for AGIs $75k-100k, 30.2% for AGIs over 100k)
Taxable interest for individuals: $5,251 (reported on 18.8% of returns)
This zip code:
$5,251
California:
$2,365
(% of AGI for various income ranges: 0.4% for AGIs $10k-25k, 0.8% for AGIs $25k-50k, 0.7% for AGIs $50k-75k, 1.1% for AGIs $75k-100k, 2.8% for AGIs over 100k)
Taxable dividends: $11,964 (reported on 7.3% of returns)
Here:
$11,964
State:
$4,746
(% of AGI for various income ranges: 0.3% for AGIs $10k-25k, 0.6% for AGIs $25k-50k, 1.5% for AGIs $50k-75k, 1.4% for AGIs $75k-100k, 2.4% for AGIs over 100k)
Net capital gain/loss: +$58,286 (reported on 7.5% of returns)
Here:
+$58,286
State:
+$23,418
(% of AGI for various income ranges: -0.1% for AGIs $10k-25k, 0.2% for AGIs $25k-50k, 1.8% for AGIs $50k-75k, 3.2% for AGIs $75k-100k, 14.0% for AGIs over 100k)
Profit/loss from business: +$18,526 (reported on 18.8% of returns)
Here:
+$18,526
State:
+$16,826
(% of AGI for various income ranges: 8.5% for AGIs $10k-25k, 3.9% for AGIs $25k-50k, 3.2% for AGIs $50k-75k, 3.8% for AGIs $75k-100k, 7.0% for AGIs over 100k)
IRA payment deduction: $2,757 (reported on 0.7% of returns)
90017:
$2,757
California:
$3,192
Self-employed pension: $32,761 (reported on 0.9% of returns)
Here:
$32,761
California:
$17,688
Total itemized deductions: $51,588 (21% of AGI, reported on 13.8% of returns)
Here:
$51,588
State:
$28,113
Here:
21.1% of AGI
State:
25.3% of AGI
(% of AGI for various income ranges: 2.7% for AGIs $10k-25k, 8.3% for AGIs $25k-50k, 14.7% for AGIs $50k-75k, 17.3% for AGIs $75k-100k, 18.7% for AGIs over 100k)
Charity contributions deductions: $8,053 (4% of AGI, reported on 10.4% of returns)
Here:
$8,053
State:
$3,923
Here:
3.7% of AGI
State:
3.3% of AGI
(% of AGI for various income ranges: 0.2% for AGIs $10k-25k, 1.0% for AGIs $25k-50k, 1.4% for AGIs $50k-75k, 1.9% for AGIs $75k-100k, 2.3% for AGIs over 100k)
Total tax: $14,030 (reported on 56.4% of returns)
90017:
$14,030
State:
$10,761
(% of AGI for various income ranges: 3.2% for AGIs $10k-25k, 5.9% for AGIs $25k-50k, 11.3% for AGIs $50k-75k, 14.7% for AGIs $75k-100k, 22.1% for AGIs over 100k)
Earned income credit: $2,019 (reported on 35.5% of returns)
Here:
$2,019
State:
$1,763
Percentage of individuals using paid preparers for their 2004 taxes: 78.4%
Here:
78%
State:
66%
(% for various income ranges: 75.3% for AGIs below $10k, 82.7% for AGIs $10k-25k, 73.0% for AGIs $25k-50k, 69.0% for AGIs $50k-75k, 77.8% for AGIs $75k-100k, 85.4% for AGIs over 100k)
Likely homosexual households (counted as self-reported same-sex unmarried-partner households)
Lesbian couples: 0.0% of all households
Gay men: 0.4% of all households
Household received Food Stamps/SNAP in the past 12 months: 3,581 Household did not receive Food Stamps/SNAP in the past 12 months: 10,609
Women who had a birth in the past 12 months: 387 (127 now married, 263 unmarried) Women who did not have a birth in the past 12 months: 7,882 (2,168 now married, 5,753 unmarried)
Housing units in zip code 90017 with a mortgage: 516 Median monthly owner costs for units with a mortgage: $3,713 Median monthly owner costs for units without a mortgage: $1,556
Residents with income below the poverty level in 2022:
This zip code:
36.0%
Whole state:
12.2%
Residents with income below 50% of the poverty level in 2022:
This zip code:
17.0%
Whole state:
6.2%
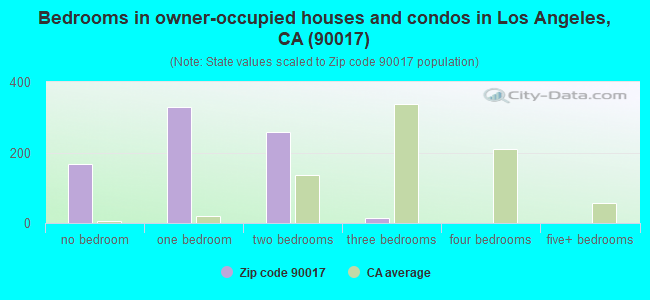
Median number of rooms in houses and condos:
Here:
2.7
State:
6.0
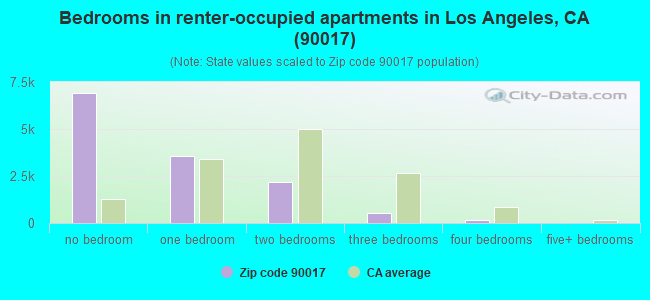
Median number of rooms in apartments:
Here:
1.7
State:
3.9
Notable locations in this zip code not listed on our city pages
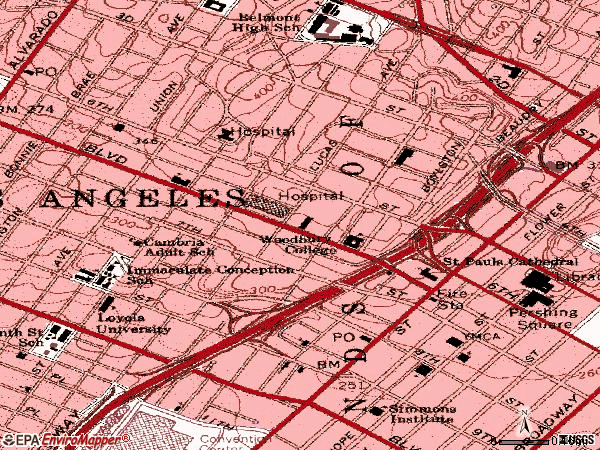
Notable locations in zip code 90017: Los Angeles Public Library (A), California Club (B), Mary Andrews Clark Memorial Home (C), Halliburton Building (D). Display/hide their locations on the map
Churches in zip code 90017 include: Church of the Open Door (A), Saint Pauls Cathedral (B), First Covenant Church (C), Immaculate Conception Parish Center (D), The Assembly of Peace Church (E), Third Church of Christ Scientist (F). Display/hide their locations on the map
1,778 married couples with children.
3,135 single-parent households (1,360 men, 1,775 women).
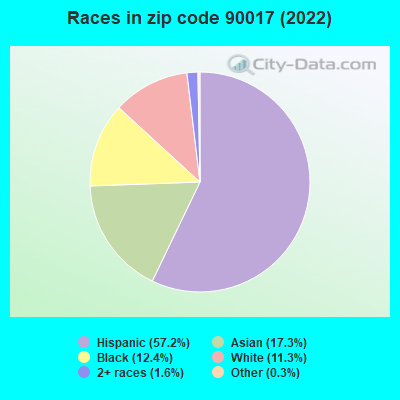
31.8% of residents of 90017 zip code speak English at home.
50.5% of residents speak Spanish at home (48% very well, 16% well, 19% not well, 18% not at all).
1.7% of residents speak other Indo-European language at home (97% very well, 3% well).
14.1% of residents speak Asian or Pacific Island language at home (48% very well, 24% well, 21% not well, 8% not at all).
1.7% of residents speak other language at home (63% very well, 9% well, 21% not well, 7% not at all).
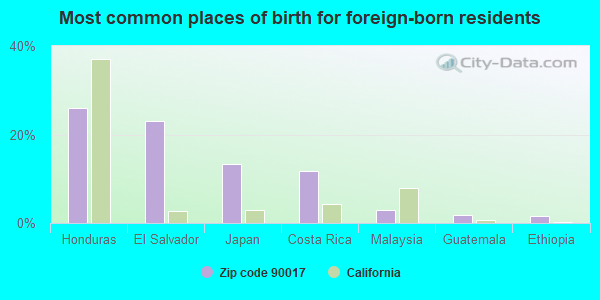
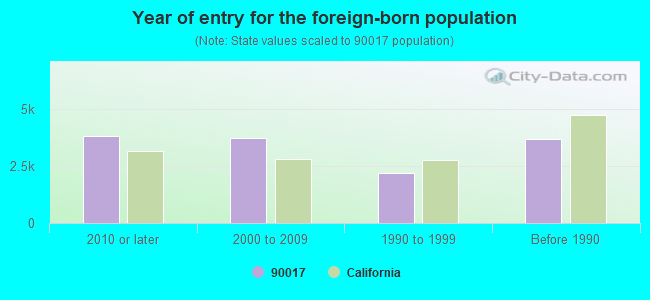
Foreign born population: 12,741 (44.7%) (33.0% of them are naturalized citizens)
Major facilities with environmental interests located in this zip code:
CENTRAL L A MIDDLE SCHOOL NO 1 (650 S UNION AVE in LOS ANGELES, CA)
STATE MASTER (California - Hazardous Waste Tracking) - HAZARDOU WASTE PROGRAM Large Quantity Generators, more that 1000 kg of hazardous waste/month (Resource Conservation and Recovery Act (tracking hazardous waste)) - notification Organizations: LAUSD (CONTACT/OPERATOR)
CENTRAL PLANTS INCORPORATED (715 WEST 3RD STREET in LOS ANGELES, CA)
AIR MAJOR (AIRS/AFS) STATE MASTER (California - Hazardous Waste Tracking) - HAZARDOU WASTE PROGRAM CRITERIA AND HAZARDOUS AIR POLLUTANT INVENTORY (Inventory of air pollution sources) HAZARDOUS WASTE BIENNIAL REPORTER (Resource Conservation and Recovery Act (tracking hazardous waste)) Small Quantity Generators, between 100 kg and 1000 kg of hazardous waste/month (Resource Conservation and Recovery Act (tracking hazardous waste)) Business SIC classification: STEAM AND AIR-CONDITIONING SUPPLY Alternative names: CENTRAL PLANTS INC / BUNKER HILL, FIVEPLANTS ASSN BUNKER HILL CTL PLT, SEMPRA ENERGY, CENTRAL PLANTS
ESPERANZA E S (680 LITTLE ST in LOS ANGELES, CA)
STATE MASTER (California - Hazardous Waste Tracking) - HAZARDOU WASTE PROGRAM Large Quantity Generators, more that 1000 kg of hazardous waste/month (Resource Conservation and Recovery Act (tracking hazardous waste)) - notification Organizations: L A UNIFIED SCHOOL DISTRICT (CONTACT/OWNER)
Alternative names: ESPERANZA ELEMENTARY
CENTRAL L A AREA NEW H S NO 10 (322 S LUCAS AVE in LOS ANGELES, CA)
STATE MASTER (California - Hazardous Waste Tracking) - HAZARDOU WASTE PROGRAM Large Quantity Generators, more that 1000 kg of hazardous waste/month (Resource Conservation and Recovery Act (tracking hazardous waste)) - notification Organizations: L A UNIFIED SCHOOL DISTRICT (CONTACT/OWNER)
EQUILON ENTERPRISES (1551 W 7TH in LOS ANGELES, CA) . Federal Facility
STATE MASTER (California - Hazardous Waste Tracking) - HAZARDOU WASTE PROGRAM HAZARDOUS WASTE BIENNIAL REPORTER (Resource Conservation and Recovery Act (tracking hazardous waste)) Small Quantity Generators, between 100 kg and 1000 kg of hazardous waste/month (Resource Conservation and Recovery Act (tracking hazardous waste)) - notification Organizations: EQUILON ENTERPRISES, LLC (CONTACT/OWNER)
Alternative names: SHELL OIL CO
GRATTS (EVELYN THURMAN) ELEM (309 LUCAS AVE. in LOS ANGELES, CA)
(National Center for Education Statistics) - STATE ID-6113419 Organizations: LOS ANGELES UNIFIED (SCHOOL DISTRICT)
CHARNOCK BASIN (SHELL OIL) (3801 SEPULVEDA BLVD. in LOS ANGELES, CA)
(Integrated Compliance Information System) - ICIS-09-2004-0412, FORMAL ENFORCEMENT ACTION, ENFORCEMENT/COMPLIANCE ACTIVITY Business SIC classification: GASOLINE SERVICE STATIONS
GRATTS NEW P C (474 S HARTFORD AVE in LOS ANGELES, CA)
Large Quantity Generators, more that 1000 kg of hazardous waste/month (Resource Conservation and Recovery Act (tracking hazardous waste)) Organizations: LA USD (CONTACT/OWNER)
MARTIN BUILDING COMPANY (816 S. GRAND AVENUE in LOS ANGELES, CA)
Large Quantity Generators, more that 1000 kg of hazardous waste/month (Resource Conservation and Recovery Act (tracking hazardous waste)) Organizations: 816 GRAND PROPERTIES, LLC. (CONTACT/OWNER)
ADAMS PLAZA (1545 WILSHIRE BLVD in LOS ANGELES, CA)
National Pollutant Discharge Elimination System NON-MAJOR (Tracking pollutant discharge elimination systems) - permit Business SIC classification: OPERATORS OF NONRESIDENTIAL BUILDINGS
HOLIDAY INNS (750 GARLAND AVE in LOS ANGELES, CA)
National Pollutant Discharge Elimination System NON-MAJOR (Tracking pollutant discharge elimination systems) - permit Business SIC classification: HOTELS AND MOTELS Organizations: HOLIDAY INNS, INC (CONTACT/OWNER)
HOME DEPOT USA INC HD 1048 (1675 WILSHIRE BLVD in LOS ANGELES, CA)
Small Quantity Generators, between 100 kg and 1000 kg of hazardous waste/month (Resource Conservation and Recovery Act (tracking hazardous waste))
KATHRYN POST INCORPORATED (1840 NORTH BEVERLY GLEN BOULEVARD in LOS ANGELES, CA)
Small Quantity Generators, between 100 kg and 1000 kg of hazardous waste/month (Resource Conservation and Recovery Act (tracking hazardous waste)) - notification
Housing units lacking complete plumbing facilities: 2.7% Housing units lacking complete kitchen facilities: 4.8%
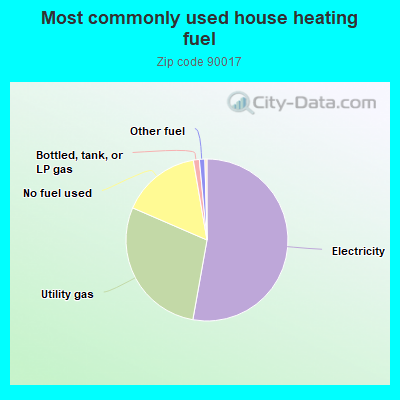
52.8%Electricity
28.7%Utility gas
15.8%No fuel used
1.2%Bottled, tank, or LP gas
1.1%Other fuel
Population in 1990: 21,790.
Place of birth for U.S.-born residents:
This state: 11,311
Northeast: 739
Midwest: 1,176
South: 1,603
West: 447
46% of the 90017 zip code residents lived in the same house 5 years ago. Out of people who lived in different houses, 92% lived in this county. Out of people who lived in different counties, 50% lived in California.
80% of the 90017 zip code residents lived in the same house 1 year ago. Out of people who lived in different houses, 63% moved from this county. Out of people who lived in different houses, 13% moved from different county within same state. Out of people who lived in different houses, 15% moved from different state. Out of people who lived in different houses, 6% moved from abroad.
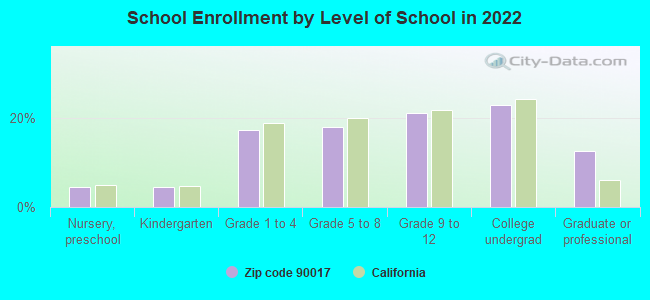
Private vs. public school enrollment:
Students in private schools in grades 1 to 8 (elementary and middle school): 65
Here:
3.0%
California:
10.5%
Students in private schools in grades 9 to 12 (high school): 37
Here:
2.8%
California:
8.5%
Students in private undergraduate colleges: 357
Here:
24.5%
California:
15.9%
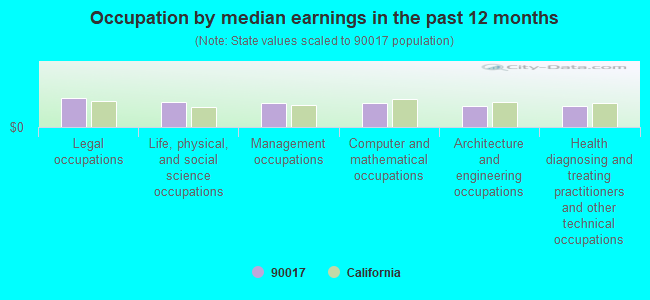
Occupation by median earnings in the past 12 months ($)
108,098Legal occupations
92,785Life, physical, and social science occupations
89,023Management occupations
88,140Computer and mathematical occupations
78,846Architecture and engineering occupations
77,266Health diagnosing and treating practitioners and other technical occupations
Companies with federal contracts located in this zip code:
DAMES & MOORE (911 WILSHIRE BLVD in LOS ANGELES, CA) : $27,614,471 in 201 contractsfrom 1999 to 2005
Contracts for Maintenance, Repair or Alteration of Real Property -- Unimproved Real Property (Land), Hazardous Substance Analysis, Other Architect and Engineering Services, Maintenance, Repair or Alteration of Real Property -- Other Non-Building Facilities, and moreby Air Force, Army, U.S. Army Corps of Engineers - civil program financing only, National Oceanic and Atmospheric Administration/Under Secretary for Oceans and Atmosphere, and others Signed by year:2000: $12,196,079; 2001: $10,768,772; 2002: $3,751,353; 2003: $151,858; 2004: $23,273; 2005: -$1,741; 2006: $0.
Biggest contracts:
$2,647,147 with Air Force for Maintenance, Repair or Alteration of Real Property -- Unimproved Real Property (Land). Taking place in MO. Signed on 2001-08-01. Completion date: 2002-06-30.
$2,590,800, same as above.Signed on 2002-03-19. Completion date: 2002-06-30.
$1,546,003 with Army for Hazardous Substance Analysis. Taking place in NV. Signed on 2001-07-31. Completion date: 2002-04-30.
$1,446,477 with Army for Other Architect and Engineering Services. Taking place in NV. Signed on 2000-09-30. Completion date: 2001-06-29.
QUADRANT MANAGEMENT SERVICES, (700 S FLOWER ST STE 1100 in LOS ANGELES, CA; small business) : $89,256 in 3 contractsfrom 2005 to 2006
$60,604 with Air Force for Educational Services. Taking place in SC. Signed on 2005-10-01. Completion date: 2006-09-30.
$25,452 with Air Force for Other Administrative Support Services. Taking place in SC. Signed on 2005-10-01. Completion date: 2006-09-30.
$3,200 with Air Force for Educational Services. Taking place in SC. Signed on 2006-05-26. Completion date: 2006-09-30.
WILLIAM F WHITE INTERNATIONAL (1201 WEST 5TH STREET - S in LOS ANGELES, CA; small business)
$34,824 with Navy for Fiber Optic Cables. Signed on 2002-12-18. Completion date: 2003-03-28.
Top industries in this zip code by the number of employees in 2005:
2005 - 2018 National Fire Incident Reporting System (NFIRS) incidents
According to the data from the years 2005 - 2018 the average number of fires per year is 50. The highest number of reported fires - 86 took place in 2006, and the least - 26 in 2012. The data has a decreasing trend.
When looking into fire subcategories, the most incidents belonged to: Structure Fires (59.0%), and Outside Fires (25.1%).
Fire incident types reported to NFIRS in Zip Code 90017
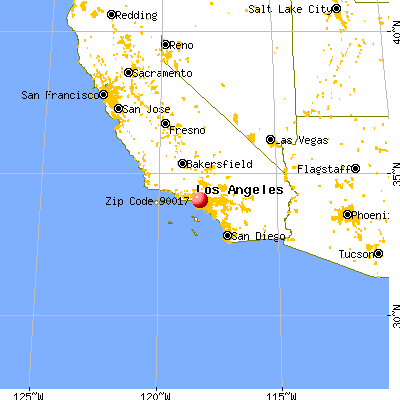


 Nearest zip codes: 90071, 90015, 90079, 90057, 90014, 90013.
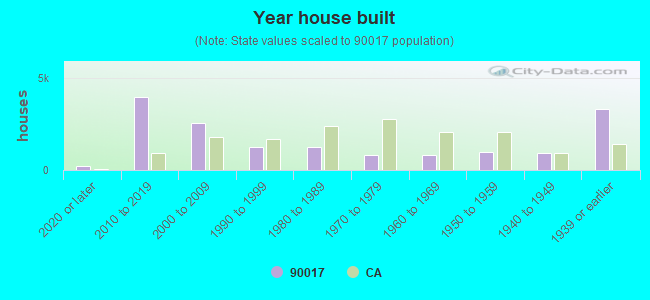


 According to the data from the years 2005 - 2018 the average number of fires per year is 50. The highest number of reported fires - 86 took place in 2006, and the least - 26 in 2012. The data has a decreasing trend.
 When looking into fire subcategories, the most incidents belonged to: Structure Fires (59.0%), and Outside Fires (25.1%).