Estimated zip code population in 2022: 14,465 Zip code population in 2010: 11,772 Zip code population in 2000: 9,727
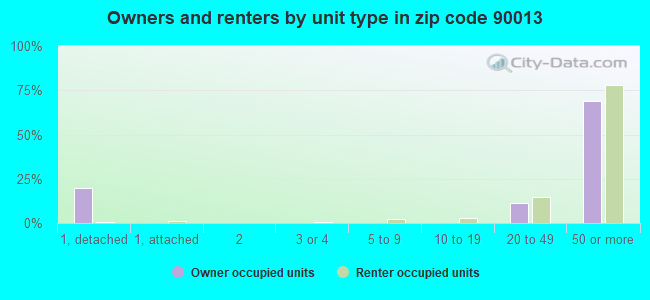
Houses and condos: 9,722 Renter-occupied apartments: 7,248
% of renters here:
92%
State:
44%
March 2022 cost of living index in zip code 90013: 170.8 (very high, U.S. average is 100)
Land area: 0.7 sq. mi. Water area: 0.0 sq. mi.
Population density: 21,560 people per square mile
(very high).
OSM Map
General Map
Google Map
MSN Map
OSM Map
General Map
Google Map
MSN Map
OSM Map
General Map
Google Map
MSN Map
OSM Map
General Map
Google Map
MSN Map
Please wait while loading the map...
Real estate property taxes paid for housing units in 2022:
This zip code:
0.6% ($4,744)
California:
0.7% ($4,831)
Median real estate property taxes paid for housing units with mortgages in 2022: $4,665 (0.6%) Median real estate property taxes paid for housing units with no mortgage in 2022: $5,462 (0.5%)
Averages for the 2020 tax year for zip code 90013, filed in 2021:
Average Adjusted Gross Income (AGI) in 2020: $81,662 (Individual Income Tax Returns)
Here:
$81,662
State:
$95,910
Salary/wage: $73,904 (reported on 79.2% of returns)
Here:
$73,904
State:
$77,331
(% of AGI for various income ranges: 966.1% for AGIs below $25k, 4159.1% for AGIs $25k-50k, 8062.9% for AGIs $50k-75k, 11993.3% for AGIs $75k-100k, 21092.5% for AGIs $100k-200k, 104480.0% for AGIs over 200k)
Taxable interest for individuals: $1,704 (reported on 25.0% of returns)
This zip code:
$1,704
California:
$2,294
(% of AGI for various income ranges: 12.2% for AGIs below $25k, 22.4% for AGIs $25k-50k, 24.8% for AGIs $50k-75k, 24.7% for AGIs $75k-100k, 81.7% for AGIs $100k-200k, 1500.0% for AGIs over 200k)
Ordinary dividends: $2,598 (reported on 19.8% of returns)
Here:
$2,598
State:
$10,949
(% of AGI for various income ranges: 21.4% for AGIs below $25k, 19.6% for AGIs $25k-50k, 66.9% for AGIs $50k-75k, 37.7% for AGIs $75k-100k, 110.2% for AGIs $100k-200k, 1518.9% for AGIs over 200k)
Net capital gain/loss in AGI: +$21,683 (reported on 21.0% of returns)
Here:
+$21,683
State:
+$49,306
(% of AGI for various income ranges: 19.0% for AGIs below $25k, 93.0% for AGIs $25k-50k, 56.7% for AGIs $50k-75k, 185.3% for AGIs $75k-100k, 476.0% for AGIs $100k-200k, 21895.6% for AGIs over 200k)
Profit/loss from business: +$10,493 (reported on 25.8% of returns)
Here:
+$10,493
State:
+$15,671
(% of AGI for various income ranges: 178.6% for AGIs below $25k, 364.3% for AGIs $25k-50k, 415.5% for AGIs $50k-75k, 481.7% for AGIs $75k-100k, 700.0% for AGIs $100k-200k, 3272.2% for AGIs over 200k)
Taxable individual retirement arrangement distribution: $11,417 (reported on 2.3% of returns)
90013:
$11,417
California:
$23,505
(% of AGI for various income ranges: 8.1% for AGIs below $25k, 31.3% for AGIs $25k-50k, 94.0% for AGIs $50k-75k, 90.2% for AGIs $100k-200k, 262.2% for AGIs over 200k)
Self-employed (Keogh) retirement plans: $41,733 (reported on 0.6% of returns)
90013:
$41,733
California:
$30,163
(% of AGI for various income ranges: 1391.1% for AGIs over 200k)
Total itemized deductions: $29,404 (reported on 10.2% of returns)
Here:
$29,404
State:
$39,517
(% of AGI for various income ranges: 32.9% for AGIs below $25k, 119.4% for AGIs $25k-50k, 329.0% for AGIs $50k-75k, 413.7% for AGIs $75k-100k, 1055.6% for AGIs $100k-200k, 7447.8% for AGIs over 200k)
Charity contributions: $6,602 (reported on 7.7% of returns)
Here:
$6,602
State:
$12,598
(% of AGI for various income ranges: 26.1% for AGIs $25k-50k, 40.5% for AGIs $50k-75k, 44.0% for AGIs $75k-100k, 137.3% for AGIs $100k-200k, 1672.2% for AGIs over 200k)
Taxes paid: $8,921 (reported on 10.2% of returns)
90013:
$8,921
State:
$8,807
(% of AGI for various income ranges: 8.5% for AGIs below $25k, 29.1% for AGIs $25k-50k, 83.3% for AGIs $50k-75k, 151.3% for AGIs $75k-100k, 420.0% for AGIs $100k-200k, 1791.1% for AGIs over 200k)
Earned income credit: $916 (reported on 14.4% of returns)
Here:
$916
State:
$2,074
(% of AGI for various income ranges: 47.3% for AGIs below $25k, 18.5% for AGIs $25k-50k)
Percentage of individuals using paid preparers for their 2020 taxes: 92.7%
Here:
93%
State:
92%
(% for various income ranges: 89.6% for AGIs below $25k, 92.5% for AGIs $25k-50k, 95.2% for AGIs $50k-75k, 95.7% for AGIs $75k-100k, 95.2% for AGIs $100k-200k, 94.4% for AGIs over 200k)
Averages for the 2012 tax year for zip code 90013, filed in 2013:
Average Adjusted Gross Income (AGI) in 2012: $57,099 (Individual Income Tax Returns)
Here:
$57,099
State:
$72,726
Salary/wage: $55,144 (reported on 85.1% of returns)
Here:
$55,144
State:
$59,079
(% of AGI for various income ranges: 78.1% for AGIs below $25k, 86.6% for AGIs $25k-50k, 90.5% for AGIs $50k-75k, 90.1% for AGIs $75k-100k, 88.1% for AGIs $100k-200k, 63.0% for AGIs over 200k)
Taxable interest for individuals: $667 (reported on 26.7% of returns)
This zip code:
$667
California:
$2,146
(% of AGI for various income ranges: 0.5% for AGIs below $25k, 0.2% for AGIs $25k-50k, 0.1% for AGIs $50k-75k, 0.1% for AGIs $75k-100k, 0.5% for AGIs $100k-200k, 0.2% for AGIs over 200k)
Ordinary dividends: $2,240 (reported on 15.3% of returns)
Here:
$2,240
State:
$9,308
(% of AGI for various income ranges: 1.3% for AGIs below $25k, 0.5% for AGIs $25k-50k, 0.6% for AGIs $50k-75k, 0.6% for AGIs $75k-100k, 0.6% for AGIs $100k-200k, 0.4% for AGIs over 200k)
Net capital gain/loss in AGI: +$10,015 (reported on 13.1% of returns)
Here:
+$10,015
State:
+$30,460
(% of AGI for various income ranges: 0.3% for AGIs below $25k, 0.1% for AGIs $50k-75k, 0.4% for AGIs $75k-100k, 1.2% for AGIs $100k-200k, 8.6% for AGIs over 200k)
Profit/loss from business: +$10,825 (reported on 25.2% of returns)
Here:
+$10,825
State:
+$17,064
(% of AGI for various income ranges: 13.8% for AGIs below $25k, 6.7% for AGIs $25k-50k, 3.6% for AGIs $50k-75k, 4.4% for AGIs $75k-100k, 3.3% for AGIs $100k-200k, 3.1% for AGIs over 200k)
Taxable individual retirement arrangement distribution: $10,667 (reported on 2.2% of returns)
90013:
$10,667
California:
$19,557
(% of AGI for various income ranges: 1.8% for AGIs below $25k, 0.5% for AGIs $50k-75k, 0.7% for AGIs $100k-200k)
Self-employment retirement plans: $16,967 (reported on 0.7% of returns)
90013:
$16,967
California:
$24,530
Total itemized deductions: $25,252 (22% of AGI, reported on 32.7% of returns)
Here:
$25,252
State:
$34,004
Here:
21.8% of AGI
State:
22.7% of AGI
(% of AGI for various income ranges: 7.1% for AGIs below $25k, 9.9% for AGIs $25k-50k, 10.6% for AGIs $50k-75k, 16.4% for AGIs $75k-100k, 17.3% for AGIs $100k-200k, 17.9% for AGIs over 200k)
Charity contributions: $2,208 (reported on 23.5% of returns)
Here:
$2,208
State:
$4,659
(% of AGI for various income ranges: 0.4% for AGIs below $25k, 0.6% for AGIs $25k-50k, 0.9% for AGIs $50k-75k, 1.0% for AGIs $75k-100k, 1.1% for AGIs $100k-200k, 1.0% for AGIs over 200k)
Taxes paid: $10,967 (reported on 32.7% of returns)
90013:
$10,967
State:
$14,448
(% of AGI for various income ranges: 1.2% for AGIs below $25k, 2.3% for AGIs $25k-50k, 3.3% for AGIs $50k-75k, 7.5% for AGIs $75k-100k, 8.5% for AGIs $100k-200k, 9.2% for AGIs over 200k)
Earned income credit: $1,134 (reported on 18.1% of returns)
Here:
$1,134
State:
$2,286
(% of AGI for various income ranges: 3.6% for AGIs below $25k, 0.4% for AGIs $25k-50k)
Percentage of individuals using paid preparers for their 2012 taxes: 54.5%
Here:
54%
State:
64%
(% for various income ranges: 52.7% for AGIs below $25k, 53.2% for AGIs $25k-50k, 50.0% for AGIs $50k-75k, 56.8% for AGIs $75k-100k, 60.9% for AGIs $100k-200k, 73.3% for AGIs over 200k)
Averages for the 2004 tax year for zip code 90013, filed in 2005:
Average Adjusted Gross Income (AGI) in 2004: $50,005 (Individual Income Tax Returns)
Here:
$50,005
State:
$58,600
Salary/wage: $28,163 (reported on 82.1% of returns)
Here:
$28,163
State:
$49,455
(% of AGI for various income ranges: 113.8% for AGIs below $10k, 85.6% for AGIs $10k-25k, 89.7% for AGIs $25k-50k, 88.0% for AGIs $50k-75k, 83.3% for AGIs $75k-100k, 17.2% for AGIs over 100k)
Taxable interest for individuals: $2,097 (reported on 23.4% of returns)
This zip code:
$2,097
California:
$2,365
(% of AGI for various income ranges: 1.5% for AGIs below $10k, 1.1% for AGIs $10k-25k, 1.0% for AGIs $25k-50k, 0.4% for AGIs $50k-75k, 0.8% for AGIs $75k-100k, 1.0% for AGIs over 100k)
Taxable dividends: $1,762 (reported on 10.6% of returns)
Here:
$1,762
State:
$4,746
(% of AGI for various income ranges: 2.3% for AGIs below $10k, 0.6% for AGIs $10k-25k, 0.3% for AGIs $25k-50k, 0.2% for AGIs $50k-75k, 0.1% for AGIs $75k-100k, 0.3% for AGIs over 100k)
Net capital gain/loss: +$9,097 (reported on 11.9% of returns)
Here:
+$9,097
State:
+$23,418
(% of AGI for various income ranges: -1.7% for AGIs below $10k, -0.1% for AGIs $10k-25k, 0.9% for AGIs $25k-50k, -0.3% for AGIs $50k-75k, -0.2% for AGIs $75k-100k, 3.6% for AGIs over 100k)
Profit/loss from business: +$7,382 (reported on 18.9% of returns)
Here:
+$7,382
State:
+$16,826
(% of AGI for various income ranges: 10.3% for AGIs below $10k, 9.1% for AGIs $10k-25k, 5.2% for AGIs $25k-50k, 3.6% for AGIs $50k-75k, 1.0% for AGIs over 100k)
IRA payment deduction: $3,122 (reported on 2.2% of returns)
90013:
$3,122
California:
$3,192
Self-employed pension: $18,314 (reported on 1.8% of returns)
Here:
$18,314
California:
$17,688
Total itemized deductions: $21,844 (13% of AGI, reported on 22.0% of returns)
Here:
$21,844
State:
$28,113
Here:
13.3% of AGI
State:
25.3% of AGI
(% of AGI for various income ranges: 7.4% for AGIs below $10k, 3.6% for AGIs $10k-25k, 13.9% for AGIs $25k-50k, 11.6% for AGIs $50k-75k, 14.4% for AGIs $75k-100k, 8.9% for AGIs over 100k)
Charity contributions deductions: $3,458 (2% of AGI, reported on 18.0% of returns)
Here:
$3,458
State:
$3,923
Here:
1.9% of AGI
State:
3.3% of AGI
(% of AGI for various income ranges: 0.4% for AGIs $10k-25k, 2.6% for AGIs $25k-50k, 2.1% for AGIs $50k-75k, 1.1% for AGIs $75k-100k, 1.0% for AGIs over 100k)
Total tax: $15,098 (reported on 66.7% of returns)
90013:
$15,098
State:
$10,761
(% of AGI for various income ranges: 3.8% for AGIs below $10k, 5.5% for AGIs $10k-25k, 8.9% for AGIs $25k-50k, 13.6% for AGIs $50k-75k, 14.6% for AGIs $75k-100k, 27.4% for AGIs over 100k)
Earned income credit: $962 (reported on 30.1% of returns)
Here:
$962
State:
$1,763
Percentage of individuals using paid preparers for their 2004 taxes: 61.2%
Here:
61%
State:
66%
(% for various income ranges: 55.0% for AGIs below $10k, 63.5% for AGIs $10k-25k, 52.8% for AGIs $25k-50k, 63.7% for AGIs $50k-75k, 70.8% for AGIs $75k-100k, 94.9% for AGIs over 100k)
Likely homosexual households (counted as self-reported same-sex unmarried-partner households)
Lesbian couples: 0.0% of all households
Gay men: 1.6% of all households
Household received Food Stamps/SNAP in the past 12 months: 2,778 Household did not receive Food Stamps/SNAP in the past 12 months: 5,516
Women who had a birth in the past 12 months: 100 (10 now married, 91 unmarried) Women who did not have a birth in the past 12 months: 3,319 (608 now married, 2,740 unmarried)
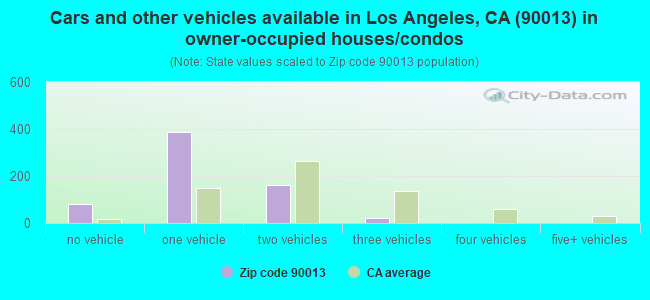
Housing units in zip code 90013 with a mortgage: 511 (16 second mortgage, 16 both second mortgage and home equity loan) Median monthly owner costs for units with a mortgage: $2,793 Median monthly owner costs for units without a mortgage: $1,163
Residents with income below the poverty level in 2022:
This zip code:
46.4%
Whole state:
12.2%
Residents with income below 50% of the poverty level in 2022:
This zip code:
18.6%
Whole state:
6.2%
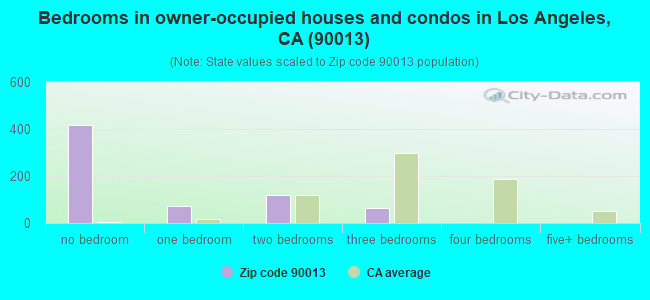
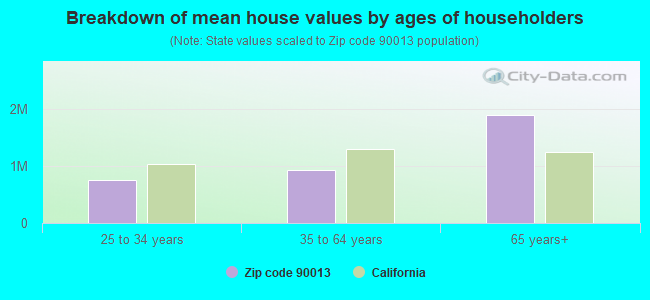
Median number of rooms in houses and condos:
Here:
1.6
State:
6.0
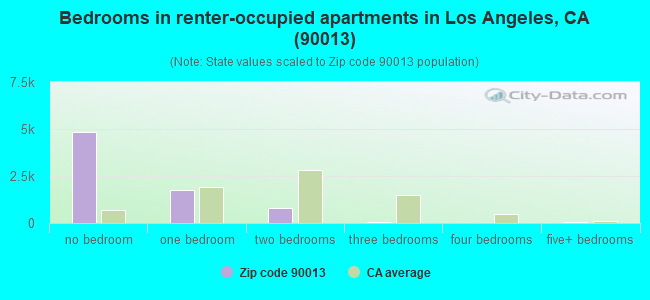
Median number of rooms in apartments:
Here:
1.4
State:
3.9
Notable locations in this zip code not listed on our city pages
Notable locations in zip code 90013: Los Angeles Center Studios (A), Joel Bloom Square (B), Grand Central Market (C), Santa Fe Building (D), International Jewelry Center (E), Hibernian Building (F), Fire Station Number 28 (G), Bradbury Building (H), Little Tokyo Branch Los Angeles Public Library (I), Central Community Police Station (J), Continental Building (K), Japanese American Cultural And Community Center (L), Ronald Reagan Building (M). Display/hide their locations on the map
In group quarters: 4,392 (-1 institutionalized population)
Size of family households: 797 2-persons, 121 3-persons, 21 4-persons, 54 6-persons
Size of nonfamily households: 6,150 1-person, 876 2-persons, 57 3-persons
146 married couples with children.
149 single-parent households (117 men, 32 women).
69.8% of residents of 90013 zip code speak English at home.
13.4% of residents speak Spanish at home (73% very well, 13% well, 7% not well, 6% not at all).
4.9% of residents speak other Indo-European language at home (79% very well, 21% well).
10.3% of residents speak Asian or Pacific Island language at home (33% very well, 28% well, 31% not well, 8% not at all).
1.0% of residents speak other language at home (83% very well, 17% well).
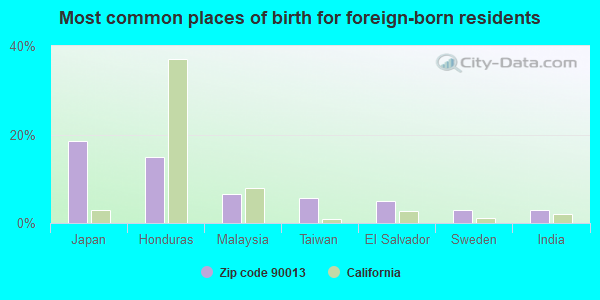
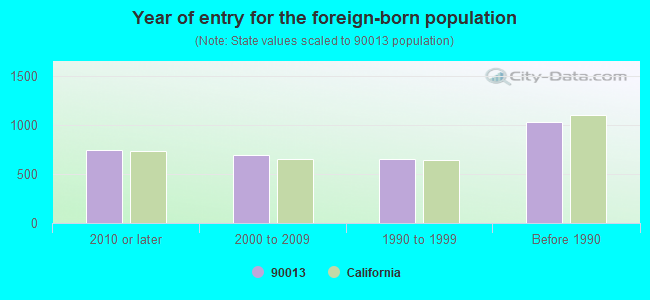
Foreign born population: 2,982 (20.6%) (50.6% of them are naturalized citizens)
Major facilities with environmental interests located in this zip code:
ENTERPRISE SALES CO (901 E 3RD ST in LOS ANGELES, CA)
SUPERFUND (Superfund database) (Integrated Compliance Information System) - ICIS-09-2003-0115, FORMAL ENFORCEMENT ACTION COMPLIANCE ACTIVITY (Tracking inspections of insecticide, fungicide, and rodenticide, and toxic substances) CRITERIA AND HAZARDOUS AIR POLLUTANT INVENTORY (Inventory of air pollution sources) Business SIC classification: CHEMICALS AND CHEMICAL PREPARATIONS
HERRERAS JEWELRY (220 W 5TH 713 in LOS ANGELES, CA)
STATE MASTER (California - Hazardous Waste Tracking) - HAZARDOU WASTE PROGRAM Small Quantity Generators, between 100 kg and 1000 kg of hazardous waste/month (Resource Conservation and Recovery Act (tracking hazardous waste)) - notification Organizations: URIEL HERRERA (CONTACT/OWNER)
MARVEL JEWELRY (550 S HILL ST 940 in LOS ANGELES, CA)
STATE MASTER (California - Hazardous Waste Tracking) - HAZARDOU WASTE PROGRAM Small Quantity Generators, between 100 kg and 1000 kg of hazardous waste/month (Resource Conservation and Recovery Act (tracking hazardous waste)) - notification Business NAICS classification: JEWELRY (EXCEPT COSTUME) MANUFACTURING. Organizations: HARRY VERTANIAN (CONTACT/OWNER)
LINCOLN HOTEL SRO LIMITED PARTNERSHIP (549 CERES AVE in LOS ANGELES, CA)
STATE MASTER (California - Hazardous Waste Tracking) - HAZARDOU WASTE PROGRAM Small Quantity Generators, between 100 kg and 1000 kg of hazardous waste/month (Resource Conservation and Recovery Act (tracking hazardous waste)) - notification Organizations: SKID ROW HOUSING TRUST (CONTACT/OWNER)
METRO RAIL CONSTRUCTION PROJ (425 MAIN ST in LOS ANGELES, CA)
(Resource Conservation and Recovery Act (tracking hazardous waste)) Small Quantity Generators, between 100 kg and 1000 kg of hazardous waste/month (Resource Conservation and Recovery Act (tracking hazardous waste)) Organizations: SO CALIF RTD (CONTACT/OWNER)
, SOUTHERN CALIF RAPID TRANSIT DISTRICT (CONTACT/OWNER)
Alternative names: SOUTHERN CALIF RAPID TRANSIT DIST
LOS ANGELES BUREAU OF SANITATION (433 S SPRING ST in LOS ANGELES, CA)
(Integrated Compliance Information System) - ICIS-09-2000-0292, FORMAL ENFORCEMENT ACTION Business SIC classification: SEWERAGE SYSTEMS
LOS ANGELES TIMES (560 S ALAMEDA ST in LOS ANGELES, CA)
(Resource Conservation and Recovery Act (tracking hazardous waste))
KENS AUTOMOTIVE (5787 W ADAMS BLVD in LOS ANGELES, CA)
Large Quantity Generators, more that 1000 kg of hazardous waste/month (Resource Conservation and Recovery Act (tracking hazardous waste)) - notification Organizations: KENNETH NUMATA (CONTACT/OWNER)
LOS ANGELES COLD STORAGE COMPANY (400 SOUTH CENTRAL AVENUE in LOS ANGELES, CA)
COMPLIANCE ACTIVITY (Tracking inspections of insecticide, fungicide, and rodenticide, and toxic substances) Small Quantity Generators, between 100 kg and 1000 kg of hazardous waste/month (Resource Conservation and Recovery Act (tracking hazardous waste)) - notification Business SIC classification: REFRIGERATED WAREHOUSING AND STORAGE Organizations: LARRY RUCH (CONTACT/OWNER)
MIRAMA CO, INC (529 CERES AVE in LOS ANGELES, CA)
Large Quantity Generators, more that 1000 kg of hazardous waste/month (Resource Conservation and Recovery Act (tracking hazardous waste)) - notification Organizations: SHARON MEYERS (CONTACT/OWNER)
GARUN JEWELRY MANUFACTURING, INC (448 SOUTH HILL STREET #1115 in LOS ANGELES, CA)
Small Quantity Generators, between 100 kg and 1000 kg of hazardous waste/month (Resource Conservation and Recovery Act (tracking hazardous waste)) - notification Organizations: PERSHING PROPERTY, LTD (CONTACT/OWNER)
GEUVJEHIZIAN GARABED JEWELRY (220 W 5TH ST #510 in LOS ANGELES, CA)
Small Quantity Generators, between 100 kg and 1000 kg of hazardous waste/month (Resource Conservation and Recovery Act (tracking hazardous waste)) - notification Organizations: RAM PROP MGMT (CONTACT/OWNER)
J.B. SEBRELL CO (301 S SAN PEDRO ST in LOS ANGELES, CA)
COMPLIANCE ACTIVITY (Tracking inspections of insecticide, fungicide, and rodenticide, and toxic substances) Alternative names: JB SEBRELL CO
Housing units lacking complete plumbing facilities: 15.9% Housing units lacking complete kitchen facilities: 14.2%
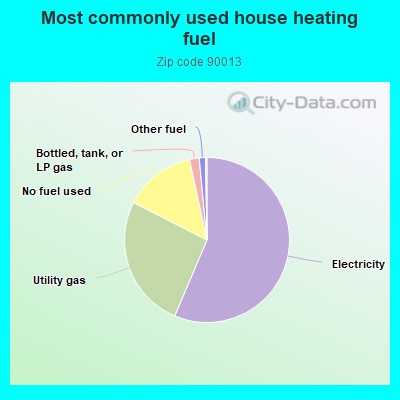
56.4%Electricity
26.1%Utility gas
14.1%No fuel used
1.9%Bottled, tank, or LP gas
1.2%Other fuel
Population in 1990: 5,653. Population change in the 1990s: +4,074 (+72.1%).
Place of birth for U.S.-born residents:
This state: 7,043
Northeast: 1,093
Midwest: 1,226
South: 1,422
West: 469
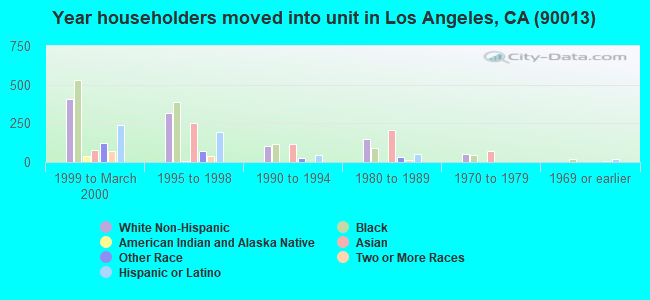
35% of the 90013 zip code residents lived in the same house 5 years ago. Out of people who lived in different houses, 78% lived in this county. Out of people who lived in different counties, 50% lived in California.
64% of the 90013 zip code residents lived in the same house 1 year ago. Out of people who lived in different houses, 68% moved from this county. Out of people who lived in different houses, 10% moved from different county within same state. Out of people who lived in different houses, 14% moved from different state. Out of people who lived in different houses, 3% moved from abroad.
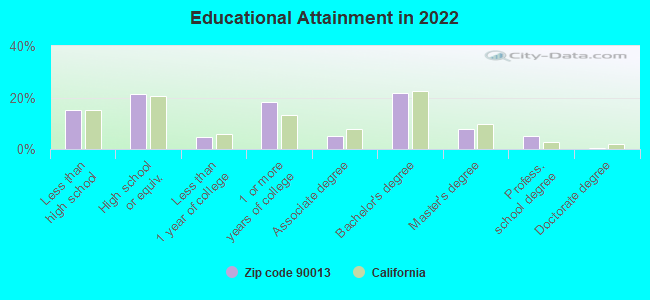
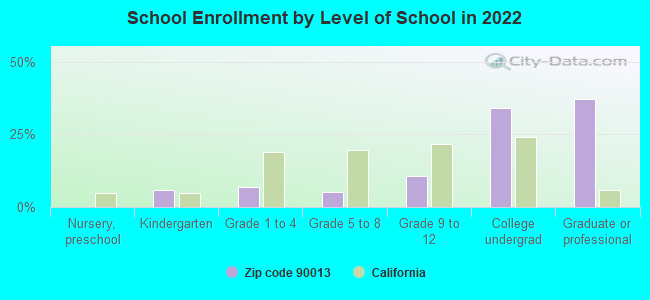
Private vs. public school enrollment:
Students in private schools in grades 1 to 8 (elementary and middle school):
Here:
0.0%
California:
10.5%
Students in private schools in grades 9 to 12 (high school):
Here:
0.0%
California:
8.5%
Students in private undergraduate colleges: 95
Here:
27.4%
California:
15.9%
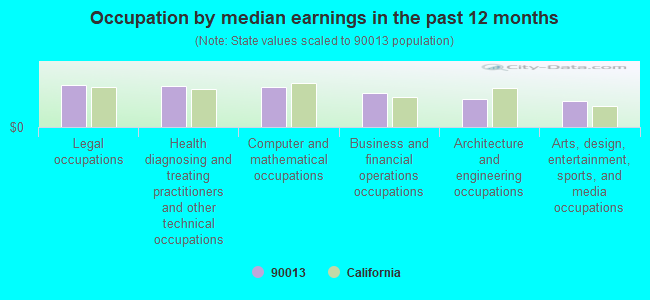
Occupation by median earnings in the past 12 months ($)
125,148Legal occupations
121,477Health diagnosing and treating practitioners and other technical occupations
118,680Computer and mathematical occupations
101,411Business and financial operations occupations
84,058Architecture and engineering occupations
77,809Arts, design, entertainment, sports, and media occupations
Companies with federal contracts located in this zip code:
SOUTHERN CALIFORNIA GAS CO (555 W 5TH ST in LOS ANGELES, CA) : $22,131,779 in 147 contractsfrom 2000 to 2006
Contracts for Maintenance, Repair and Rebuilding of Equipment -- Miscellaneous, Other Utilities, Energy Studies, Gas Services, and moreby Navy, Air Force, Army, Department of Veterans Affairs, and others Signed by year:2000: $1,063,190; 2001: $5,065,427; 2002: $8,167,902; 2003: $2,180,742; 2004: $2,368,947; 2005: $2,472,869; 2006: $812,702.
Biggest contracts:
$4,010,190 with Navy for Maintenance, Repair and Rebuilding of Equipment -- Miscellaneous. Signed on 2002-10-01. Completion date: 2003-02-25.
$1,552,050 with Navy for Other Utilities. Signed on 2001-09-27. Completion date: 2002-10-30.
$1,341,575 with Navy for Energy Studies. Signed on 2005-09-28. Completion date: 2006-09-30.
$1,258,687 with Air Force for Other Utilities. Signed on 2001-07-24. Completion date: 2004-03-31.
ALBION TULSA, LLC (215 W 6TH ST STE 1400 in LOS ANGELES, CA) : $23,880 in 5 contractsfrom 2004 to 2005
Contracts for Lodging - Hotel/Motel by Army Signed by year:2000: $0; 2001: $0; 2002: $0; 2003: $0; 2004: $22,200; 2005: $1,680; 2006: $0.
Biggest contracts:
$11,400 with Army for Lodging - Hotel/Motel. Taking place in OK. Signed on 2004-04-22. Completion date: 2005-04-20.
$10,800, same as above.Signed on 2004-04-29. Completion date: 2005-04-30.
$1,900, same as above.Signed on 2005-03-29. Completion date: 2005-04-20.
-$100, same as above.Signed on 2005-04-27. Completion date: 2005-04-27.
Top industries in this zip code by the number of employees in 2005:
Utilities: Natural Gas Distribution (500-999 employees: 1 establishment, 250-499 employees: 1 establishment, 10-19 employees: 1 establishment)
2005 - 2018 National Fire Incident Reporting System (NFIRS) incidents
According to the data from the years 2005 - 2018 the average number of fires per year is 73. The highest number of fire incidents - 122 took place in 2006, and the least - 38 in 2010. The data has a decreasing trend.
When looking into fire subcategories, the most incidents belonged to: Structure Fires (47.3%), and Outside Fires (37.1%).
Fire incident types reported to NFIRS in Zip Code 90013

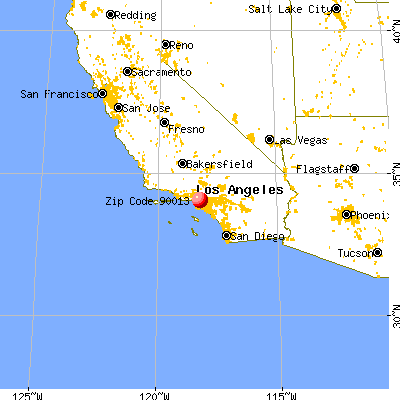


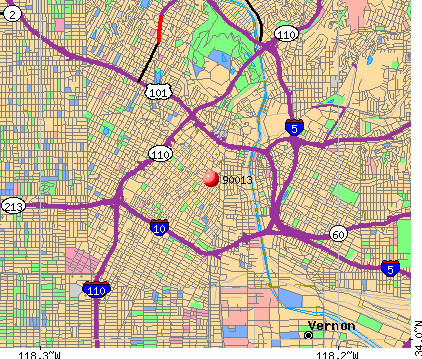 Nearest zip codes: 90014, 90079, 90071, 90021, 90012, 90017.


 According to the data from the years 2005 - 2018 the average number of fires per year is 73. The highest number of fire incidents - 122 took place in 2006, and the least - 38 in 2010. The data has a decreasing trend.
 When looking into fire subcategories, the most incidents belonged to: Structure Fires (47.3%), and Outside Fires (37.1%).