Averages for the 2020 tax year for zip code 90014, filed in 2021:
Average Adjusted Gross Income (AGI) in 2020: $78,512 (Individual Income Tax Returns)
Here:
$78,512
State:
$95,910
Salary/wage: $70,459 (reported on 78.7% of returns)
Here:
$70,459
State:
$77,331
(% of AGI for various income ranges: 1018.7% for AGIs below $25k, 4154.1% for AGIs $25k-50k, 8512.4% for AGIs $50k-75k, 13100.0% for AGIs $75k-100k, 22655.5% for AGIs $100k-200k, 98571.4% for AGIs over 200k)
Taxable interest for individuals: $2,136 (reported on 20.6% of returns)
This zip code:
$2,136
California:
$2,294
(% of AGI for various income ranges: 4.8% for AGIs below $25k, 27.1% for AGIs $25k-50k, 22.8% for AGIs $50k-75k, 17.1% for AGIs $75k-100k, 37.2% for AGIs $100k-200k, 1895.7% for AGIs over 200k)
Ordinary dividends: $5,306 (reported on 16.5% of returns)
Here:
$5,306
State:
$10,949
(% of AGI for various income ranges: 11.7% for AGIs below $25k, 35.5% for AGIs $25k-50k, 40.0% for AGIs $50k-75k, 53.3% for AGIs $75k-100k, 213.4% for AGIs $100k-200k, 3255.7% for AGIs over 200k)
Net capital gain/loss in AGI: +$19,238 (reported on 18.8% of returns)
Here:
+$19,238
State:
+$49,306
(% of AGI for various income ranges: 18.8% for AGIs below $25k, 55.3% for AGIs $25k-50k, 244.8% for AGIs $50k-75k, 265.2% for AGIs $75k-100k, 569.7% for AGIs $100k-200k, 15285.7% for AGIs over 200k)
Profit/loss from business: +$12,667 (reported on 30.3% of returns)
Here:
+$12,667
State:
+$15,671
(% of AGI for various income ranges: 201.7% for AGIs below $25k, 585.5% for AGIs $25k-50k, 764.1% for AGIs $50k-75k, 619.0% for AGIs $75k-100k, 947.2% for AGIs $100k-200k, 5944.3% for AGIs over 200k)
Taxable individual retirement arrangement distribution: $17,650 (reported on 1.5% of returns)
90014:
$17,650
California:
$23,505
(% of AGI for various income ranges: 88.6% for AGIs $25k-50k, 215.5% for AGIs $100k-200k)
Self-employed (Keogh) retirement plans: $23,500 (reported on 0.5% of returns)
90014:
$23,500
California:
$30,163
(% of AGI for various income ranges: 95.9% for AGIs $25k-50k)
Total itemized deductions: $34,981 (reported on 8.0% of returns)
Here:
$34,981
State:
$39,517
(% of AGI for various income ranges: 173.9% for AGIs $25k-50k, 237.2% for AGIs $50k-75k, 439.5% for AGIs $75k-100k, 894.1% for AGIs $100k-200k, 8268.6% for AGIs over 200k)
Charity contributions: $9,226 (reported on 5.9% of returns)
Here:
$9,226
State:
$12,598
(% of AGI for various income ranges: 13.2% for AGIs below $25k, 51.4% for AGIs $50k-75k, 70.5% for AGIs $75k-100k, 175.5% for AGIs $100k-200k, 1725.7% for AGIs over 200k)
Taxes paid: $8,081 (reported on 8.0% of returns)
90014:
$8,081
State:
$8,807
(% of AGI for various income ranges: 35.1% for AGIs $25k-50k, 58.3% for AGIs $50k-75k, 143.8% for AGIs $75k-100k, 317.2% for AGIs $100k-200k, 1345.7% for AGIs over 200k)
Earned income credit: $822 (reported on 13.9% of returns)
Here:
$822
State:
$2,074
(% of AGI for various income ranges: 45.2% for AGIs below $25k, 14.9% for AGIs $25k-50k)
Percentage of individuals using paid preparers for their 2020 taxes: 93.1%
Here:
93%
State:
92%
(% for various income ranges: 91.0% for AGIs below $25k, 92.8% for AGIs $25k-50k, 92.0% for AGIs $50k-75k, 97.3% for AGIs $75k-100k, 96.5% for AGIs $100k-200k, 92.9% for AGIs over 200k)
Averages for the 2012 tax year for zip code 90014, filed in 2013:
Average Adjusted Gross Income (AGI) in 2012: $60,246 (Individual Income Tax Returns)
Here:
$60,246
State:
$72,726
Salary/wage: $53,487 (reported on 83.1% of returns)
Here:
$53,487
State:
$59,079
(% of AGI for various income ranges: 71.6% for AGIs below $25k, 85.0% for AGIs $25k-50k, 91.0% for AGIs $50k-75k, 91.7% for AGIs $75k-100k, 85.6% for AGIs $100k-200k, 38.5% for AGIs over 200k)
Taxable interest for individuals: $1,610 (reported on 20.5% of returns)
This zip code:
$1,610
California:
$2,146
(% of AGI for various income ranges: 0.3% for AGIs below $25k, 0.1% for AGIs $25k-50k, 0.2% for AGIs $50k-75k, 0.1% for AGIs $75k-100k, 0.3% for AGIs $100k-200k, 1.5% for AGIs over 200k)
Ordinary dividends: $3,971 (reported on 10.7% of returns)
Here:
$3,971
State:
$9,308
(% of AGI for various income ranges: 0.2% for AGIs below $25k, 0.7% for AGIs $25k-50k, 0.3% for AGIs $50k-75k, 0.2% for AGIs $75k-100k, 0.5% for AGIs $100k-200k, 1.5% for AGIs over 200k)
Net capital gain/loss in AGI: +$19,159 (reported on 10.4% of returns)
Here:
+$19,159
State:
+$30,460
(% of AGI for various income ranges: 1.2% for AGIs $100k-200k, 11.7% for AGIs over 200k)
Profit/loss from business: +$12,632 (reported on 28.1% of returns)
Here:
+$12,632
State:
+$17,064
(% of AGI for various income ranges: 22.0% for AGIs below $25k, 9.8% for AGIs $25k-50k, 5.2% for AGIs $50k-75k, 2.4% for AGIs $75k-100k, 4.4% for AGIs $100k-200k, 2.8% for AGIs over 200k)
Taxable individual retirement arrangement distribution: $11,343 (reported on 2.0% of returns)
90014:
$11,343
California:
$19,557
Self-employment retirement plans: $18,850 (reported on 0.6% of returns)
90014:
$18,850
California:
$24,530
Total itemized deductions: $24,780 (20% of AGI, reported on 31.7% of returns)
Here:
$24,780
State:
$34,004
Here:
19.6% of AGI
State:
22.7% of AGI
(% of AGI for various income ranges: 6.8% for AGIs below $25k, 7.8% for AGIs $25k-50k, 13.8% for AGIs $50k-75k, 13.5% for AGIs $75k-100k, 15.6% for AGIs $100k-200k, 14.4% for AGIs over 200k)
Charity contributions: $3,059 (reported on 23.0% of returns)
Here:
$3,059
State:
$4,659
(% of AGI for various income ranges: 0.6% for AGIs below $25k, 0.8% for AGIs $25k-50k, 1.1% for AGIs $50k-75k, 1.0% for AGIs $75k-100k, 1.2% for AGIs $100k-200k, 1.7% for AGIs over 200k)
Taxes paid: $10,532 (reported on 31.7% of returns)
90014:
$10,532
State:
$14,448
(% of AGI for various income ranges: 1.2% for AGIs below $25k, 1.6% for AGIs $25k-50k, 4.0% for AGIs $50k-75k, 5.8% for AGIs $75k-100k, 7.6% for AGIs $100k-200k, 7.6% for AGIs over 200k)
Earned income credit: $1,098 (reported on 17.1% of returns)
Here:
$1,098
State:
$2,286
(% of AGI for various income ranges: 3.6% for AGIs below $25k, 0.2% for AGIs $25k-50k)
Percentage of individuals using paid preparers for their 2012 taxes: 54.8%
Here:
55%
State:
64%
(% for various income ranges: 52.8% for AGIs below $25k, 51.9% for AGIs $25k-50k, 52.0% for AGIs $50k-75k, 52.9% for AGIs $75k-100k, 65.9% for AGIs $100k-200k, 80.0% for AGIs over 200k)
Averages for the 2004 tax year for zip code 90014, filed in 2005:
Average Adjusted Gross Income (AGI) in 2004: $41,736 (Individual Income Tax Returns)
Here:
$41,736
State:
$58,600
Salary/wage: $30,399 (reported on 76.7% of returns)
Here:
$30,399
State:
$49,455
(% of AGI for various income ranges: 309.4% for AGIs below $10k, 81.3% for AGIs $10k-25k, 86.0% for AGIs $25k-50k, 84.5% for AGIs $50k-75k, 65.2% for AGIs $75k-100k, 25.7% for AGIs over 100k)
Taxable interest for individuals: $4,115 (reported on 20.0% of returns)
This zip code:
$4,115
California:
$2,365
(% of AGI for various income ranges: 9.0% for AGIs below $10k, 0.2% for AGIs $10k-25k, 0.4% for AGIs $25k-50k, 0.4% for AGIs $50k-75k, 0.2% for AGIs $75k-100k, 3.6% for AGIs over 100k)
Taxable dividends: $5,139 (reported on 8.5% of returns)
Here:
$5,139
State:
$4,746
(% of AGI for various income ranges: 2.0% for AGIs below $10k, 0.1% for AGIs $10k-25k, 0.3% for AGIs $25k-50k, 0.4% for AGIs $50k-75k, 0.0% for AGIs $75k-100k, 1.9% for AGIs over 100k)
Net capital gain/loss: +$20,504 (reported on 9.6% of returns)
Here:
+$20,504
State:
+$23,418
(% of AGI for various income ranges: -7.1% for AGIs below $10k, -0.1% for AGIs $10k-25k, 0.9% for AGIs $25k-50k, 1.4% for AGIs $75k-100k, 9.2% for AGIs over 100k)
Profit/loss from business: +$11,155 (reported on 25.9% of returns)
Here:
+$11,155
State:
+$16,826
(% of AGI for various income ranges: 78.0% for AGIs below $10k, 13.4% for AGIs $10k-25k, 7.8% for AGIs $25k-50k, 4.1% for AGIs $50k-75k, 10.7% for AGIs $75k-100k, 3.3% for AGIs over 100k)
IRA payment deduction: $3,118 (reported on 1.3% of returns)
90014:
$3,118
California:
$3,192
Total itemized deductions: $28,553 (21% of AGI, reported on 19.7% of returns)
Here:
$28,553
State:
$28,113
Here:
20.7% of AGI
State:
25.3% of AGI
(% of AGI for various income ranges: 5.7% for AGIs $10k-25k, 10.3% for AGIs $25k-50k, 12.3% for AGIs $50k-75k, 15.7% for AGIs $75k-100k, 16.9% for AGIs over 100k)
Charity contributions deductions: $6,756 (4% of AGI, reported on 15.2% of returns)
Here:
$6,756
State:
$3,923
Here:
4.3% of AGI
State:
3.3% of AGI
(% of AGI for various income ranges: 0.4% for AGIs $10k-25k, 1.5% for AGIs $25k-50k, 1.3% for AGIs $50k-75k, 1.4% for AGIs $75k-100k, 3.8% for AGIs over 100k)
Total tax: $9,928 (reported on 71.1% of returns)
90014:
$9,928
State:
$10,761
(% of AGI for various income ranges: 23.6% for AGIs below $10k, 5.9% for AGIs $10k-25k, 8.7% for AGIs $25k-50k, 12.7% for AGIs $50k-75k, 15.6% for AGIs $75k-100k, 23.9% for AGIs over 100k)
Earned income credit: $1,283 (reported on 24.6% of returns)
Here:
$1,283
State:
$1,763
Percentage of individuals using paid preparers for their 2004 taxes: 67.0%
Here:
67%
State:
66%
(% for various income ranges: 65.9% for AGIs below $10k, 65.9% for AGIs $10k-25k, 64.3% for AGIs $25k-50k, 60.9% for AGIs $50k-75k, 77.3% for AGIs $75k-100k, 87.7% for AGIs over 100k)
Likely homosexual households (counted as self-reported same-sex unmarried-partner households)
Lesbian couples: 0.3% of all households
Gay men: 0.0% of all households
Household received Food Stamps/SNAP in the past 12 months: 1,952 Household did not receive Food Stamps/SNAP in the past 12 months: 4,502
Women who had a birth in the past 12 months: 66 (58 now married, 7 unmarried) Women who did not have a birth in the past 12 months: 2,435 (439 now married, 2,017 unmarried)
Housing units in zip code 90014 with a mortgage: 190 (8 second mortgage, 9 home equity loan) Residents with income below the poverty level in 2022:
This zip code:
35.8%
Whole state:
12.2%
Residents with income below 50% of the poverty level in 2022:
This zip code:
18.7%
Whole state:
6.2%
Median number of rooms in houses and condos:
Here:
1.4
State:
6.0
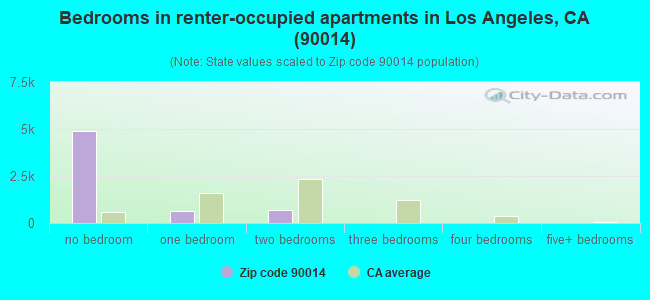
Median number of rooms in apartments:
Here:
1.3
State:
3.9
Notable locations in this zip code not listed on our city pages
Notable locations in zip code 90014: Los Angeles Flower Mart (A), Los Angeles Athletic Club (B), Garfield Building (C), Los Angeles Stock Exchange Building (D), Cooper Building (E), Eastern Columbia Building (F), Spring Street Towers (G), Story Building (H), Oviatt Building (I), City of Los Angeles Fire Department Station 9 (J). Display/hide their locations on the map
In group quarters: 771 (-1 institutionalized population)
Size of family households: 722 2-persons, 275 3-persons, 98 4-persons, 17 5-persons
Size of nonfamily households: 4,522 1-person, 680 2-persons, 6 5-persons
238 married couples with children.
177 single-parent households (109 men, 68 women).
59.9% of residents of 90014 zip code speak English at home.
17.0% of residents speak Spanish at home (77% very well, 12% well, 8% not well, 3% not at all).
4.3% of residents speak other Indo-European language at home (98% very well, 2% not well).
18.2% of residents speak Asian or Pacific Island language at home (29% very well, 7% well, 31% not well, 33% not at all).
0.4% of residents speak other language at home (100% very well).
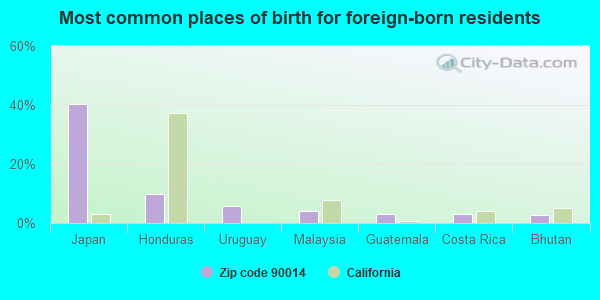
Foreign born population: 2,802 (30.5%) (59.0% of them are naturalized citizens)
Major facilities with environmental interests located in this zip code:
JEWELRY DESIGN CENTER (404 W 7TH ST STE 1020 in LOS ANGELES, CA)
STATE MASTER (California - Hazardous Waste Tracking) - HAZARDOU WASTE PROGRAM (Integrated Compliance Information System) - ICIS-09-1993-0032, FORMAL ENFORCEMENT ACTION National Pollutant Discharge Elimination System NON-MAJOR (Tracking pollutant discharge elimination systems) - permit Small Quantity Generators, between 100 kg and 1000 kg of hazardous waste/month (Resource Conservation and Recovery Act (tracking hazardous waste)) - notification Organizations: HAKAKIAN AND HANASAB (CONTACT/OWNER)
Alternative names: JEWLERY DESIGN CENTER
M AND M HOLDING L L C (728 S HILL ST in LOS ANGELES, CA)
STATE MASTER (California - Hazardous Waste Tracking) - HAZARDOU WASTE PROGRAM Large Quantity Generators, more that 1000 kg of hazardous waste/month (Resource Conservation and Recovery Act (tracking hazardous waste)) - notification Alternative names: M & M HOLDING, LLC
ADAMS PRESS (830 S BROADWAY ST in LOS ANGELES, CA)
STATE MASTER (California - Hazardous Waste Tracking) - HAZARDOU WASTE PROGRAM Small Quantity Generators, between 100 kg and 1000 kg of hazardous waste/month (Resource Conservation and Recovery Act (tracking hazardous waste)) - notification Business NAICS classification: OTHER COMMERCIAL PRINTING. Organizations: STEVE MARIENHOFF (CONTACT/OWNER)
JEWELERS MALL THE (625 S HILL ST in LOS ANGELES, CA)
STATE MASTER (California - Hazardous Waste Tracking) - HAZARDOU WASTE PROGRAM Small Quantity Generators, between 100 kg and 1000 kg of hazardous waste/month (Resource Conservation and Recovery Act (tracking hazardous waste)) - notification Organizations: WESTERN JEWELRY MART (CONTACT/OWNER)
MISSION ENGRAVING & OFFSET PLATE COMPANY (421 EAST 6TH STREET in LOS ANGELES, CA)
STATE MASTER (California - Hazardous Waste Tracking) - HAZARDOU WASTE PROGRAM CRITERIA AND HAZARDOUS AIR POLLUTANT INVENTORY (Inventory of air pollution sources) Small Quantity Generators, between 100 kg and 1000 kg of hazardous waste/month (Resource Conservation and Recovery Act (tracking hazardous waste)) Business NAICS classification: PREPRESS SERVICES. Alternative names: MISSION ENGRAVING OFFSET PLATE CO#, MISSION ENGRV OFFSET PLATE CO
AMER TELE & TELE CO LOS ANGELES #1 (433 S OLIVE ST in LOS ANGELES, CA)
STATE MASTER (California - Hazardous Waste Tracking) - HAZARDOU WASTE PROGRAM Small Quantity Generators, between 100 kg and 1000 kg of hazardous waste/month (Resource Conservation and Recovery Act (tracking hazardous waste)) Alternative names: AT&T CORP
N T A INVESTMENTS (718 S HILL ST STE 103 in LOS ANGELES, CA)
STATE MASTER (California - Hazardous Waste Tracking) - HAZARDOU WASTE PROGRAM Small Quantity Generators, between 100 kg and 1000 kg of hazardous waste/month (Resource Conservation and Recovery Act (tracking hazardous waste)) - notification
O D I MOUNTINGS INC (718 S HILL ST NO 303 in LOS ANGELES, CA)
STATE MASTER (California - Hazardous Waste Tracking) - HAZARDOU WASTE PROGRAM TRANSPORTER (Resource Conservation and Recovery Act (tracking hazardous waste)) - notification Organizations: ANI MARKOSYAN (CONTACT/OWNER)
CAL-MART PLATING CO (404 W 7TH ST in LOS ANGELES, CA)
STATE MASTER (California - Hazardous Waste Tracking) - HAZARDOU WASTE PROGRAM Small Quantity Generators, between 100 kg and 1000 kg of hazardous waste/month (Resource Conservation and Recovery Act (tracking hazardous waste)) Business NAICS classification: ELECTROPLATING, PLATING, POLISHING, ANODIZING, AND COLORING.
LAS FAMILIAS DEL PUEBLO VALUE (307 E. 7TH STREET in LOS ANGELES, CA)
(National Center for Education Statistics) - STATE ID-6119903 Organizations: LOS ANGELES UNIFIED (SCHOOL DISTRICT)
LIBERTY NATIONAL ENTERPRISES (830 HILL STREET in LOS ANGELES, CA)
KITSINIAN JEWELRY (629 S HILL ST #200 in LOS ANGELES, CA)
(Resource Conservation and Recovery Act (tracking hazardous waste)) Organizations: SARKIS A KITSINIAN (CONTACT/OWNER)
LOS ANGELES UNITED INVEST CO (650 S HILL ST in LOS ANGELES, CA)
Large Quantity Generators, more that 1000 kg of hazardous waste/month (Resource Conservation and Recovery Act (tracking hazardous waste)) Organizations: LAUIC (CONTACT/OWNER)
Housing units lacking complete plumbing facilities: 7.2% Housing units lacking complete kitchen facilities: 11.8%
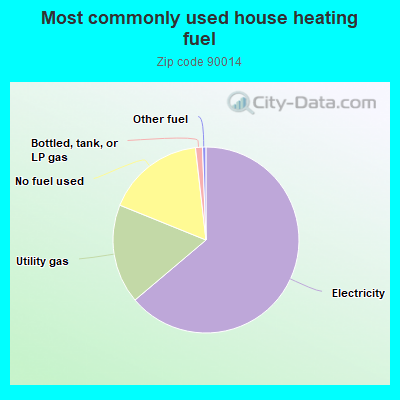
63.9%Electricity
17.3%Utility gas
17.1%No fuel used
1.2%Bottled, tank, or LP gas
0.6%Other fuel
Population in 1990: 2,715. Population change in the 1990s: +803 (+29.6%).
Place of birth for U.S.-born residents:
This state: 2,957
Northeast: 853
Midwest: 765
South: 1,080
West: 348
47% of the 90014 zip code residents lived in the same house 5 years ago. Out of people who lived in different houses, 83% lived in this county. Out of people who lived in different counties, 50% lived in California.
71% of the 90014 zip code residents lived in the same house 1 year ago. Out of people who lived in different houses, 60% moved from this county. Out of people who lived in different houses, 9% moved from different county within same state. Out of people who lived in different houses, 24% moved from different state. Out of people who lived in different houses, 2% moved from abroad.
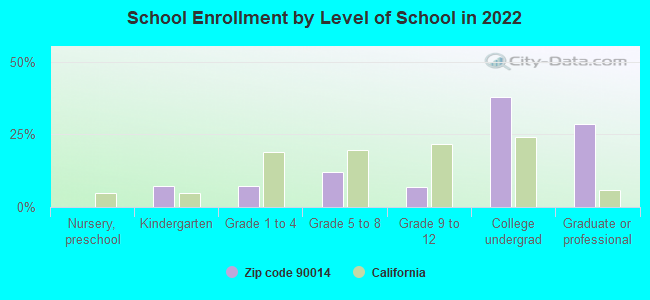
Private vs. public school enrollment:
Students in private schools in grades 1 to 8 (elementary and middle school): 17
Here:
10.1%
California:
10.5%
Students in private schools in grades 9 to 12 (high school):
Here:
0.0%
California:
8.5%
Students in private undergraduate colleges: 42
Here:
12.7%
California:
15.9%
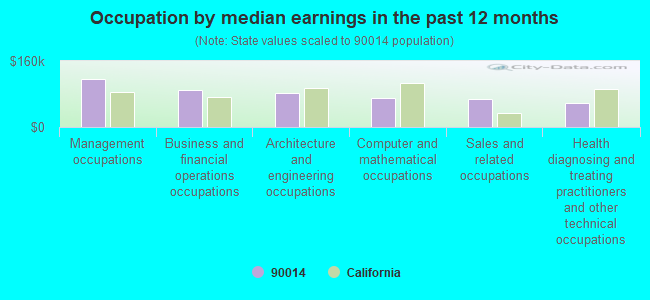
Occupation by median earnings in the past 12 months ($)
117,096Management occupations
88,945Business and financial operations occupations
82,859Architecture and engineering occupations
69,844Computer and mathematical occupations
67,070Sales and related occupations
58,248Health diagnosing and treating practitioners and other technical occupations
Companies with federal contracts located in this zip code:
SHERMAN WAY LTD (15350 SHERMAN WAY 410 in LOS ANGELES, CA; small business) : $2,017,871 in 19 contractsfrom 1999 to 2003
Contracts for Lease or Rental of Facilities -- Office Buildings by Public Buildings Service Signed by year:2000: $378,000; 2001: $446,000; 2002: $508,692; 2003: $559,179; 2004: $0; 2005: $0; 2006: $0.
Biggest contracts:
$126,000 with Public Buildings Service for Lease or Rental of Facilities -- Office Buildings. Signed on 2001-06-15. Completion date: 2001-06-15.
$126,000, same as above.Signed on 2001-03-15. Completion date: 2001-03-15.
$126,000, same as above.Signed on 1999-12-15. Completion date: 1999-12-15.
$126,000, same as above.Signed on 2000-09-15. Completion date: 2000-09-15.
FIESTA FABRIC (850 MAPLE AVE in LOS ANGELES, CA; small business) : $932,952 in 3 contractsfrom 1999 to 2001
$494,011 with Army for Fiber Optic Cables. Taking place in AZ. Signed on 2001-02-06. Completion date: 2001-07-09.
$400,000, same as above.Signed on 2000-05-25. Completion date: 2001-05-01.
$38,941, same as above.Signed on 1999-11-18. Completion date: 2000-01-03.
SULLIVAN CONSULTING GROUP INC (523 W 6TH ST STE 1122 in LOS ANGELES, CA; small business) : $759,000 in 17 contractsfrom 2000 to 2006
Contracts for Other Management Support Services, Other Professional Services, Program Evaluation Services, Vocational/Technical by U.S. Army Corps of Engineers - civil program financing only, Army Signed by year:2000: $61,400; 2001: $115,500; 2002: $140,500; 2003: $149,500; 2004: $57,300; 2005: $214,800; 2006: $20,000.
Biggest contracts:
$77,500 with U.S. Army Corps of Engineers - civil program financing only for Other Management Support Services. Signed on 2003-09-09. Completion date: 2004-09-30.
$75,000 with U.S. Army Corps of Engineers - civil program financing only for Other Professional Services. Signed on 2005-04-20. Completion date: 2005-09-27.
$75,000 with Army for Other Professional Services. Signed on 2005-04-20. Completion date: 2005-09-27.
$75,000 with U.S. Army Corps of Engineers - civil program financing only for Other Management Support Services. Signed on 2002-09-28. Completion date: 2003-03-30.
Top industries in this zip code by the number of employees in 2005:
2005 - 2018 National Fire Incident Reporting System (NFIRS) incidents
According to the data from the years 2005 - 2018 the average number of fires per year is 89. The highest number of fire incidents - 205 took place in 2018, and the least - 35 in 2012. The data has an increasing trend.
When looking into fire subcategories, the most incidents belonged to: Structure Fires (48.6%), and Outside Fires (34.1%).
Fire incident types reported to NFIRS in Zip Code 90014


 Nearest zip codes: 90079, 90071, 90013, 90015, 90017, 90021.


 According to the data from the years 2005 - 2018 the average number of fires per year is 89. The highest number of fire incidents - 205 took place in 2018, and the least - 35 in 2012. The data has an increasing trend.
 When looking into fire subcategories, the most incidents belonged to: Structure Fires (48.6%), and Outside Fires (34.1%).