Estimated zip code population in 2022: 25,341 Zip code population in 2010: 18,986 Zip code population in 2000: 15,134
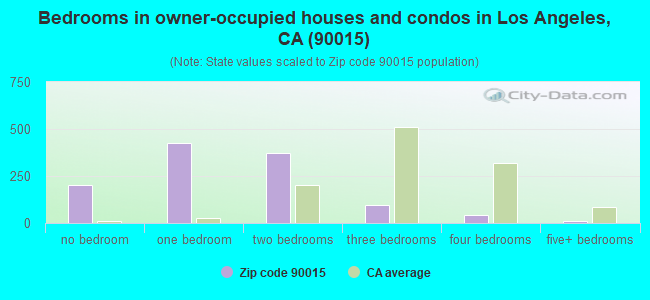
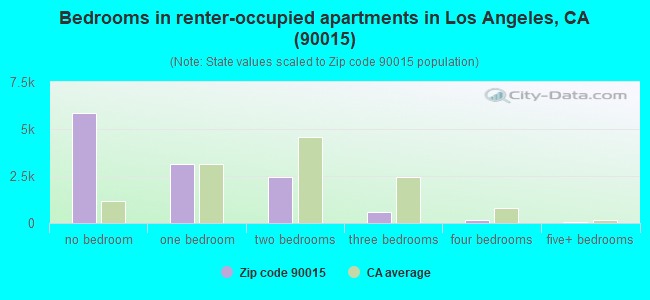
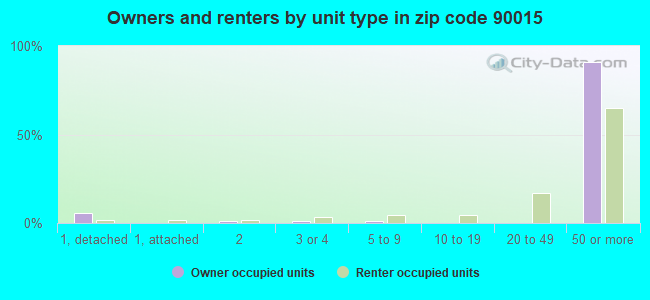
Houses and condos: 14,659 Renter-occupied apartments: 11,883
% of renters here:
91%
State:
44%
March 2022 cost of living index in zip code 90015: 147.4 (very high, U.S. average is 100)
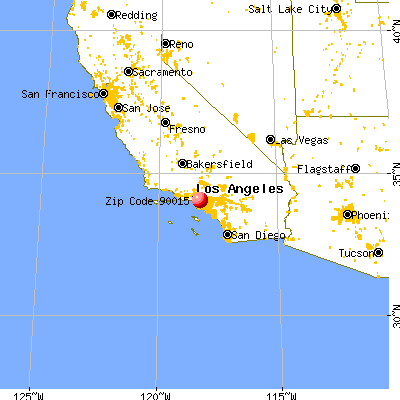
Land area: 1.7 sq. mi. Water area: 0.0 sq. mi.
Population density: 14,814 people per square mile
(very high).
OSM Map
General Map
Google Map
MSN Map
OSM Map
General Map
Google Map
MSN Map
OSM Map
General Map
Google Map
MSN Map
OSM Map
General Map
Google Map
MSN Map
Please wait while loading the map...
Real estate property taxes paid for housing units in 2022:
This zip code:
0.9% ($9,331)
California:
0.7% ($4,831)
Median real estate property taxes paid for housing units with mortgages in 2022: $9,272 (0.9%) Median real estate property taxes paid for housing units with no mortgage in 2022: $9,703 (1.2%)
Averages for the 2020 tax year for zip code 90015, filed in 2021:
Average Adjusted Gross Income (AGI) in 2020: $77,597 (Individual Income Tax Returns)
Here:
$77,597
State:
$95,910
Salary/wage: $68,235 (reported on 82.5% of returns)
Here:
$68,235
State:
$77,331
(% of AGI for various income ranges: 1222.6% for AGIs below $25k, 4280.4% for AGIs $25k-50k, 7919.1% for AGIs $50k-75k, 12205.7% for AGIs $75k-100k, 23159.1% for AGIs $100k-200k, 109080.5% for AGIs over 200k)
Taxable interest for individuals: $2,242 (reported on 19.0% of returns)
This zip code:
$2,242
California:
$2,294
(% of AGI for various income ranges: 5.5% for AGIs below $25k, 10.9% for AGIs $25k-50k, 21.6% for AGIs $50k-75k, 38.4% for AGIs $75k-100k, 91.7% for AGIs $100k-200k, 1758.5% for AGIs over 200k)
Ordinary dividends: $4,441 (reported on 15.0% of returns)
Here:
$4,441
State:
$10,949
(% of AGI for various income ranges: 9.5% for AGIs below $25k, 11.2% for AGIs $25k-50k, 20.5% for AGIs $50k-75k, 26.2% for AGIs $75k-100k, 124.7% for AGIs $100k-200k, 3037.0% for AGIs over 200k)
Net capital gain/loss in AGI: +$30,670 (reported on 17.1% of returns)
Here:
+$30,670
State:
+$49,306
(% of AGI for various income ranges: 13.7% for AGIs below $25k, 30.7% for AGIs $25k-50k, 92.4% for AGIs $50k-75k, 108.2% for AGIs $75k-100k, 467.3% for AGIs $100k-200k, 27921.0% for AGIs over 200k)
Profit/loss from business: +$12,910 (reported on 24.9% of returns)
Here:
+$12,910
State:
+$15,671
(% of AGI for various income ranges: 312.4% for AGIs below $25k, 226.1% for AGIs $25k-50k, 279.4% for AGIs $50k-75k, 474.9% for AGIs $75k-100k, 727.7% for AGIs $100k-200k, 7075.0% for AGIs over 200k)
Taxable individual retirement arrangement distribution: $25,094 (reported on 1.4% of returns)
90015:
$25,094
California:
$23,505
(% of AGI for various income ranges: 16.2% for AGIs below $25k, 44.7% for AGIs $50k-75k, 100.4% for AGIs $100k-200k, 1196.0% for AGIs over 200k)
Self-employed (Keogh) retirement plans: $36,738 (reported on 0.7% of returns)
90015:
$36,738
California:
$30,163
(% of AGI for various income ranges: 58.5% for AGIs $75k-100k, 1291.0% for AGIs over 200k)
Total itemized deductions: $33,110 (reported on 8.5% of returns)
Here:
$33,110
State:
$39,517
(% of AGI for various income ranges: 29.5% for AGIs below $25k, 105.5% for AGIs $25k-50k, 203.9% for AGIs $50k-75k, 513.4% for AGIs $75k-100k, 1169.2% for AGIs $100k-200k, 8076.5% for AGIs over 200k)
Charity contributions: $9,873 (reported on 6.5% of returns)
Here:
$9,873
State:
$12,598
(% of AGI for various income ranges: 20.8% for AGIs $25k-50k, 41.8% for AGIs $50k-75k, 97.7% for AGIs $75k-100k, 226.2% for AGIs $100k-200k, 2224.5% for AGIs over 200k)
Taxes paid: $8,971 (reported on 8.5% of returns)
90015:
$8,971
State:
$8,807
(% of AGI for various income ranges: 7.1% for AGIs below $25k, 25.9% for AGIs $25k-50k, 64.6% for AGIs $50k-75k, 159.7% for AGIs $75k-100k, 404.7% for AGIs $100k-200k, 1780.5% for AGIs over 200k)
Earned income credit: $1,757 (reported on 15.4% of returns)
Here:
$1,757
State:
$2,074
(% of AGI for various income ranges: 85.5% for AGIs below $25k, 48.1% for AGIs $25k-50k)
Percentage of individuals using paid preparers for their 2020 taxes: 91.8%
Here:
92%
State:
92%
(% for various income ranges: 88.3% for AGIs below $25k, 91.5% for AGIs $25k-50k, 94.3% for AGIs $50k-75k, 94.8% for AGIs $75k-100k, 95.9% for AGIs $100k-200k, 95.9% for AGIs over 200k)
Averages for the 2012 tax year for zip code 90015, filed in 2013:
Average Adjusted Gross Income (AGI) in 2012: $53,462 (Individual Income Tax Returns)
Here:
$53,462
State:
$72,726
Salary/wage: $45,337 (reported on 83.1% of returns)
Here:
$45,337
State:
$59,079
(% of AGI for various income ranges: 79.3% for AGIs below $25k, 88.1% for AGIs $25k-50k, 88.0% for AGIs $50k-75k, 88.4% for AGIs $75k-100k, 84.9% for AGIs $100k-200k, 46.7% for AGIs over 200k)
Taxable interest for individuals: $1,899 (reported on 18.5% of returns)
This zip code:
$1,899
California:
$2,146
(% of AGI for various income ranges: 0.2% for AGIs below $25k, 0.3% for AGIs $25k-50k, 0.6% for AGIs $50k-75k, 0.3% for AGIs $75k-100k, 0.7% for AGIs $100k-200k, 1.0% for AGIs over 200k)
Ordinary dividends: $4,953 (reported on 8.6% of returns)
Here:
$4,953
State:
$9,308
(% of AGI for various income ranges: 0.2% for AGIs below $25k, 0.3% for AGIs $25k-50k, 0.2% for AGIs $50k-75k, 0.5% for AGIs $75k-100k, 0.9% for AGIs $100k-200k, 1.3% for AGIs over 200k)
Net capital gain/loss in AGI: +$11,430 (reported on 8.6% of returns)
Here:
+$11,430
State:
+$30,460
(% of AGI for various income ranges: 0.5% for AGIs $75k-100k, 1.5% for AGIs $100k-200k, 4.1% for AGIs over 200k)
Profit/loss from business: +$12,439 (reported on 24.2% of returns)
Here:
+$12,439
State:
+$17,064
(% of AGI for various income ranges: 17.2% for AGIs below $25k, 6.3% for AGIs $25k-50k, 4.7% for AGIs $50k-75k, 4.2% for AGIs $75k-100k, 5.1% for AGIs $100k-200k, 2.1% for AGIs over 200k)
Taxable individual retirement arrangement distribution: $15,771 (reported on 1.9% of returns)
90015:
$15,771
California:
$19,557
(% of AGI for various income ranges: 0.4% for AGIs below $25k, 0.5% for AGIs $25k-50k, 0.8% for AGIs $50k-75k, 2.1% for AGIs $100k-200k)
Self-employment retirement plans: $23,500 (reported on 0.5% of returns)
90015:
$23,500
California:
$24,530
Total itemized deductions: $32,657 (21% of AGI, reported on 22.4% of returns)
Here:
$32,657
State:
$34,004
Here:
20.8% of AGI
State:
22.7% of AGI
(% of AGI for various income ranges: 4.3% for AGIs below $25k, 7.9% for AGIs $25k-50k, 14.5% for AGIs $50k-75k, 17.9% for AGIs $75k-100k, 18.1% for AGIs $100k-200k, 16.0% for AGIs over 200k)
Charity contributions: $4,250 (reported on 15.8% of returns)
Here:
$4,250
State:
$4,659
(% of AGI for various income ranges: 0.3% for AGIs below $25k, 0.7% for AGIs $25k-50k, 1.2% for AGIs $50k-75k, 1.4% for AGIs $75k-100k, 1.4% for AGIs $100k-200k, 1.7% for AGIs over 200k)
Taxes paid: $14,495 (reported on 22.3% of returns)
90015:
$14,495
State:
$14,448
(% of AGI for various income ranges: 1.0% for AGIs below $25k, 1.6% for AGIs $25k-50k, 4.8% for AGIs $50k-75k, 6.9% for AGIs $75k-100k, 8.8% for AGIs $100k-200k, 8.2% for AGIs over 200k)
Earned income credit: $2,305 (reported on 27.3% of returns)
Here:
$2,305
State:
$2,286
(% of AGI for various income ranges: 7.5% for AGIs below $25k, 1.2% for AGIs $25k-50k)
Percentage of individuals using paid preparers for their 2012 taxes: 70.9%
Here:
71%
State:
64%
(% for various income ranges: 71.8% for AGIs below $25k, 73.7% for AGIs $25k-50k, 67.8% for AGIs $50k-75k, 57.1% for AGIs $75k-100k, 62.7% for AGIs $100k-200k, 81.5% for AGIs over 200k)
Averages for the 2004 tax year for zip code 90015, filed in 2005:
Average Adjusted Gross Income (AGI) in 2004: $26,648 (Individual Income Tax Returns)
Here:
$26,648
State:
$58,600
Salary/wage: $25,101 (reported on 83.7% of returns)
Here:
$25,101
State:
$49,455
(% of AGI for various income ranges: 116.7% for AGIs below $10k, 87.4% for AGIs $10k-25k, 91.4% for AGIs $25k-50k, 86.8% for AGIs $50k-75k, 79.3% for AGIs $75k-100k, 49.8% for AGIs over 100k)
Taxable interest for individuals: $1,297 (reported on 16.8% of returns)
This zip code:
$1,297
California:
$2,365
(% of AGI for various income ranges: 2.8% for AGIs below $10k, 0.3% for AGIs $10k-25k, 0.2% for AGIs $25k-50k, 0.7% for AGIs $50k-75k, 1.4% for AGIs $75k-100k, 1.6% for AGIs over 100k)
Taxable dividends: $1,575 (reported on 4.3% of returns)
Here:
$1,575
State:
$4,746
(% of AGI for various income ranges: 0.7% for AGIs below $10k, 0.1% for AGIs $10k-25k, 0.0% for AGIs $25k-50k, 0.3% for AGIs $50k-75k, 0.1% for AGIs $75k-100k, 0.6% for AGIs over 100k)
Net capital gain/loss: +$13,810 (reported on 4.5% of returns)
Here:
+$13,810
State:
+$23,418
(% of AGI for various income ranges: -0.9% for AGIs below $10k, 0.1% for AGIs $10k-25k, 0.2% for AGIs $25k-50k, 2.4% for AGIs $50k-75k, 2.2% for AGIs $75k-100k, 7.2% for AGIs over 100k)
Profit/loss from business: +$10,090 (reported on 20.9% of returns)
Here:
+$10,090
State:
+$16,826
(% of AGI for various income ranges: 42.7% for AGIs below $10k, 9.9% for AGIs $10k-25k, 4.9% for AGIs $25k-50k, 5.2% for AGIs $50k-75k, -0.5% for AGIs $75k-100k, 7.3% for AGIs over 100k)
IRA payment deduction: $3,072 (reported on 1.4% of returns)
90015:
$3,072
California:
$3,192
Self-employed pension: $23,067 (reported on 0.3% of returns)
Here:
$23,067
California:
$17,688
Total itemized deductions: $22,505 (26% of AGI, reported on 12.9% of returns)
Here:
$22,505
State:
$28,113
Here:
25.6% of AGI
State:
25.3% of AGI
(% of AGI for various income ranges: 5.8% for AGIs below $10k, 3.5% for AGIs $10k-25k, 8.7% for AGIs $25k-50k, 16.8% for AGIs $50k-75k, 20.8% for AGIs $75k-100k, 17.1% for AGIs over 100k)
Charity contributions deductions: $3,463 (4% of AGI, reported on 10.1% of returns)
Here:
$3,463
State:
$3,923
Here:
3.6% of AGI
State:
3.3% of AGI
(% of AGI for various income ranges: 0.4% for AGIs below $10k, 0.2% for AGIs $10k-25k, 1.1% for AGIs $25k-50k, 1.6% for AGIs $50k-75k, 2.6% for AGIs $75k-100k, 2.4% for AGIs over 100k)
Total tax: $4,588 (reported on 58.6% of returns)
90015:
$4,588
State:
$10,761
(% of AGI for various income ranges: 8.8% for AGIs below $10k, 3.4% for AGIs $10k-25k, 5.8% for AGIs $25k-50k, 9.4% for AGIs $50k-75k, 11.8% for AGIs $75k-100k, 21.4% for AGIs over 100k)
Earned income credit: $1,917 (reported on 37.1% of returns)
Here:
$1,917
State:
$1,763
Percentage of individuals using paid preparers for their 2004 taxes: 78.8%
Here:
79%
State:
66%
(% for various income ranges: 76.4% for AGIs below $10k, 80.5% for AGIs $10k-25k, 79.8% for AGIs $25k-50k, 69.0% for AGIs $50k-75k, 75.9% for AGIs $75k-100k, 85.6% for AGIs over 100k)
Likely homosexual households (counted as self-reported same-sex unmarried-partner households)
Lesbian couples: 0.4% of all households
Gay men: 1.2% of all households
Household received Food Stamps/SNAP in the past 12 months: 2,102 Household did not receive Food Stamps/SNAP in the past 12 months: 11,055
Women who had a birth in the past 12 months: 195 (140 now married, 55 unmarried) Women who did not have a birth in the past 12 months: 7,475 (1,907 now married, 5,612 unmarried)
Housing units in zip code 90015 with a mortgage: 867 (129 second mortgage, 67 both second mortgage and home equity loan) Median monthly owner costs for units with a mortgage: $3,876 Median monthly owner costs for units without a mortgage: $1,556
Residents with income below the poverty level in 2022:
This zip code:
25.7%
Whole state:
12.2%
Residents with income below 50% of the poverty level in 2022:
This zip code:
13.1%
Whole state:
6.2%
Median number of rooms in houses and condos:
Here:
3.0
State:
6.0
Median number of rooms in apartments:
Here:
1.8
State:
3.9
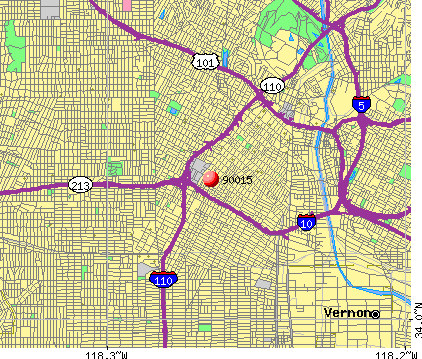
Notable locations in this zip code not listed on our city pages
Notable locations in zip code 90015: Los Angeles Branch Federal Reserve Bank of San Francisco (A), Patriotic Hall (B), Los Angeles Convention Center (C), Olympic Auditorium (D), Catholic Charities Center (E), Bowes Building (F), Herald Examiner Building (G), City of Los Angeles Fire Department Station 10 (H), Staples Center (I). Display/hide their locations on the map
Churches in zip code 90015 include: Metropolitan Community Church (A), Calvary Temple Evangelical Center (B), Center Baptist Church (C), Church of the Immaculate Conception (D), Eleventh Street Baptist Church (E), First Evangelical Free Church (F), First Friends Church (G), Immanuel Christian Assembly Church (H), Saint Lukes Missionary Baptist Church (I). Display/hide their locations on the map
1,431 married couples with children.
1,381 single-parent households (444 men, 937 women).
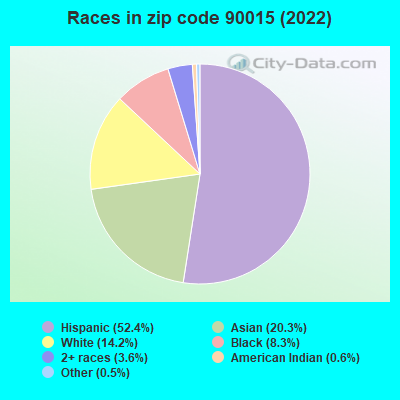
32.6% of residents of 90015 zip code speak English at home.
45.1% of residents speak Spanish at home (55% very well, 12% well, 18% not well, 15% not at all).
3.5% of residents speak other Indo-European language at home (96% very well, 4% well).
17.1% of residents speak Asian or Pacific Island language at home (56% very well, 25% well, 15% not well, 4% not at all).
1.5% of residents speak other language at home (93% very well, 7% well).
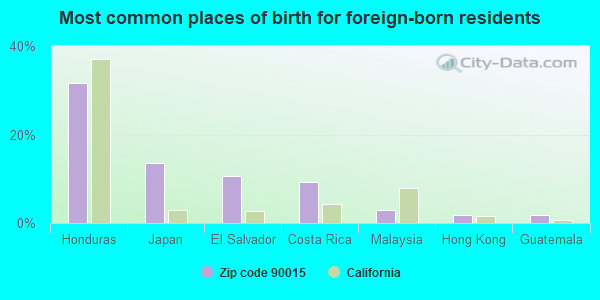
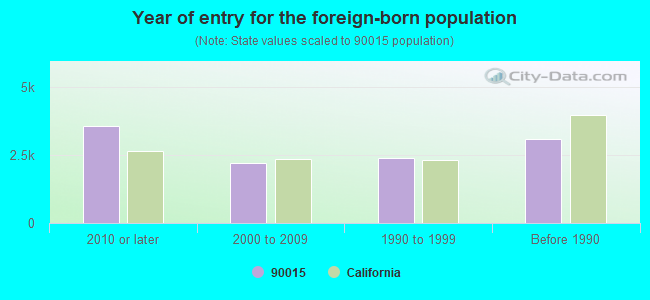
Foreign born population: 10,681 (42.1%) (35.8% of them are naturalized citizens)
Major facilities with environmental interests located in this zip code:
LAUSD-BUSINESS SERVICES DIVISION (1425 S SAN PEDRO ST in LOS ANGELES, CA)
STATE MASTER (California - Hazardous Waste Tracking) - HAZARDOU WASTE PROGRAM HAZARDOUS WASTE BIENNIAL REPORTER (Resource Conservation and Recovery Act (tracking hazardous waste)) Large Quantity Generators, more that 1000 kg of hazardous waste/month (Resource Conservation and Recovery Act (tracking hazardous waste)) Alternative names: LA USD MAINTENANCE AREA 10, LAUSD/BUSINESS SRV DIV
EUREKA LITHOGRAPH INC (1633 W 11TH ST in LOS ANGELES, CA)
STATE MASTER (California - Hazardous Waste Tracking) - HAZARDOU WASTE PROGRAM CRITERIA AND HAZARDOUS AIR POLLUTANT INVENTORY (Inventory of air pollution sources) Small Quantity Generators, between 100 kg and 1000 kg of hazardous waste/month (Resource Conservation and Recovery Act (tracking hazardous waste)) - notification Business SIC classification: COMMERCIAL PRINTING Business NAICS classification: COMMERCIAL LITHOGRAPHIC PRINTING. Organizations: GONNELLA DONALD PRESIDENT (CONTACT/OWNER)
KAISER BROTHERS OLDSMOBILE (1540 S FIGUEROA ST in LOS ANGELES, CA)
STATE MASTER (California - Hazardous Waste Tracking) - HAZARDOU WASTE PROGRAM Small Quantity Generators, between 100 kg and 1000 kg of hazardous waste/month (Resource Conservation and Recovery Act (tracking hazardous waste)) - notification Organizations: COMPANY (CONTACT/OWNER)
CALTRANS (1616 S MAPLE AVE in LOS ANGELES, CA)
STATE MASTER (California - Hazardous Waste Tracking) - HAZARDOU WASTE PROGRAM Small Quantity Generators, between 100 kg and 1000 kg of hazardous waste/month (Resource Conservation and Recovery Act (tracking hazardous waste)) - notification Alternative names: CALTRANS DIST 7/MATERIAL LABS
LAUSD 10TH ST ELEM SCHOOL (1000 GRATTAN ST in LOS ANGELES, CA)
STATE MASTER (California - Hazardous Waste Tracking) - HAZARDOU WASTE PROGRAM Small Quantity Generators, between 100 kg and 1000 kg of hazardous waste/month (Resource Conservation and Recovery Act (tracking hazardous waste)) - notification Alternative names: TENTH STREET ELEMENTARY
ANODIZING IND INC (1817 S HOPE ST in LOS ANGELES, CA)
STATE MASTER (California - Hazardous Waste Tracking) - HAZARDOU WASTE PROGRAM Small Quantity Generators, between 100 kg and 1000 kg of hazardous waste/month (Resource Conservation and Recovery Act (tracking hazardous waste)) Business NAICS classification: ELECTROPLATING, PLATING, POLISHING, ANODIZING, AND COLORING.
LA USD FRIEDMAN OCCUPATIONAL CTR (1646 S OLIVE ST in LOS ANGELES, CA)
STATE MASTER (California - Hazardous Waste Tracking) - HAZARDOU WASTE PROGRAM Small Quantity Generators, between 100 kg and 1000 kg of hazardous waste/month (Resource Conservation and Recovery Act (tracking hazardous waste)) Business NAICS classification: OTHER TECHNICAL AND TRADE SCHOOLS.
CALIF PEDIATRIC & FAMILY MED CTR (1530 S OLIVE in LOS ANGELES, CA)
STATE MASTER (California - Hazardous Waste Tracking) - HAZARDOU WASTE PROGRAM Small Quantity Generators, between 100 kg and 1000 kg of hazardous waste/month (Resource Conservation and Recovery Act (tracking hazardous waste)) Business NAICS classification: ALL OTHER OUTPATIENT CARE CENTERS. Alternative names: DBA EISNER PEDIATRIC & FAMILY MED CENTER
GLOBE AUTO (1358 S FLOWER in LOS ANGELES, CA)
STATE MASTER (California - Hazardous Waste Tracking) - HAZARDOU WASTE PROGRAM Small Quantity Generators, between 100 kg and 1000 kg of hazardous waste/month (Resource Conservation and Recovery Act (tracking hazardous waste)) - notification Business NAICS classification: GENERAL AUTOMOTIVE REPAIR. Organizations: MATT ARDAKANI (CONTACT/OWNER)
Alternative names: GLOBE AUTO BODY INC
CHEVRON STATION NO 96606 (525 W WASHINGTON BLVD in LOS ANGELES, CA)
STATE MASTER (California - Hazardous Waste Tracking) - HAZARDOU WASTE PROGRAM Small Quantity Generators, between 100 kg and 1000 kg of hazardous waste/month (Resource Conservation and Recovery Act (tracking hazardous waste)) - notification Organizations: CHEVRON PRODUCTS CO (CONTACT/OWNER)
CHEVRON STATION 99003 (650 E WASHINGTON BLVD in LOS ANGELES, CA)
STATE MASTER (California - Hazardous Waste Tracking) - HAZARDOU WASTE PROGRAM Small Quantity Generators, between 100 kg and 1000 kg of hazardous waste/month (Resource Conservation and Recovery Act (tracking hazardous waste)) - notification Organizations: CHEVRON PRODUCTS CO (CONTACT/OWNER)
Alternative names: CHEVRON 99003, CHEVRON STATION NO 99003
LA USD BUSINESS SVCS DIV GARAGE (604 E 15TH ST in LOS ANGELES, CA)
STATE MASTER (California - Hazardous Waste Tracking) - HAZARDOU WASTE PROGRAM Small Quantity Generators, between 100 kg and 1000 kg of hazardous waste/month (Resource Conservation and Recovery Act (tracking hazardous waste)) Alternative names: LAUSD/BUSINESS DIVISION GARAGE
LA OPINION DAILY NEWSPAPER (210 E WASHINGTON BLVD in LOS ANGELES, CA)
STATE MASTER (California - Hazardous Waste Tracking) - HAZARDOU WASTE PROGRAM Small Quantity Generators, between 100 kg and 1000 kg of hazardous waste/month (Resource Conservation and Recovery Act (tracking hazardous waste)) - notification
Housing units lacking complete plumbing facilities: 0.9% Housing units lacking complete kitchen facilities: 2.0%
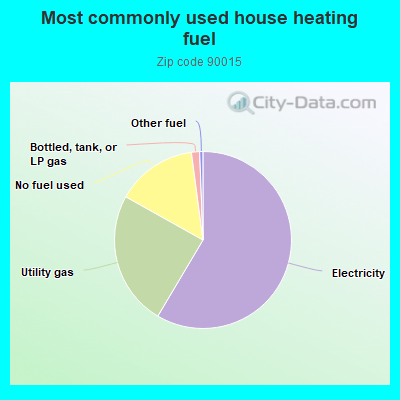
58.6%Electricity
24.6%Utility gas
14.8%No fuel used
1.5%Bottled, tank, or LP gas
0.6%Other fuel
Population in 1990: 18,880.
Place of birth for U.S.-born residents:
This state: 9,822
Northeast: 1,010
Midwest: 658
South: 2,029
West: 725
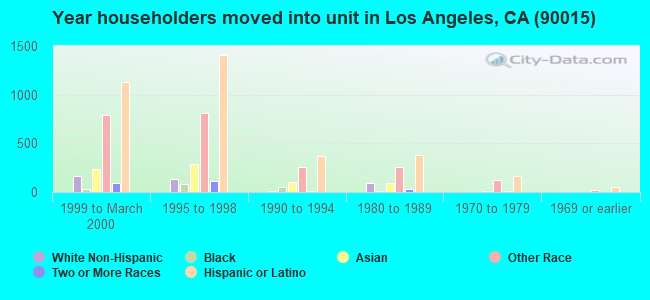
44% of the 90015 zip code residents lived in the same house 5 years ago. Out of people who lived in different houses, 87% lived in this county. Out of people who lived in different counties, 50% lived in California.
75% of the 90015 zip code residents lived in the same house 1 year ago. Out of people who lived in different houses, 61% moved from this county. Out of people who lived in different houses, 9% moved from different county within same state. Out of people who lived in different houses, 18% moved from different state. Out of people who lived in different houses, 9% moved from abroad.
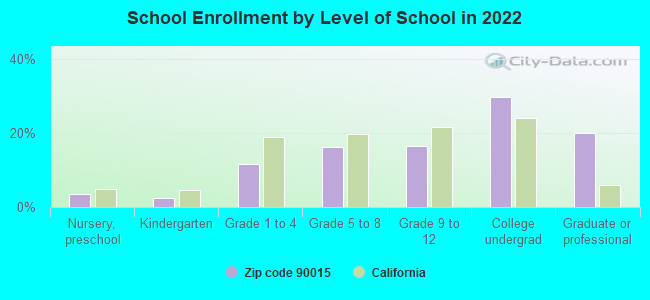
Private vs. public school enrollment:
Students in private schools in grades 1 to 8 (elementary and middle school): 78
Here:
5.0%
California:
10.5%
Students in private schools in grades 9 to 12 (high school): 20
Here:
2.1%
California:
8.5%
Students in private undergraduate colleges: 708
Here:
41.2%
California:
15.9%
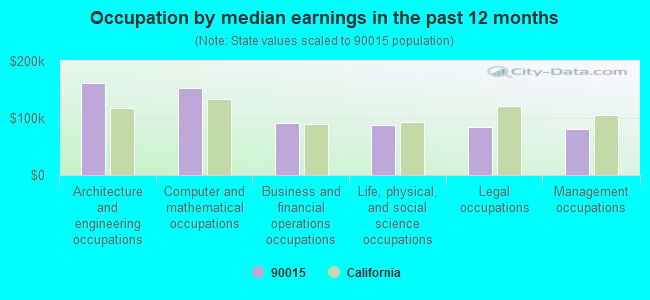
Occupation by median earnings in the past 12 months ($)
161,748Architecture and engineering occupations
152,065Computer and mathematical occupations
91,867Business and financial operations occupations
86,948Life, physical, and social science occupations
84,449Legal occupations
81,537Management occupations
Companies with federal contracts located in this zip code (LOS ANGELES, CA):
KEYSTONE ENGINEERING COMPANY I (1444 S SAN PEDRO ST; small business) : $15,215,766 in 20 contractsfrom 1999 to 2006
Contracts for Antennas, Waveguides, and Related Equipment, Maintenance, Repair and Rebuilding of Equipment -- Aircraft and Airframe Structural Components, Airframe Structural Components, Other Special Studies and Analyses, and moreby Air Force, NASA, Defense Logistics Agency Signed by year:2000: $1,197,547; 2001: $2,293,680; 2002: $1,976,072; 2003: $1,216,492; 2004: $2,432,797; 2005: $1,040,065; 2006: $2,809,113.
Biggest contracts:
$2,250,000 with Air Force for Antennas, Waveguides, and Related Equipment. Signed on 2001-12-10. Completion date: 2002-09-30.
$2,250,000 with Air Force for Maintenance, Repair and Rebuilding of Equipment -- Aircraft and Airframe Structural Components. Signed on 2000-12-22. Completion date: 2001-09-30.
$2,250,000 with Air Force for Airframe Structural Components. Signed on 1999-11-29. Completion date: 2000-09-30.
$1,880,072 with Air Force for Antennas, Waveguides, and Related Equipment. Signed on 2002-12-02. Completion date: 2003-09-30.
CONCORD DOCUMENT SERVICES, INC (350 S FIGUEROA, STE 167; small business) : $194,160 in 17 contractsfrom 2002 to 2006
Contracts for Construction of Structures and Facilities -- Other Conservation and Development Facilities, ADP Optical Scanning Services, Microfilm, Processed, Maintenance, Repair or Alteration of Real Property -- Other Conservation and Development Facilities by Army, National Oceanic and Atmospheric Administration/Under Secretary for Oceans and Atmosphere, U.S. Army Corps of Engineers - civil program financing only Signed by year:2000: $0; 2001: $0; 2002: $172,777; 2003: $0; 2004: $0; 2005: $0; 2006: $21,383.
Biggest contracts:
$71,820 with Army for Construction of Structures and Facilities -- Other Conservation and Development Facilities. Taking place in AZ. Signed on 2002-07-09. Completion date: 2003-10-10.
$23,911, same as above.Signed on 2002-09-30. Completion date: 2003-10-30.
$20,762, same as above.Signed on 2002-03-15. Completion date: 2003-03-17.
$20,167 with National Oceanic and Atmospheric Administration/Under Secretary for Oceans and Atmosphere for ADP Optical Scanning Services. Signed on 2006-05-19. Completion date: 2006-06-30.
GEORGE C KIM (1543 W OLYMPIC BLVD SUIT; small business) : $169,548 in 7 contractsfrom 2002 to 2005
Contracts for Custodial Janitorial Services by Air Force Signed by year:2000: $0; 2001: $0; 2002: $39,987; 2003: $39,987; 2004: $49,252; 2005: $40,322; 2006: $0.
Biggest contracts:
$39,988 with Air Force for Custodial Janitorial Services. Taking place in OH. Signed on 2005-11-14. Completion date: 2006-11-30.
$39,988, same as above.Signed on 2004-11-12. Completion date: 2005-11-30.
$39,987, same as above.Signed on 2003-12-01. Completion date: 2004-11-30.
$39,987, same as above.Signed on 2002-11-18. Completion date: 2003-11-30.
UNIFORMS R US (210 E OLYMPIC BLVD SUITE 2; small business) : $80,906 in 11 contractsfrom 2002 to 2006
Contracts for Clothing, Special Purpose, Outerwear, Men's, Sets, Kits, Outfits, and Modules, Food Preparation and Serving by Air Force, Navy, Army Signed by year:2000: $0; 2001: $0; 2002: $2,519; 2003: $4,950; 2004: $13,900; 2005: $54,808; 2006: $4,729.
Biggest contracts:
$36,568 with Air Force for Clothing, Special Purpose. Signed on 2005-03-10. Completion date: 2005-04-07.
$9,290 with Navy for Outerwear, Men's. Signed on 2004-05-06. Completion date: 2004-06-04.
$8,977 with Air Force for Sets, Kits, Outfits, and Modules, Food Preparation and Serving. Signed on 2005-09-28. Completion date: 2005-10-31.
$4,950 with Army for Outerwear, Men's. Taking place in MS. Signed on 2003-09-22. Completion date: 2003-10-22.
CENTURY SPRING CORP (222 E 16TH STREET; small business) : $15,050 in 3 contractsfrom 2005 to 2006
$12,450 with Army for Ammunition, 75 mm through 125 mm. Signed on 2005-09-07. Completion date: 2005-10-07.
$1,950, same as above.Signed on 2005-09-30. Completion date: 2005-10-07.
$650, same as above.Signed on 2006-01-11. Completion date: 2006-01-31.
JH DESIGN GROUP INC (940 WEST WASHINGTON BLVD; small business)
$7,560 with Army for Clothing, Special Purpose. Signed on 2003-07-01. Completion date: 2003-07-31.
ARMSTRONG FAMILY MORTUARY (931 VENICE BLVD; small business)
$1,040 with Bureau of Prisoners/Federal Prison System for Memorials: Cemeterial and Mortuary Equipment and Supplies. Signed on 2005-02-18. Completion date: 2005-02-18.
Top industries in this zip code by the number of employees in 2005:
2005 - 2018 National Fire Incident Reporting System (NFIRS) incidents
According to the data from the years 2005 - 2018 the average number of fires per year is 121. The highest number of fire incidents - 389 took place in 2018, and the least - 63 in 2010. The data has an increasing trend.
When looking into fire subcategories, the most incidents belonged to: Outside Fires (43.4%), and Structure Fires (36.6%).
Fire incident types reported to NFIRS in Zip Code 90015


 Nearest zip codes: 90079, 90017, 90014, 90071, 90007, 90057.


 According to the data from the years 2005 - 2018 the average number of fires per year is 121. The highest number of fire incidents - 389 took place in 2018, and the least - 63 in 2010. The data has an increasing trend.
 When looking into fire subcategories, the most incidents belonged to: Outside Fires (43.4%), and Structure Fires (36.6%).