Estimated zip code population in 2022: 46,750 Zip code population in 2010: 44,998 Zip code population in 2000: 43,986
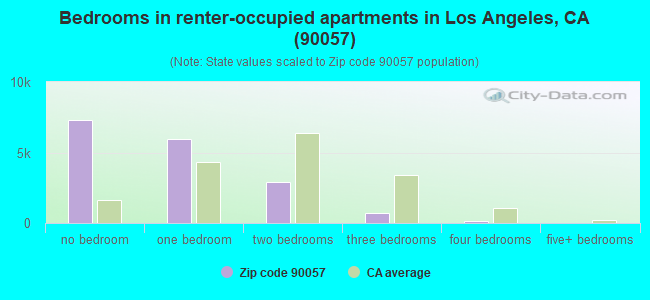
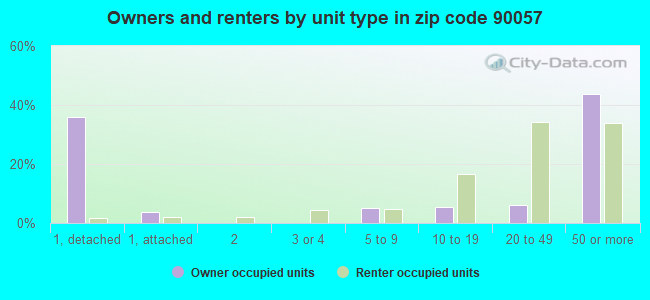
Houses and condos: 18,341 Renter-occupied apartments: 16,688
% of renters here:
97%
State:
44%
March 2022 cost of living index in zip code 90057: 142.7 (very high, U.S. average is 100)
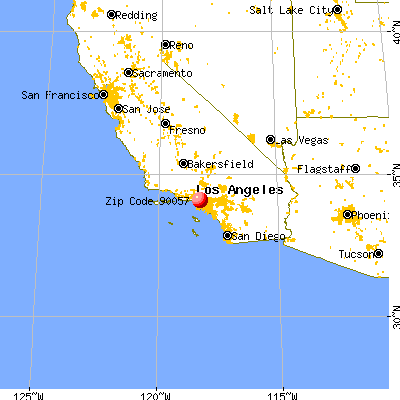
Land area: 0.9 sq. mi. Water area: 0.0 sq. mi.
Population density: 52,789 people per square mile
(very high).
OSM Map
General Map
Google Map
MSN Map
OSM Map
General Map
Google Map
MSN Map
OSM Map
General Map
Google Map
MSN Map
OSM Map
General Map
Google Map
MSN Map
Please wait while loading the map...
Real estate property taxes paid for housing units in 2022:
This zip code:
0.7% ($5,088)
California:
0.7% ($4,831)
Median real estate property taxes paid for housing units with mortgages in 2022: $5,826 (0.8%) Median real estate property taxes paid for housing units with no mortgage in 2022: $3,154 (0.6%)
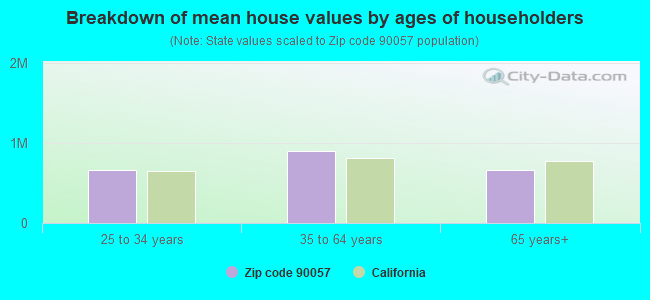
Estimated median house/condo value in 2022: $678,655
90057:
$678,655
California:
$715,900
According to our research of California and other state lists, there were 71 registered sex offenders living in 90057 zip code as of April 27, 2024. The ratio of all residents to sex offenders in zip code 90057 is 690 to 1. The ratio of registered sex offenders to all residents in this zip code is near the state average.
Median resident age:
This zip code:
34.8 years
California median age:
37.9 years
Average household size:
This zip code:
2.6 people
California:
2.8 people
Averages for the 2020 tax year for zip code 90057, filed in 2021:
Average Adjusted Gross Income (AGI) in 2020: $32,701 (Individual Income Tax Returns)
Here:
$32,701
State:
$95,910
Salary/wage: $32,595 (reported on 78.8% of returns)
Here:
$32,595
State:
$77,331
(% of AGI for various income ranges: 1347.3% for AGIs below $25k, 4417.7% for AGIs $25k-50k, 7838.6% for AGIs $50k-75k, 11614.5% for AGIs $75k-100k, 18393.8% for AGIs $100k-200k)
Taxable interest for individuals: $887 (reported on 9.7% of returns)
This zip code:
$887
California:
$2,294
(% of AGI for various income ranges: 4.2% for AGIs below $25k, 8.4% for AGIs $25k-50k, 22.8% for AGIs $50k-75k, 22.4% for AGIs $75k-100k, 174.7% for AGIs $100k-200k)
Ordinary dividends: $1,412 (reported on 4.7% of returns)
Here:
$1,412
State:
$10,949
(% of AGI for various income ranges: 3.1% for AGIs below $25k, 2.2% for AGIs $25k-50k, 10.8% for AGIs $50k-75k, 12.6% for AGIs $75k-100k, 54.1% for AGIs $100k-200k)
Net capital gain/loss in AGI: +$4,339 (reported on 5.9% of returns)
Here:
+$4,339
State:
+$49,306
(% of AGI for various income ranges: 2.1% for AGIs below $25k, 6.4% for AGIs $25k-50k, 31.7% for AGIs $50k-75k, 100.2% for AGIs $75k-100k, 342.8% for AGIs $100k-200k)
Profit/loss from business: +$6,562 (reported on 27.5% of returns)
Here:
+$6,562
State:
+$15,671
(% of AGI for various income ranges: 416.7% for AGIs below $25k, 155.6% for AGIs $25k-50k, 212.2% for AGIs $50k-75k, 184.8% for AGIs $75k-100k, 650.6% for AGIs $100k-200k)
Taxable individual retirement arrangement distribution: $10,800 (reported on 1.0% of returns)
90057:
$10,800
California:
$23,505
(% of AGI for various income ranges: 5.8% for AGIs below $25k, 11.6% for AGIs $25k-50k, 36.3% for AGIs $50k-75k, 220.0% for AGIs $100k-200k)
Total itemized deductions: $28,365 (reported on 2.3% of returns)
Here:
$28,365
State:
$39,517
(% of AGI for various income ranges: 11.9% for AGIs below $25k, 76.1% for AGIs $25k-50k, 131.7% for AGIs $50k-75k, 303.3% for AGIs $75k-100k, 1046.6% for AGIs $100k-200k)
Charity contributions: $9,376 (reported on 1.9% of returns)
Here:
$9,376
State:
$12,598
(% of AGI for various income ranges: 1.4% for AGIs below $25k, 24.7% for AGIs $25k-50k, 29.7% for AGIs $50k-75k, 52.6% for AGIs $75k-100k, 280.3% for AGIs $100k-200k)
Taxes paid: $6,802 (reported on 2.3% of returns)
90057:
$6,802
State:
$8,807
(% of AGI for various income ranges: 2.4% for AGIs below $25k, 15.7% for AGIs $25k-50k, 31.6% for AGIs $50k-75k, 92.6% for AGIs $75k-100k, 310.9% for AGIs $100k-200k)
Earned income credit: $1,960 (reported on 21.7% of returns)
Here:
$1,960
State:
$2,074
(% of AGI for various income ranges: 103.9% for AGIs below $25k, 63.5% for AGIs $25k-50k, 1.0% for AGIs $50k-75k)
Percentage of individuals using paid preparers for their 2020 taxes: 87.9%
Here:
88%
State:
92%
(% for various income ranges: 84.1% for AGIs below $25k, 90.5% for AGIs $25k-50k, 93.3% for AGIs $50k-75k, 95.3% for AGIs $75k-100k, 92.6% for AGIs $100k-200k, 100.0% for AGIs over 200k)
Averages for the 2012 tax year for zip code 90057, filed in 2013:
Average Adjusted Gross Income (AGI) in 2012: $25,021 (Individual Income Tax Returns)
Here:
$25,021
State:
$72,726
Salary/wage: $25,916 (reported on 81.5% of returns)
Here:
$25,916
State:
$59,079
(% of AGI for various income ranges: 77.3% for AGIs below $25k, 92.2% for AGIs $25k-50k, 89.6% for AGIs $50k-75k, 88.9% for AGIs $75k-100k, 98.4% for AGIs $100k-200k)
Taxable interest for individuals: $614 (reported on 9.7% of returns)
This zip code:
$614
California:
$2,146
(% of AGI for various income ranges: 0.2% for AGIs below $25k, 0.2% for AGIs $25k-50k, 0.4% for AGIs $50k-75k, 0.4% for AGIs $75k-100k, 0.6% for AGIs $100k-200k)
Ordinary dividends: $1,542 (reported on 2.3% of returns)
Here:
$1,542
State:
$9,308
(% of AGI for various income ranges: 0.2% for AGIs below $25k, 0.1% for AGIs $25k-50k, 0.2% for AGIs $75k-100k, 0.2% for AGIs $100k-200k)
Net capital gain/loss in AGI: +$1,220 (reported on 2.1% of returns)
Here:
+$1,220
State:
+$30,460
(% of AGI for various income ranges: 1.7% for AGIs $100k-200k)
Profit/loss from business: +$8,598 (reported on 24.1% of returns)
Here:
+$8,598
State:
+$17,064
(% of AGI for various income ranges: 18.7% for AGIs below $25k, 3.8% for AGIs $25k-50k, 2.4% for AGIs $50k-75k, 3.1% for AGIs $75k-100k, 1.7% for AGIs $100k-200k)
Taxable individual retirement arrangement distribution: $8,431 (reported on 1.1% of returns)
90057:
$8,431
California:
$19,557
(% of AGI for various income ranges: 0.2% for AGIs below $25k, 0.4% for AGIs $25k-50k, 1.1% for AGIs $50k-75k)
Total itemized deductions: $19,225 (29% of AGI, reported on 8.0% of returns)
Here:
$19,225
State:
$34,004
Here:
28.7% of AGI
State:
22.7% of AGI
(% of AGI for various income ranges: 1.8% for AGIs below $25k, 5.0% for AGIs $25k-50k, 7.7% for AGIs $50k-75k, 11.5% for AGIs $75k-100k, 16.8% for AGIs $100k-200k, 22.2% for AGIs over 200k)
Charity contributions: $2,994 (reported on 5.9% of returns)
Here:
$2,994
State:
$4,659
(% of AGI for various income ranges: 0.1% for AGIs below $25k, 0.6% for AGIs $25k-50k, 1.1% for AGIs $50k-75k, 1.8% for AGIs $75k-100k, 2.4% for AGIs $100k-200k)
Taxes paid: $5,261 (reported on 7.8% of returns)
90057:
$5,261
State:
$14,448
(% of AGI for various income ranges: 0.4% for AGIs below $25k, 0.8% for AGIs $25k-50k, 2.0% for AGIs $50k-75k, 3.8% for AGIs $75k-100k, 6.0% for AGIs $100k-200k, 8.9% for AGIs over 200k)
Earned income credit: $2,305 (reported on 31.6% of returns)
Here:
$2,305
State:
$2,286
(% of AGI for various income ranges: 7.2% for AGIs below $25k, 1.4% for AGIs $25k-50k)
Percentage of individuals using paid preparers for their 2012 taxes: 75.8%
Here:
76%
State:
64%
(% for various income ranges: 76.8% for AGIs below $25k, 75.2% for AGIs $25k-50k, 69.2% for AGIs $50k-75k, 70.4% for AGIs $75k-100k, 71.4% for AGIs $100k-200k, 100.0% for AGIs over 200k)
Averages for the 2004 tax year for zip code 90057, filed in 2005:
Average Adjusted Gross Income (AGI) in 2004: $21,721 (Individual Income Tax Returns)
Here:
$21,721
State:
$58,600
Salary/wage: $22,523 (reported on 83.3% of returns)
Here:
$22,523
State:
$49,455
(% of AGI for various income ranges: 71.7% for AGIs below $10k, 86.8% for AGIs $10k-25k, 93.5% for AGIs $25k-50k, 89.6% for AGIs $50k-75k, 80.2% for AGIs $75k-100k, 60.2% for AGIs over 100k)
Taxable interest for individuals: $749 (reported on 14.9% of returns)
This zip code:
$749
California:
$2,365
(% of AGI for various income ranges: 0.8% for AGIs below $10k, 0.4% for AGIs $10k-25k, 0.4% for AGIs $25k-50k, 0.5% for AGIs $50k-75k, 1.7% for AGIs $75k-100k, 0.7% for AGIs over 100k)
Taxable dividends: $2,135 (reported on 3.3% of returns)
Here:
$2,135
State:
$4,746
(% of AGI for various income ranges: 0.4% for AGIs below $10k, 0.2% for AGIs $10k-25k, 0.2% for AGIs $25k-50k, 0.5% for AGIs $50k-75k, 0.9% for AGIs $75k-100k, 1.0% for AGIs over 100k)
Net capital gain/loss: +$3,348 (reported on 3.3% of returns)
Here:
+$3,348
State:
+$23,418
(% of AGI for various income ranges: -0.4% for AGIs below $10k, -0.0% for AGIs $10k-25k, -0.0% for AGIs $25k-50k, 0.1% for AGIs $50k-75k, 1.8% for AGIs $75k-100k, 6.8% for AGIs over 100k)
Profit/loss from business: +$7,528 (reported on 22.3% of returns)
Here:
+$7,528
State:
+$16,826
(% of AGI for various income ranges: 34.4% for AGIs below $10k, 10.2% for AGIs $10k-25k, 2.8% for AGIs $25k-50k, 1.9% for AGIs $50k-75k, 4.0% for AGIs $75k-100k, 8.9% for AGIs over 100k)
IRA payment deduction: $2,068 (reported on 1.4% of returns)
90057:
$2,068
California:
$3,192
(% of AGI for various income ranges: 0.1% for AGIs $10k-25k, 0.1% for AGIs $25k-50k, 0.2% for AGIs $50k-75k, 0.4% for AGIs $75k-100k)
Total itemized deductions: $17,097 (33% of AGI, reported on 9.8% of returns)
Here:
$17,097
State:
$28,113
Here:
33.2% of AGI
State:
25.3% of AGI
(% of AGI for various income ranges: 2.8% for AGIs below $10k, 3.0% for AGIs $10k-25k, 6.9% for AGIs $25k-50k, 13.3% for AGIs $50k-75k, 17.9% for AGIs $75k-100k, 22.0% for AGIs over 100k)
Charity contributions deductions: $2,992 (6% of AGI, reported on 7.9% of returns)
Here:
$2,992
State:
$3,923
Here:
5.6% of AGI
State:
3.3% of AGI
(% of AGI for various income ranges: 0.1% for AGIs below $10k, 0.3% for AGIs $10k-25k, 1.1% for AGIs $25k-50k, 2.1% for AGIs $50k-75k, 3.1% for AGIs $75k-100k, 2.5% for AGIs over 100k)
Total tax: $2,291 (reported on 60.7% of returns)
90057:
$2,291
State:
$10,761
(% of AGI for various income ranges: 6.1% for AGIs below $10k, 3.6% for AGIs $10k-25k, 5.6% for AGIs $25k-50k, 9.4% for AGIs $50k-75k, 11.4% for AGIs $75k-100k, 15.8% for AGIs over 100k)
Earned income credit: $1,870 (reported on 38.3% of returns)
Here:
$1,870
State:
$1,763
Percentage of individuals using paid preparers for their 2004 taxes: 78.0%
Here:
78%
State:
66%
(% for various income ranges: 76.1% for AGIs below $10k, 80.2% for AGIs $10k-25k, 76.6% for AGIs $25k-50k, 75.6% for AGIs $50k-75k, 79.1% for AGIs $75k-100k, 66.7% for AGIs over 100k)
Likely homosexual households (counted as self-reported same-sex unmarried-partner households)
Lesbian couples: 0.2% of all households
Gay men: 0.1% of all households
Household received Food Stamps/SNAP in the past 12 months: 4,674 Household did not receive Food Stamps/SNAP in the past 12 months: 13,137
Women who had a birth in the past 12 months: 543 (236 now married, 309 unmarried) Women who did not have a birth in the past 12 months: 10,677 (3,069 now married, 7,656 unmarried)
Housing units in zip code 90057 with a mortgage: 370 (24 second mortgage, 8 both second mortgage and home equity loan) Houses without a mortgage: 17
Median monthly owner costs for units with a mortgage: $2,669 Median monthly owner costs for units without a mortgage: $793
Residents with income below the poverty level in 2022:
This zip code:
27.7%
Whole state:
12.2%
Residents with income below 50% of the poverty level in 2022:
This zip code:
15.3%
Whole state:
6.2%
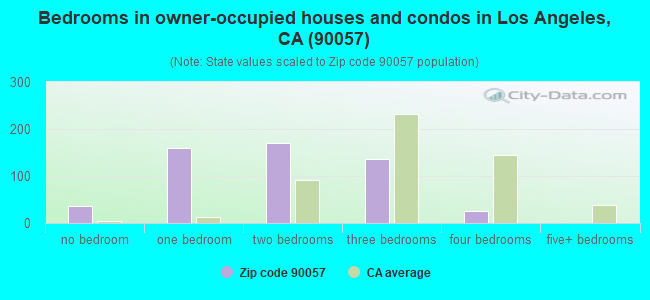
Median number of rooms in houses and condos:
Here:
3.4
State:
6.0
Median number of rooms in apartments:
Here:
2.5
State:
3.9
Notable locations in this zip code not listed on our city pages
Notable locations in zip code 90057: Wilshire Terrace Professional Center (A), Thorpe Building (B), Hite Building (C), Felipe De Neve Branch Los Angeles Public Library (D), Granada Building (E), City of Los Angeles Fire Department Station 11 (F). Display/hide their locations on the map
Churches in zip code 90057 include: Church of the Precious Blood (A), Saint Nicholas Orthodox Cathedral (B), Holy Superet Light Church (C). Display/hide their locations on the map
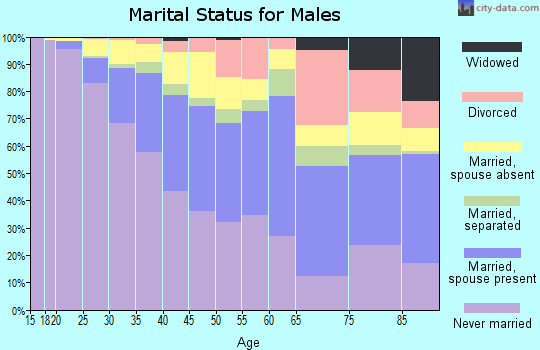
4,171 married couples with children.
4,427 single-parent households (2,055 men, 2,372 women).
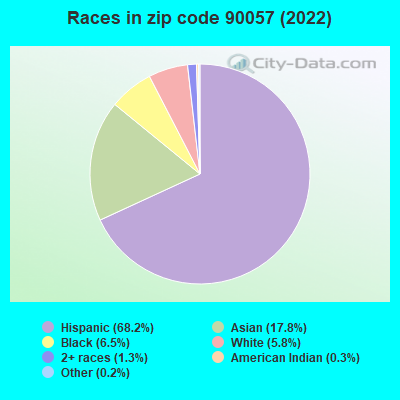
19.2% of residents of 90057 zip code speak English at home.
62.9% of residents speak Spanish at home (39% very well, 13% well, 23% not well, 25% not at all).
0.9% of residents speak other Indo-European language at home (73% very well, 27% well).
15.9% of residents speak Asian or Pacific Island language at home (41% very well, 21% well, 28% not well, 10% not at all).
1.6% of residents speak other language at home (28% very well, 12% well, 21% not well, 38% not at all).
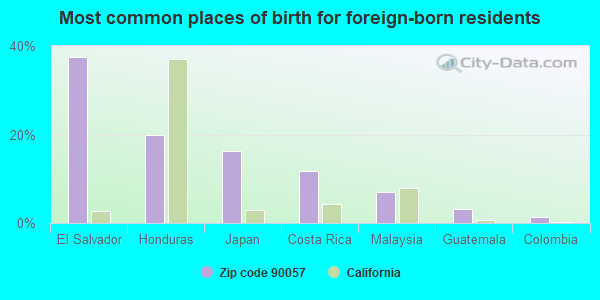
Foreign born population: 25,859 (55.3%) (29.3% of them are naturalized citizens)
Major facilities with environmental interests located in this zip code:
CASA DE CLEANERS (2604 WEST THIRD ST in LOS ANGELES, CA)
STATE MASTER (California - Hazardous Waste Tracking) - HAZARDOU WASTE PROGRAM Small Quantity Generators, between 100 kg and 1000 kg of hazardous waste/month (Resource Conservation and Recovery Act (tracking hazardous waste))
LAFAYETTE PARK PRIMARY CENTER (310 S. LAFAYETTE PARK PLACE in LOS ANGELES, CA)
(National Center for Education Statistics) - STATE ID-6119093 Organizations: LOS ANGELES UNIFIED (SCHOOL DISTRICT)
MACARTHUR PARK PRIMARY CENTER (2300 W. 7TH STREET in LOS ANGELES, CA)
(National Center for Education Statistics) - STATE ID-6120810 Organizations: LOS ANGELES UNIFIED (SCHOOL DISTRICT)
CAMINO NUEVO CHARTER ACADEMY (697 S. BURLINGTON AVE. in LOS ANGELES, CA)
(National Center for Education Statistics) - STATE ID-6117667 Organizations: LOS ANGELES UNIFIED (SCHOOL DISTRICT)
HOUSE EAR INSTITUTE (256 S LAKE ST in LOS ANGELES, CA)
(Resource Conservation and Recovery Act (tracking hazardous waste))
LA BEST CLEANERS (610 S RAMPART BLVD in LOS ANGELES, CA)
Small Quantity Generators, between 100 kg and 1000 kg of hazardous waste/month (Resource Conservation and Recovery Act (tracking hazardous waste)) - notification Small Quantity Generators, between 100 kg and 1000 kg of hazardous waste/month (Resource Conservation and Recovery Act (tracking hazardous waste)) - notification Organizations: MOON YONG YOON (CONTACT/OWNER)
, JI KYU RYONG (CONTACT/OWNER)
HOME SAVINGS OF AMERICA (722 S BONNIE BRAE ST in LOS ANGELES, CA)
(Resource Conservation and Recovery Act (tracking hazardous waste))
APOLLO MAGNETICS (2720 W BEVERLY BLVD in LOS ANGELES, CA)
Small Quantity Generators, between 100 kg and 1000 kg of hazardous waste/month (Resource Conservation and Recovery Act (tracking hazardous waste)) Organizations: BEVERLY BLVD ASSO LTD (CONTACT/OWNER)
KONICA BUSINESS MACHINES USA (2828 BEVERLY BLVD in LOS ANGELES, CA)
Small Quantity Generators, between 100 kg and 1000 kg of hazardous waste/month (Resource Conservation and Recovery Act (tracking hazardous waste)) - notification Organizations: KONISHIROKU PHOTO IND (CONTACT/OWNER)
LA ALARM POLICE SIGNAL BUREAU (2228 W 6TH ST in LOS ANGELES, CA)
Small Quantity Generators, between 100 kg and 1000 kg of hazardous waste/month (Resource Conservation and Recovery Act (tracking hazardous waste)) - notification Organizations: CITY OF LOS ANGELES (CONTACT/OWNER)
LA FELIPE DE NEVE LIBRARY (2820 W 6TH ST in LOS ANGELES, CA)
Small Quantity Generators, between 100 kg and 1000 kg of hazardous waste/month (Resource Conservation and Recovery Act (tracking hazardous waste)) - notification Organizations: CITY OF LOS ANGELES (CONTACT/OWNER)
LA PARKVIEW PHOTO CENTER (412 S PARKVIEW ST in LOS ANGELES, CA)
Small Quantity Generators, between 100 kg and 1000 kg of hazardous waste/month (Resource Conservation and Recovery Act (tracking hazardous waste)) - notification Organizations: CITY OF LOS ANGELES (CONTACT/OWNER)
LA ST BARNABUS CENTER (675 S CARONDELT ST in LOS ANGELES, CA)
Small Quantity Generators, between 100 kg and 1000 kg of hazardous waste/month (Resource Conservation and Recovery Act (tracking hazardous waste)) - notification Organizations: CITY OF LOS ANGELES (CONTACT/OWNER)
Housing units lacking complete plumbing facilities: 0.7% Housing units lacking complete kitchen facilities: 5.8%
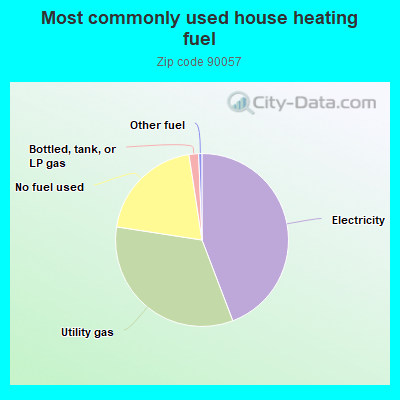
42.5%Electricity
31.6%Utility gas
23.2%No fuel used
1.6%Bottled, tank, or LP gas
0.6%Other fuel
Population in 1990: 39,017. Population change in the 1990s: +4,969 (+12.7%).
Place of birth for U.S.-born residents:
This state: 17,202
Northeast: 978
Midwest: 852
South: 1,107
West: 439
41% of the 90057 zip code residents lived in the same house 5 years ago. Out of people who lived in different houses, 90% lived in this county. Out of people who lived in different counties, 50% lived in California.
90% of the 90057 zip code residents lived in the same house 1 year ago. Out of people who lived in different houses, 73% moved from this county. Out of people who lived in different houses, 6% moved from different county within same state. Out of people who lived in different houses, 13% moved from different state. Out of people who lived in different houses, 8% moved from abroad.
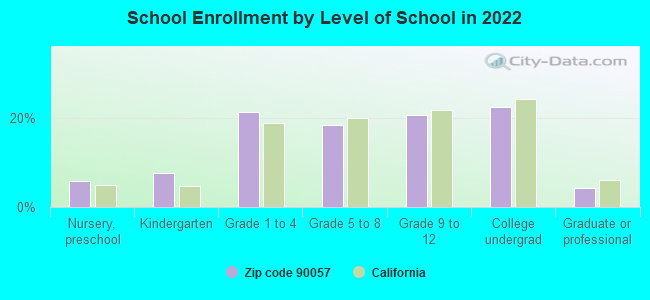
Private vs. public school enrollment:
Students in private schools in grades 1 to 8 (elementary and middle school): 187
Here:
4.6%
California:
10.5%
Students in private schools in grades 9 to 12 (high school): 95
Here:
4.5%
California:
8.5%
Students in private undergraduate colleges: 340
Here:
14.5%
California:
15.9%
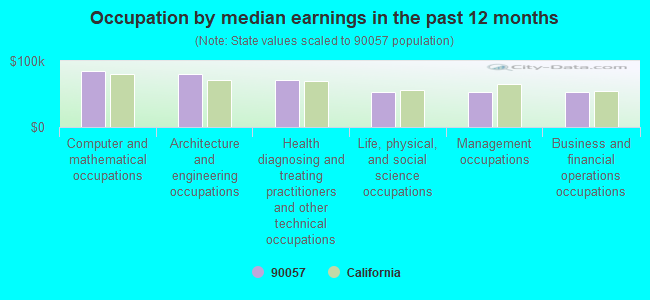
Occupation by median earnings in the past 12 months ($)
85,013Computer and mathematical occupations
80,463Architecture and engineering occupations
71,350Health diagnosing and treating practitioners and other technical occupations
53,697Life, physical, and social science occupations
53,413Management occupations
52,883Business and financial operations occupations
Companies with federal contracts located in this zip code:
MACKONE DEVELOPMENT INC (2244 BEVERLY BLVD in LOS ANGELES, CA; small business) : $6,515,088 in 63 contractsfrom 2000 to 2004
Contracts for Construction of Structures and Facilities -- Other Administrative Facilities and Service Buildings, Maintenance, Repair or Alteration of Real Property -- Other Administrative Facilities and Service Buildings, Maintenance, Repair or Alteration of Real Property -- Miscellaneous Buildings, Maintenance, Repair or Alteration of Real Property -- Airport Runways by Navy, Air Force Signed by year:2000: $1,899,330; 2001: $3,077,683; 2002: $737,608; 2003: $811,526; 2004: -$11,059; 2005: $0; 2006: $0.
Biggest contracts:
$1,542,400 with Navy for Construction of Structures and Facilities -- Other Administrative Facilities and Service Buildings. Signed on 2001-03-15. Completion date: 2001-10-31.
$1,013,171, same as above.Signed on 2000-10-01. Completion date: 2001-11-28.
$879,500, same as above.Signed on 2001-09-27. Completion date: 2002-02-08.
$418,946, same as above.Signed on 2000-09-29. Completion date: 2001-04-12.
MAGIC RAM INC (1850 BEVERLY BLVD in LOS ANGELES, CA; small business) : $121,566 in 4 contractsfrom 2004 to 2006
$66,144 with Navy for ADP Components. Signed on 2006-02-02. Completion date: 2006-03-03.
$34,544, same as above.Signed on 2004-11-24. Completion date: 2004-12-15.
$19,800 with Navy for ADP Input/Output and Storage Devices. Signed on 2004-04-19. Completion date: 2004-05-17.
$1,078 with Army for ADP Input/Output and Storage Devices. Signed on 2005-06-22. Completion date: 2005-09-19.
FIRST CALL OFFICE SOLUTIONS, I (2534 W 7TH STREET in LOS ANGELES, CA; small business)
$12,435 with Army for ADP Supplies. Taking place in AZ. Signed on 2003-07-25. Completion date: 2003-08-23.
Top industries in this zip code by the number of employees in 2005:
Health Care and Social Assistance: General Medical and Surgical Hospitals (over 1000 employees: 1 establishment)
Health Care and Social Assistance: Offices of Physicians (except Mental Health Specialists) (100-249: 2, 50-99: 2, 20-49: 5, 10-19: 5, 5-9: 23, 1-4: 81)
Health Care and Social Assistance: Nursing Care Facilities (100-249: 3, 50-99: 3, 20-49: 2)
Administrative and Support and Waste Management and Remediation Services: Janitorial Services (500-999: 1, 5-9: 1, 1-4: 1)
Professional, Scientific, and Technical Services: Research and Development in the Physical, Engineering, and Life Sciences (100-249: 1, 50-99: 1, 10-19: 1, 5-9: 1)
Health Care and Social Assistance: Offices of Dentists (20-49: 2, 10-19: 4, 5-9: 8, 1-4: 22)
Health Care and Social Assistance: Services for the Elderly and Persons with Disabilities (100-249: 1, 10-19: 2, 1-4: 1)
People in group quarters in 2010:
776 people in nursing facilities/skilled-nursing facilities
138 people in other noninstitutional facilities
43 people in residential treatment centers for adults
14 people in group homes intended for adults
13 people in emergency and transitional shelters (with sleeping facilities) for people experiencing homelessness
People in group quarters in 2000:
738 people in nursing homes
320 people in other noninstitutional group quarters
146 people in hospitals/wards and hospices for chronically ill
146 people in other hospitals or wards for chronically ill
106 people in homes or halfway houses for drug/alcohol abuse
24 people in other group homes
16 people in religious group quarters
Fatal accident statistics in 2014:
Fatal accident count: 2
Vehicles involved in fatal accidents: 2
Fatal accidents caused by drunken drivers: 0
Fatalities: 2
Persons involved in fatal accidents: 2
Pedestrians involved in fatal accidents: 2
Fatal accident statistics in 2012:
Fatal accident count: 2
Vehicles involved in fatal accidents: 3
Fatal accidents caused by drunken drivers: 0
Fatalities: 2
Persons involved in fatal accidents: 4
Pedestrians involved in fatal accidents: 1
Home Mortgage Disclosure Act Aggregated Statistics For Year 2009 (Based on 8 full and 14 partial tracts)
A) FHA, FSA/RHS & VA Home Purchase Loans
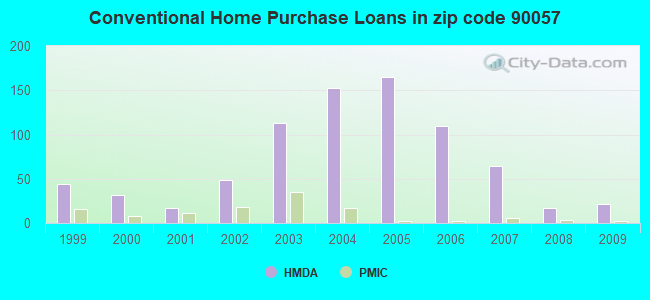
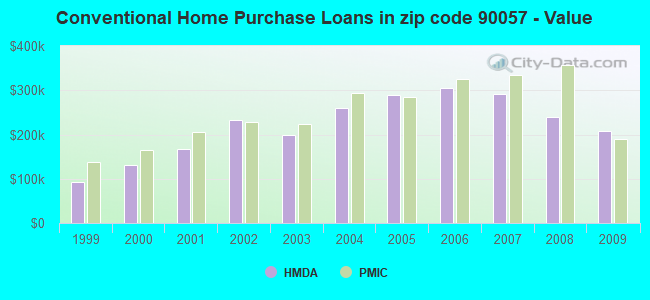
B) Conventional Home Purchase Loans
C) Refinancings
D) Home Improvement Loans
E) Loans on Dwellings For 5+ Families
F) Non-occupant Loans on < 5 Family Dwellings (A B C & D)
Number
Average Value
Number
Average Value
Number
Average Value
Number
Average Value
Number
Average Value
Number
Average Value
LOANS ORIGINATED
15
$253,909
21
$208,911
41
$254,152
0
$0
13
$1,315,030
12
$172,754
APPLICATIONS APPROVED, NOT ACCEPTED
1
$246,400
4
$189,752
10
$328,499
0
$0
4
$2,220,300
4
$247,495
APPLICATIONS DENIED
8
$294,466
9
$207,030
42
$278,620
9
$123,176
5
$1,502,606
11
$216,207
APPLICATIONS WITHDRAWN
4
$293,320
5
$207,132
9
$208,633
1
$346,560
4
$2,530,352
3
$239,860
FILES CLOSED FOR INCOMPLETENESS
0
$0
2
$261,705
6
$270,505
1
$60,740
0
$0
0
$0
Aggregated Statistics For Year 2008 (Based on 9 full and 14 partial tracts)
A) FHA, FSA/RHS & VA Home Purchase Loans
B) Conventional Home Purchase Loans
C) Refinancings
D) Home Improvement Loans
E) Loans on Dwellings For 5+ Families
F) Non-occupant Loans on < 5 Family Dwellings (A B C & D)
G) Loans On Manufactured Home Dwelling (A B C & D)
Number
Average Value
Number
Average Value
Number
Average Value
Number
Average Value
Number
Average Value
Number
Average Value
Number
Average Value
LOANS ORIGINATED
4
$233,800
17
$240,293
52
$328,931
4
$168,762
35
$1,809,553
8
$335,096
2
$58,705
APPLICATIONS APPROVED, NOT ACCEPTED
1
$298,010
3
$211,880
18
$311,366
1
$292,590
3
$3,420,227
0
$0
0
$0
APPLICATIONS DENIED
0
$0
17
$441,712
59
$318,502
11
$183,445
14
$2,733,534
12
$329,716
0
$0
APPLICATIONS WITHDRAWN
1
$217,000
7
$246,434
23
$362,426
5
$247,200
2
$462,965
2
$403,620
0
$0
FILES CLOSED FOR INCOMPLETENESS
0
$0
1
$168,000
11
$332,078
1
$422,630
0
$0
4
$413,698
0
$0
Aggregated Statistics For Year 2007 (Based on 9 full and 14 partial tracts)
A) FHA, FSA/RHS & VA Home Purchase Loans
B) Conventional Home Purchase Loans
C) Refinancings
D) Home Improvement Loans
E) Loans on Dwellings For 5+ Families
F) Non-occupant Loans on < 5 Family Dwellings (A B C & D)
Number
Average Value
Number
Average Value
Number
Average Value
Number
Average Value
Number
Average Value
Number
Average Value
LOANS ORIGINATED
0
$0
64
$291,762
113
$387,347
11
$145,679
81
$2,516,949
25
$444,137
APPLICATIONS APPROVED, NOT ACCEPTED
1
$321,600
15
$377,019
41
$384,435
10
$249,137
0
$0
8
$383,285
APPLICATIONS DENIED
0
$0
45
$434,602
149
$450,265
36
$285,052
10
$5,345,224
23
$554,203
APPLICATIONS WITHDRAWN
0
$0
14
$320,625
42
$396,740
6
$279,530
3
$1,641,567
7
$526,129
FILES CLOSED FOR INCOMPLETENESS
0
$0
5
$348,626
22
$372,905
5
$157,926
5
$1,159,932
6
$263,702
Aggregated Statistics For Year 2006 (Based on 9 full and 14 partial tracts)
B) Conventional Home Purchase Loans
C) Refinancings
D) Home Improvement Loans
E) Loans on Dwellings For 5+ Families
F) Non-occupant Loans on < 5 Family Dwellings (A B C & D)
G) Loans On Manufactured Home Dwelling (A B C & D)
Number
Average Value
Number
Average Value
Number
Average Value
Number
Average Value
Number
Average Value
Number
Average Value
LOANS ORIGINATED
110
$304,062
172
$371,547
20
$303,825
95
$1,378,444
34
$418,683
0
$0
APPLICATIONS APPROVED, NOT ACCEPTED
53
$364,464
51
$369,499
3
$259,043
3
$682,210
18
$378,067
2
$75,985
APPLICATIONS DENIED
104
$331,241
138
$376,561
27
$301,603
6
$755,632
31
$414,595
1
$39,000
APPLICATIONS WITHDRAWN
52
$364,511
86
$371,272
13
$335,421
5
$1,038,276
18
$314,676
1
$381,820
FILES CLOSED FOR INCOMPLETENESS
8
$403,648
26
$350,181
2
$73,105
0
$0
3
$308,007
0
$0
Aggregated Statistics For Year 2005 (Based on 9 full and 14 partial tracts)
B) Conventional Home Purchase Loans
C) Refinancings
D) Home Improvement Loans
E) Loans on Dwellings For 5+ Families
F) Non-occupant Loans on < 5 Family Dwellings (A B C & D)
G) Loans On Manufactured Home Dwelling (A B C & D)
Number
Average Value
Number
Average Value
Number
Average Value
Number
Average Value
Number
Average Value
Number
Average Value
LOANS ORIGINATED
165
$289,277
222
$332,748
26
$260,333
115
$1,662,358
56
$375,019
0
$0
APPLICATIONS APPROVED, NOT ACCEPTED
44
$287,482
54
$354,013
9
$176,190
1
$260,080
17
$387,032
1
$72,000
APPLICATIONS DENIED
97
$297,624
142
$409,441
18
$201,177
3
$807,877
33
$458,675
2
$94,065
APPLICATIONS WITHDRAWN
52
$479,041
90
$379,107
11
$386,661
6
$1,232,663
18
$1,000,057
0
$0
FILES CLOSED FOR INCOMPLETENESS
7
$337,274
31
$356,376
0
$0
4
$665,472
5
$355,174
1
$227,570
Aggregated Statistics For Year 2004 (Based on 9 full and 14 partial tracts)
A) FHA, FSA/RHS & VA Home Purchase Loans
B) Conventional Home Purchase Loans
C) Refinancings
D) Home Improvement Loans
E) Loans on Dwellings For 5+ Families
F) Non-occupant Loans on < 5 Family Dwellings (A B C & D)
G) Loans On Manufactured Home Dwelling (A B C & D)
Number
Average Value
Number
Average Value
Number
Average Value
Number
Average Value
Number
Average Value
Number
Average Value
Number
Average Value
LOANS ORIGINATED
2
$208,500
152
$260,644
232
$260,288
27
$189,397
122
$1,490,285
66
$291,378
0
$0
APPLICATIONS APPROVED, NOT ACCEPTED
0
$0
43
$292,864
62
$258,590
6
$374,300
5
$1,299,916
9
$267,018
0
$0
APPLICATIONS DENIED
2
$187,000
78
$300,387
172
$224,361
34
$184,250
8
$696,972
33
$304,566
0
$0
APPLICATIONS WITHDRAWN
0
$0
36
$275,807
102
$272,690
8
$53,888
13
$3,231,477
16
$283,646
1
$195,060
FILES CLOSED FOR INCOMPLETENESS
0
$0
6
$268,615
36
$216,790
2
$161,645
0
$0
2
$183,025
0
$0
Aggregated Statistics For Year 2003 (Based on 9 full and 14 partial tracts)
A) FHA, FSA/RHS & VA Home Purchase Loans
B) Conventional Home Purchase Loans
C) Refinancings
D) Home Improvement Loans
E) Loans on Dwellings For 5+ Families
F) Non-occupant Loans on < 5 Family Dwellings (A B C & D)
Number
Average Value
Number
Average Value
Number
Average Value
Number
Average Value
Number
Average Value
Number
Average Value
LOANS ORIGINATED
1
$146,000
113
$198,299
335
$192,306
2
$133,855
129
$1,094,218
59
$199,927
APPLICATIONS APPROVED, NOT ACCEPTED
1
$176,200
31
$227,767
70
$213,795
3
$29,097
4
$404,445
18
$256,893
APPLICATIONS DENIED
1
$275,930
64
$224,728
189
$200,731
15
$30,996
13
$853,822
33
$221,048
APPLICATIONS WITHDRAWN
3
$291,690
26
$237,461
109
$179,313
9
$49,791
11
$1,775,701
18
$212,772
FILES CLOSED FOR INCOMPLETENESS
2
$183,155
6
$114,248
12
$227,482
1
$32,380
3
$1,102,803
1
$240,420
Aggregated Statistics For Year 2002 (Based on 5 full and 8 partial tracts)
A) FHA, FSA/RHS & VA Home Purchase Loans
B) Conventional Home Purchase Loans
C) Refinancings
D) Home Improvement Loans
E) Loans on Dwellings For 5+ Families
F) Non-occupant Loans on < 5 Family Dwellings (A B C & D)
Number
Average Value
Number
Average Value
Number
Average Value
Number
Average Value
Number
Average Value
Number
Average Value
LOANS ORIGINATED
2
$309,500
49
$233,152
70
$181,526
6
$27,437
75
$992,775
15
$218,793
APPLICATIONS APPROVED, NOT ACCEPTED
2
$192,730
16
$184,598
21
$230,671
2
$217,385
2
$880,720
3
$213,030
APPLICATIONS DENIED
2
$255,500
23
$188,240
51
$174,455
8
$18,950
8
$444,674
7
$239,821
APPLICATIONS WITHDRAWN
1
$191,110
10
$172,563
36
$212,239
8
$80,612
8
$2,061,290
5
$183,510
FILES CLOSED FOR INCOMPLETENESS
0
$0
6
$227,560
14
$133,745
0
$0
0
$0
3
$201,263
Aggregated Statistics For Year 2001 (Based on 5 full and 8 partial tracts)
A) FHA, FSA/RHS & VA Home Purchase Loans
B) Conventional Home Purchase Loans
C) Refinancings
D) Home Improvement Loans
E) Loans on Dwellings For 5+ Families
F) Non-occupant Loans on < 5 Family Dwellings (A B C & D)
Number
Average Value
Number
Average Value
Number
Average Value
Number
Average Value
Number
Average Value
Number
Average Value
LOANS ORIGINATED
17
$219,396
17
$166,916
65
$164,983
4
$20,218
48
$1,165,467
13
$157,439
APPLICATIONS APPROVED, NOT ACCEPTED
4
$241,288
15
$179,665
17
$173,040
1
$15,270
1
$195,490
4
$142,375
APPLICATIONS DENIED
9
$233,242
31
$185,800
53
$154,104
14
$32,906
11
$908,120
4
$162,968
APPLICATIONS WITHDRAWN
6
$236,842
16
$216,180
32
$167,172
9
$28,820
6
$1,271,352
4
$214,020
FILES CLOSED FOR INCOMPLETENESS
1
$199,210
6
$177,990
9
$175,864
0
$0
1
$696,430
1
$176,000
Aggregated Statistics For Year 2000 (Based on 5 full and 8 partial tracts)
A) FHA, FSA/RHS & VA Home Purchase Loans
B) Conventional Home Purchase Loans
C) Refinancings
D) Home Improvement Loans
E) Loans on Dwellings For 5+ Families
F) Non-occupant Loans on < 5 Family Dwellings (A B C & D)
Number
Average Value
Number
Average Value
Number
Average Value
Number
Average Value
Number
Average Value
Number
Average Value
LOANS ORIGINATED
13
$191,706
32
$130,354
16
$124,544
4
$93,975
40
$673,983
11
$120,469
APPLICATIONS APPROVED, NOT ACCEPTED
6
$192,055
14
$165,339
6
$185,578
8
$34,089
0
$0
2
$159,530
APPLICATIONS DENIED
7
$169,119
25
$202,216
37
$138,009
12
$23,212
16
$691,699
10
$174,607
APPLICATIONS WITHDRAWN
3
$121,360
13
$161,352
16
$115,516
3
$91,410
8
$753,659
5
$197,346
FILES CLOSED FOR INCOMPLETENESS
3
$186,793
6
$93,817
9
$167,563
0
$0
10
$777,211
1
$76,930
Aggregated Statistics For Year 1999 (Based on 4 full and 7 partial tracts)
A) FHA, FSA/RHS & VA Home Purchase Loans
B) Conventional Home Purchase Loans
C) Refinancings
D) Home Improvement Loans
E) Loans on Dwellings For 5+ Families
F) Non-occupant Loans on < 5 Family Dwellings (A B C & D)
2005 - 2018 National Fire Incident Reporting System (NFIRS) incidents
Based on the data from the years 2005 - 2018 the average number of fire incidents per year is 127. The highest number of fire incidents - 222 took place in 2005, and the least - 79 in 2012. The data has a dropping trend.
When looking into fire subcategories, the most reports belonged to: Structure Fires (56.2%), and Outside Fires (30.1%).
Fire incident types reported to NFIRS in Zip Code 90057


 Nearest zip codes: 90017, 90006, 90026, 90071, 90015, 90079.
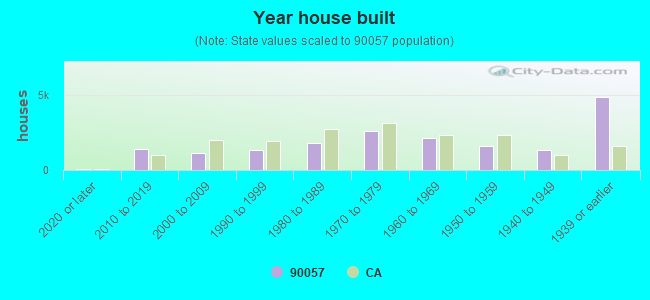


 Based on the data from the years 2005 - 2018 the average number of fire incidents per year is 127. The highest number of fire incidents - 222 took place in 2005, and the least - 79 in 2012. The data has a dropping trend.
 When looking into fire subcategories, the most reports belonged to: Structure Fires (56.2%), and Outside Fires (30.1%).