Historic Core neighborhood in Los Angeles, California (CA), 90012, 90013, 90014 detailed profile
Settings
X

Business Search - 14 Million verified businesses
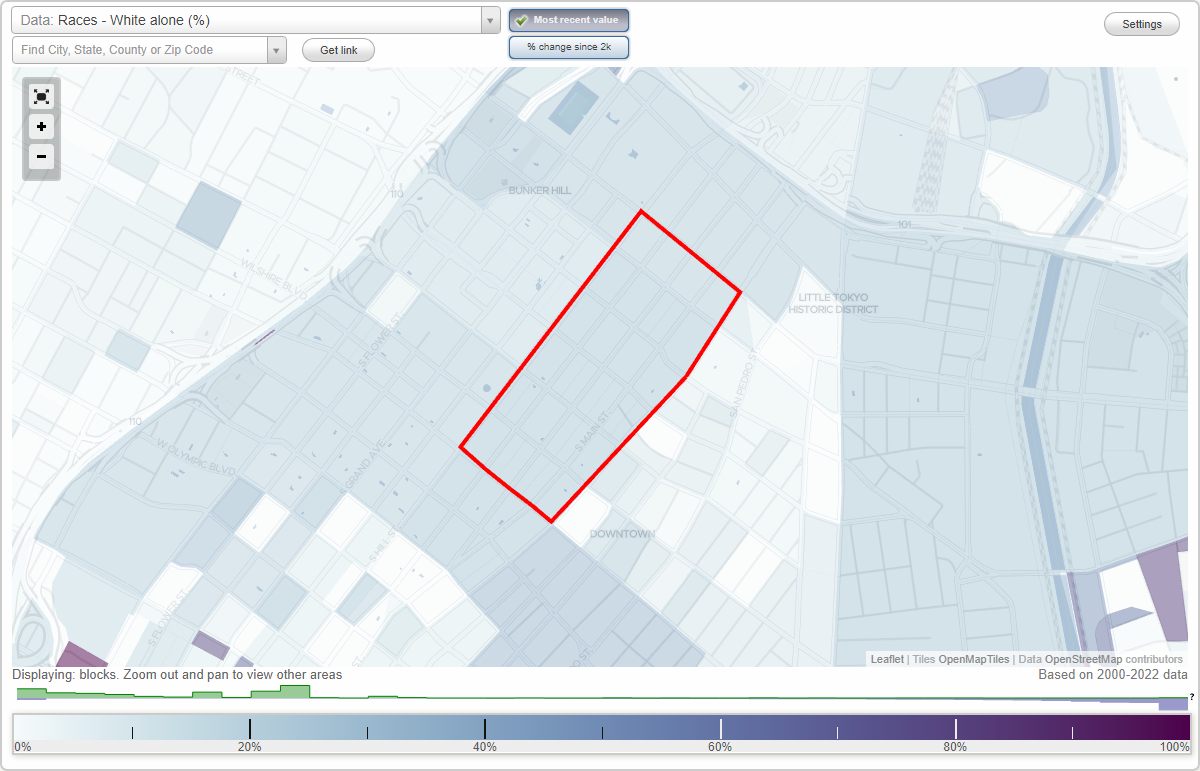
Area: 0.231 square miles
Population: 3,816
Population density:
| Historic Core: | 16,519 people per square mile |
| Los Angeles: | 8,148 people per square mile |

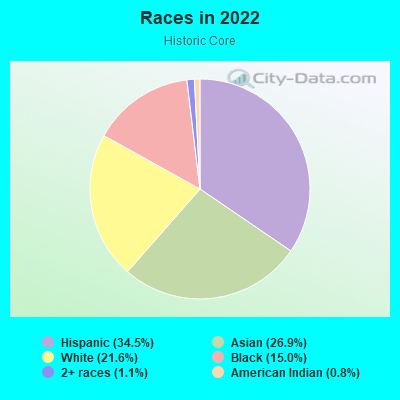
- 1,31734.5%Hispanic or Latino
- 1,02726.9%Asian
- 82421.6%White
- 57315.0%Black
- 411.1%Two or more races
- 310.8%American Indian
Median household income in 2022:
| Historic Core: | $59,703 |
| Los Angeles: | $76,135 |
Distribution of median household income
![Distribution of median household income]()
- 188Less than $10,000
- 143$10,000 to $19,999
- 136$20,000 to $29,999
- 15$30,000 to $39,999
- 15$40,000 to $49,999
- 220$50,000 to $59,999
- 48$60,000 to $74,999
- 167$75,000 to $99,999
- 220$100,000 to $124,999
- 88$125,000 to $149,999
- 90$150,000 to $199,999
- 70$200,000 or more

Distribution of rent paid by renters
![Distribution of rent paid by renters]()
- 99$300 to $399
- 59$500 to $599
- 108$1,500 to $1,999
- 1,081$2,000 or more

Median rent in 2022:
| Historic Core: | $733 |
| Los Angeles: | $1,648 |
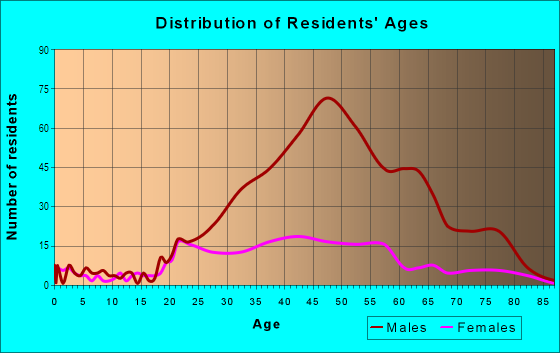
| Males: | 2,372 |
| Females: | 1,443 |
Males:
| This neighborhood: | 33.4 years |
| Whole city: | 36.5 years |
| This neighborhood: | 26.4 years |
| Whole city: | 37.9 years |
Average household size:
| Historic Core: | 1.9 people |
| Los Angeles: | 2.6 people |
Percentage of family households:
| Historic Core: | 23.9% |
| Los Angeles: | 40.1% |
| Here: | 12.1% |
| Los Angeles: | 36.7% |
Percentage of married-couple families with children (among all households):
| Historic Core: | 11.9% |
| Los Angeles: | 24.3% |
Percentage of single-mother households (among all households):
| Historic Core: | 1.7% |
| Los Angeles: | 9.9% |
Percentage of never married males 15 years old and over:
Percentage of never married females 15 years old and over:
| Historic Core: | 41.9% |
| Los Angeles: | 24.7% |
Percentage of never married females 15 years old and over:
| Historic Core: | 24.9% |
| city: | 22.0% |
Percentage of people that speak English not well or not at all:
| Historic Core: | 9.7% |
| Los Angeles: | 13.8% |
Percentage of people born in this state:
Percentage of people born in another U.S. state:
Percentage of native residents but born outside the U.S.:
Percentage of foreign born residents:
| Here: | 40.4% |
| Los Angeles: | 46.9% |
Percentage of people born in another U.S. state:
| Historic Core: | 22.4% |
| Los Angeles: | 15.7% |
Percentage of native residents but born outside the U.S.:
| Here: | 0.5% |
| city: | 1.6% |
Percentage of foreign born residents:
| Here: | 36.7% |
| Los Angeles: | 35.7% |
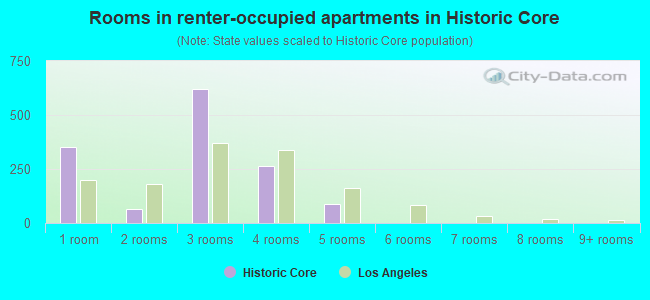
- Rooms in renter-occupied apartments in Historic Core
- 3521 room
- 652 rooms
- 6223 rooms
- 2644 rooms
- 875 rooms
- 06 rooms
- 07 rooms
- 08 rooms
- 09+ rooms
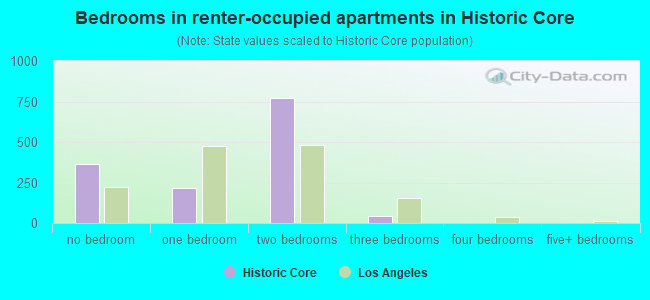
- Bedrooms in renter-occupied apartments in Historic Core
- 363no bedroom
- 2131 bedroom
- 7732 bedrooms
- 413 bedrooms
- 04 bedrooms
- 05+ bedrooms
Average number of cars or other vehicles available in apartments:
| Here: | 1.3 |
| city: | 1.3 |
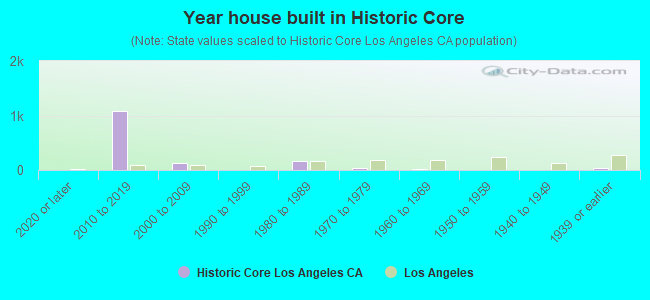
- Year house built in Historic Core
- 02020 or later
- 1,0822010 to 2019
- 1272000 to 2009
- 01990 to 1999
- 1581980 to 1989
- 291970 to 1979
- 141960 to 1969
- 91950 to 1959
- 01940 to 1949
- 411939 or earlier
City-data.com crime index for city in 2020 (higher means more crime):
| City: | 327.4 |
| U.S. average: | 219.5 |
Travel time to work (commute)
![Travel time to work (commute)]()
- 63Less than 5 minutes
- 235 to 9 minutes
- 6910 to 14 minutes
- 6015 to 19 minutes
- 3020 to 24 minutes
- 8125 to 29 minutes
- 4930 to 34 minutes
- 535 to 39 minutes
- 340 to 44 minutes
- 9445 to 59 minutes
- 1160 to 89 minutes
- 1690 or more minutes

Means of transportation to work
![Means of transportation to work]()
- 55.0%868Drove a car alone
- 4.0%63Carpooled
- 6.3%100Bus
- 0.8%12Subway or elevated rail
- 17.4%275Walked
- 0.4%7Other means
- 15.7%248Worked at home

Time leaving home to go to work
![Time leaving home to go to work]()
- 6512:00 a.m. to 4:59 a.m.
- 105:00 a.m. to 5:29 a.m.
- 316:00 a.m. to 6:29 a.m.
- 136:30 a.m. to 6:59 a.m.
- 917:00 a.m. to 7:29 a.m.
- 707:30 a.m. to 7:59 a.m.
- 408:00 a.m. to 8:29 a.m.
- 498:30 a.m. to 8:59 a.m.
- 319:00 a.m. to 9:59 a.m.
- 510:00 a.m. to 10:59 a.m.
- 711:00 a.m. to 11:59 a.m.
- 1112:00 p.m. to 3:59 p.m.
- 174:00 p.m. to 11:59 p.m.

Occupations of males:
- Percentage of males in management occupations (except farmers):
Here: 3.8% city: 10.6%
- Percentage of males in business and financial operations occupations:
Here: 3.3% city: 5.0%
- Percentage of males in computer and mathematical occupations:
Here: 1.2% city: 3.6%
- Percentage of males in architecture and engineering occupations:
Here: 3.5% city: 2.2%
- Percentage of males in life, physical, and social science occupations:
Here: 1.6% city: 0.7%
- Percentage of males in community and social services occupations:
Here: 1.6% city: 1.0%
- Percentage of males in legal occupations:
Here: 1.6% city: 1.8%
- Percentage of males in arts, design, entertainment, sports, and media occupations:
Here: 58.2% city: 8.0%
- Percentage of males in healthcare practitioners and technical occupations:
Here: 2.3% city: 2.9%
- Percentage of males in service occupations:
Here: 5.4% city: 16.2%
- Percentage of males in sales and office occupations:
Here: 13.3% city: 15.1%
- Percentage of males in production occupations:
Here: 1.4% city: 5.9%
Occupations of females:
- Percentage of females in management occupations (except farmers):
Here: 14.0% city: 10.5%
- Percentage of females in business and financial operations occupations:
Here: 1.3% city: 6.5%
- Percentage of females in computer and mathematical occupations:
Here: 1.3% city: 1.5%
- Percentage of females in architecture and engineering occupations:
Here: 4.2% city: 0.7%
- Percentage of females in community and social services occupations:
Here: 10.1% city: 2.3%
- Percentage of females in education, training, and library occupations:
Here: 12.1% city: 7.1%
- Percentage of females in arts, design, entertainment, sports, and media occupations:
Here: 5.5% city: 6.3%
- Percentage of females in healthcare practitioners and technical occupations:
Here: 17.3% city: 6.5%
- Percentage of females in service occupations:
Here: 11.7% city: 23.6%
- Percentage of females in sales and office occupations:
Here: 20.2% city: 24.7%
- Percentage of females in production occupations:
Here: 1.3% city: 3.5%
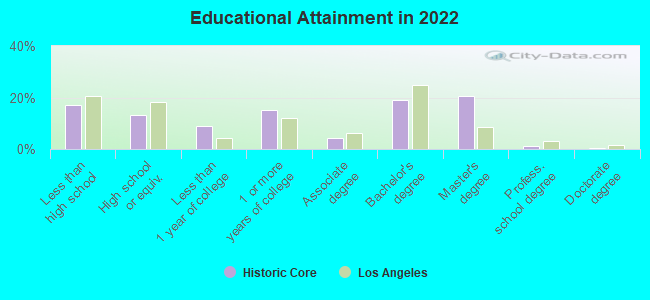
Education in this neighborhood (subdivision or community):
- Percentage of people 3 years and older in K-12 schools:
Historic Core: 2.2% Los Angeles: 14.4%
- Percentage of people 3 years and older in undergraduate colleges:
Historic Core: 12.3% Los Angeles: 6.0%
- Percentage of people 3 years and older in grad. or professional schools:
Historic Core: 8.4% Los Angeles: 2.1%
- Percentage of students K-12 enrolled in private schools:
Historic Core: 9.1% Los Angeles: 12.1%
Percentage of population below poverty level:
| Historic Core: | 31.7% |
| Los Angeles: | 16.8% |
Percentage of married-couple families with both working:
| Historic Core: | 57.1% |
| Los Angeles: | 63.8% |
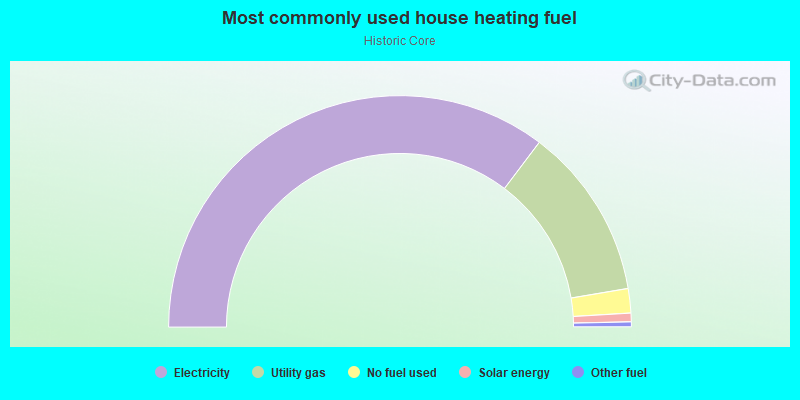
- 70.6%Electricity
- 24.1%Utility gas
- 3.4%No fuel used
- 1.2%Solar energy
- 0.7%Other fuel
Roads and streets:
S Broadway
Length: 0.66 miles
Direction: SW-NE
Address range: 100 to 599
Direction: SW-NE
Address range: 100 to 599
S Spring St
Length: 0.66 miles
Direction: SW-NE
Address range: 100 to 599
Direction: SW-NE
Address range: 100 to 599
S Main St
Length: 0.54 miles
Direction: SW-NE
Address range: 200 to 599
Direction: SW-NE
Address range: 200 to 599
S Los Angeles St
Length: 0.45 miles
Direction: SW-NE
Address range: 100 to 499
Direction: SW-NE
Address range: 100 to 499
Harlem Pl
Length: 0.27 miles
Direction: SW-NE
Address range: 200 to 599
Direction: SW-NE
Address range: 200 to 599
W 5th St
Length: 0.22 miles
Direction: SE-NW
Address range: 100 to 355
Direction: SE-NW
Address range: 100 to 355
Werdin Pl
Length: 0.22 miles
Direction: SW-NE
Address range: 400 to 599
Direction: SW-NE
Address range: 400 to 599
W 6th St
Length: 0.22 miles
Direction: SE-NW
Address range: 100 to 323
Direction: SE-NW
Address range: 100 to 323
W 3rd St
Length: 0.18 miles
Direction: SE-NW
Address range: 100 to 299
Direction: SE-NW
Address range: 100 to 299
W 4th St
Length: 0.18 miles
Direction: SE-NW
Address range: 100 to 299
Direction: SE-NW
Address range: 100 to 299
W 2nd St
Length: 0.18 miles
Direction: SE-NW
Address range: 100 to 299
Direction: SE-NW
Address range: 100 to 299
W 1st St
Length: 0.18 miles
Direction: SE-NW
Address range: 200 to 399
Direction: SE-NW
Address range: 200 to 399
S Werdin Pl
Length: 0.17 miles
Direction: SW-NE
Address range: 200 to 399
Direction: SW-NE
Address range: 200 to 399
Frank Ct
Length: 0.14 miles
Direction: SW-NE
Address range: 400 to 499
Direction: SW-NE
Address range: 400 to 499
S Harlem Pl
Length: 0.14 miles
Direction: SW-NE
Address range: 400 to 499
Direction: SW-NE
Address range: 400 to 499
Lindley Pl
Length: 0.13 miles
Direction: SW-NE
Address range: 500 to 599
Direction: SW-NE
Address range: 500 to 599
E 3rd St
Length: 0.11 miles
Directions: N-S, SE-NW
Address range: 100 to 199
Directions: N-S, SE-NW
Address range: 100 to 199
E 2nd St
Length: 0.10 miles
Direction: SE-NW
Address range: 100 to 199
Direction: SE-NW
Address range: 100 to 199
E 4th St
Length: 0.09 miles
Direction: SE-NW
Address range: 100 to 199
Direction: SE-NW
Address range: 100 to 199
Winston St
Length: 0.08 miles
Direction: SE-NW
Address range: 100 to 199
Direction: SE-NW
Address range: 100 to 199
E 5th St
Length: 0.08 miles
Direction: SE-NW
Address range: 100 to 199
Direction: SE-NW
Address range: 100 to 199
St Vincent Pl
Length: 0.02 miles
Direction: SW-NE
Direction: SW-NE