Estimated zip code population in 2022: 26,374 Zip code population in 2010: 28,418 Zip code population in 2000: 27,792
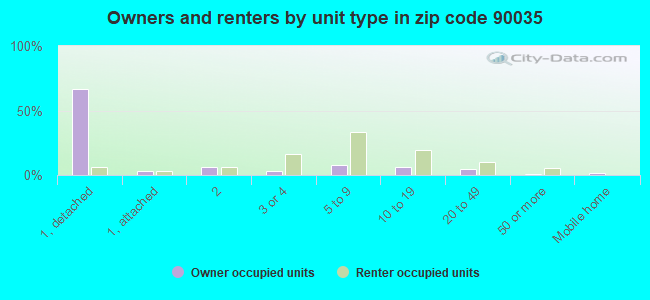
Houses and condos: 13,778 Renter-occupied apartments: 7,863
% of renters here:
68%
State:
44%
March 2022 cost of living index in zip code 90035: 148.4 (very high, U.S. average is 100)
Land area: 2.1 sq. mi. Water area: 0.0 sq. mi.
Population density: 12,815 people per square mile
(very high).
OSM Map
General Map
Google Map
MSN Map
OSM Map
General Map
Google Map
MSN Map
OSM Map
General Map
Google Map
MSN Map
OSM Map
General Map
Google Map
MSN Map
Please wait while loading the map...
Real estate property taxes paid for housing units in 2022:
This zip code:
0.4% ($7,691)
California:
0.7% ($4,831)
Median real estate property taxes paid for housing units with mortgages in 2022: $9,878 (0.6%) Median real estate property taxes paid for housing units with no mortgage in 2022: $4,751 (0.3%)
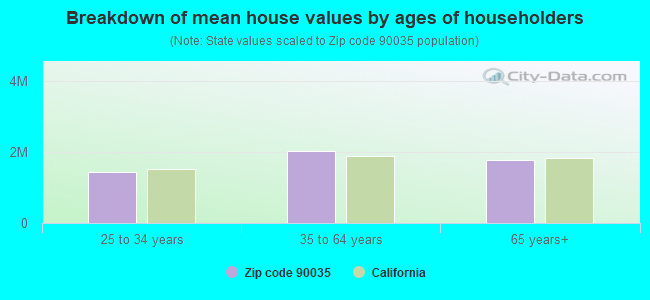
Estimated median house/condo value in 2022: $1,799,468
90035:
$1,799,468
California:
$715,900
According to our research of California and other state lists, there were 16 registered sex offenders living in 90035 zip code as of April 27, 2024. The ratio of all residents to sex offenders in zip code 90035 is 1,939 to 1. The ratio of registered sex offenders to all residents in this zip code is much lower than the state average.
Median resident age:
This zip code:
37.5 years
California median age:
37.9 years
Average household size:
This zip code:
2.2 people
California:
2.8 people
Averages for the 2020 tax year for zip code 90035, filed in 2021:
Average Adjusted Gross Income (AGI) in 2020: $124,474 (Individual Income Tax Returns)
Here:
$124,474
State:
$95,910
Salary/wage: $97,148 (reported on 74.9% of returns)
Here:
$97,148
State:
$77,331
(% of AGI for various income ranges: 1166.4% for AGIs below $25k, 4135.4% for AGIs $25k-50k, 7734.8% for AGIs $50k-75k, 12019.9% for AGIs $75k-100k, 23072.3% for AGIs $100k-200k, 114992.2% for AGIs over 200k)
Taxable interest for individuals: $3,968 (reported on 41.0% of returns)
This zip code:
$3,968
California:
$2,294
(% of AGI for various income ranges: 43.3% for AGIs below $25k, 91.4% for AGIs $25k-50k, 89.6% for AGIs $50k-75k, 200.0% for AGIs $75k-100k, 338.3% for AGIs $100k-200k, 3224.7% for AGIs over 200k)
Ordinary dividends: $8,389 (reported on 33.3% of returns)
Here:
$8,389
State:
$10,949
(% of AGI for various income ranges: 76.2% for AGIs below $25k, 129.1% for AGIs $25k-50k, 176.4% for AGIs $50k-75k, 344.6% for AGIs $75k-100k, 652.8% for AGIs $100k-200k, 5401.3% for AGIs over 200k)
Net capital gain/loss in AGI: +$41,199 (reported on 32.3% of returns)
Here:
+$41,199
State:
+$49,306
(% of AGI for various income ranges: 84.8% for AGIs below $25k, 114.0% for AGIs $25k-50k, 166.3% for AGIs $50k-75k, 425.1% for AGIs $75k-100k, 1291.4% for AGIs $100k-200k, 36118.0% for AGIs over 200k)
Profit/loss from business: +$22,275 (reported on 29.4% of returns)
Here:
+$22,275
State:
+$15,671
(% of AGI for various income ranges: 360.5% for AGIs below $25k, 577.5% for AGIs $25k-50k, 597.5% for AGIs $50k-75k, 956.3% for AGIs $75k-100k, 1761.8% for AGIs $100k-200k, 9775.1% for AGIs over 200k)
Taxable individual retirement arrangement distribution: $19,178 (reported on 6.3% of returns)
90035:
$19,178
California:
$23,505
(% of AGI for various income ranges: 49.4% for AGIs below $25k, 84.7% for AGIs $25k-50k, 135.9% for AGIs $50k-75k, 299.7% for AGIs $75k-100k, 484.6% for AGIs $100k-200k, 1352.2% for AGIs over 200k)
Self-employed (Keogh) retirement plans: $29,287 (reported on 2.2% of returns)
90035:
$29,287
California:
$30,163
(% of AGI for various income ranges: 9.2% for AGIs below $25k, 35.1% for AGIs $50k-75k, 128.5% for AGIs $100k-200k, 1603.8% for AGIs over 200k)
Total itemized deductions: $46,662 (reported on 20.4% of returns)
Here:
$46,662
State:
$39,517
(% of AGI for various income ranges: 237.3% for AGIs below $25k, 367.8% for AGIs $25k-50k, 665.5% for AGIs $50k-75k, 1165.2% for AGIs $75k-100k, 2896.0% for AGIs $100k-200k, 17087.8% for AGIs over 200k)
Charity contributions: $16,662 (reported on 17.9% of returns)
Here:
$16,662
State:
$12,598
(% of AGI for various income ranges: 8.1% for AGIs below $25k, 34.2% for AGIs $25k-50k, 91.9% for AGIs $50k-75k, 193.1% for AGIs $75k-100k, 641.0% for AGIs $100k-200k, 7063.6% for AGIs over 200k)
Taxes paid: $8,795 (reported on 20.2% of returns)
90035:
$8,795
State:
$8,807
(% of AGI for various income ranges: 40.9% for AGIs below $25k, 76.6% for AGIs $25k-50k, 137.6% for AGIs $50k-75k, 291.2% for AGIs $75k-100k, 716.5% for AGIs $100k-200k, 2642.2% for AGIs over 200k)
Earned income credit: $1,455 (reported on 8.9% of returns)
Here:
$1,455
State:
$2,074
(% of AGI for various income ranges: 62.0% for AGIs below $25k, 44.3% for AGIs $25k-50k)
Percentage of individuals using paid preparers for their 2020 taxes: 92.6%
Here:
93%
State:
92%
(% for various income ranges: 89.9% for AGIs below $25k, 92.6% for AGIs $25k-50k, 93.3% for AGIs $50k-75k, 93.8% for AGIs $75k-100k, 93.0% for AGIs $100k-200k, 95.8% for AGIs over 200k)
Averages for the 2012 tax year for zip code 90035, filed in 2013:
Average Adjusted Gross Income (AGI) in 2012: $91,091 (Individual Income Tax Returns)
Here:
$91,091
State:
$72,726
Salary/wage: $73,660 (reported on 78.4% of returns)
Here:
$73,660
State:
$59,079
(% of AGI for various income ranges: 64.2% for AGIs below $25k, 75.3% for AGIs $25k-50k, 76.7% for AGIs $50k-75k, 73.8% for AGIs $75k-100k, 71.9% for AGIs $100k-200k, 52.3% for AGIs over 200k)
Taxable interest for individuals: $3,439 (reported on 43.3% of returns)
This zip code:
$3,439
California:
$2,146
(% of AGI for various income ranges: 2.4% for AGIs below $25k, 1.3% for AGIs $25k-50k, 1.2% for AGIs $50k-75k, 1.0% for AGIs $75k-100k, 1.0% for AGIs $100k-200k, 2.1% for AGIs over 200k)
Ordinary dividends: $7,167 (reported on 29.9% of returns)
Here:
$7,167
State:
$9,308
(% of AGI for various income ranges: 3.5% for AGIs below $25k, 1.9% for AGIs $25k-50k, 1.6% for AGIs $50k-75k, 1.5% for AGIs $75k-100k, 1.8% for AGIs $100k-200k, 2.9% for AGIs over 200k)
Net capital gain/loss in AGI: +$20,799 (reported on 27.5% of returns)
Here:
+$20,799
State:
+$30,460
(% of AGI for various income ranges: 0.4% for AGIs $25k-50k, 1.0% for AGIs $50k-75k, 1.9% for AGIs $75k-100k, 2.0% for AGIs $100k-200k, 11.9% for AGIs over 200k)
Profit/loss from business: +$21,376 (reported on 29.0% of returns)
Here:
+$21,376
State:
+$17,064
(% of AGI for various income ranges: 20.0% for AGIs below $25k, 9.7% for AGIs $25k-50k, 6.9% for AGIs $50k-75k, 7.2% for AGIs $75k-100k, 6.3% for AGIs $100k-200k, 5.2% for AGIs over 200k)
Taxable individual retirement arrangement distribution: $19,108 (reported on 7.8% of returns)
90035:
$19,108
California:
$19,557
(% of AGI for various income ranges: 2.2% for AGIs below $25k, 1.5% for AGIs $25k-50k, 1.5% for AGIs $50k-75k, 2.1% for AGIs $75k-100k, 1.9% for AGIs $100k-200k, 1.4% for AGIs over 200k)
Self-employment retirement plans: $25,256 (reported on 2.3% of returns)
90035:
$25,256
California:
$24,530
(% of AGI for various income ranges: 0.2% for AGIs $25k-50k, 0.2% for AGIs $50k-75k, 0.3% for AGIs $75k-100k, 0.6% for AGIs $100k-200k, 0.9% for AGIs over 200k)
Total itemized deductions: $41,095 (25% of AGI, reported on 42.6% of returns)
Here:
$41,095
State:
$34,004
Here:
24.6% of AGI
State:
22.7% of AGI
(% of AGI for various income ranges: 18.9% for AGIs below $25k, 13.2% for AGIs $25k-50k, 14.5% for AGIs $50k-75k, 18.4% for AGIs $75k-100k, 20.2% for AGIs $100k-200k, 21.1% for AGIs over 200k)
Charity contributions: $7,518 (reported on 36.7% of returns)
Here:
$7,518
State:
$4,659
(% of AGI for various income ranges: 1.1% for AGIs below $25k, 1.5% for AGIs $25k-50k, 1.8% for AGIs $50k-75k, 2.3% for AGIs $75k-100k, 2.5% for AGIs $100k-200k, 4.1% for AGIs over 200k)
Taxes paid: $17,889 (reported on 42.5% of returns)
90035:
$17,889
State:
$14,448
(% of AGI for various income ranges: 3.3% for AGIs below $25k, 2.8% for AGIs $25k-50k, 3.9% for AGIs $50k-75k, 6.2% for AGIs $75k-100k, 7.9% for AGIs $100k-200k, 11.4% for AGIs over 200k)
Earned income credit: $1,651 (reported on 11.9% of returns)
Here:
$1,651
State:
$2,286
(% of AGI for various income ranges: 4.1% for AGIs below $25k, 0.5% for AGIs $25k-50k)
Percentage of individuals using paid preparers for their 2012 taxes: 67.1%
Here:
67%
State:
64%
(% for various income ranges: 62.8% for AGIs below $25k, 61.4% for AGIs $25k-50k, 64.6% for AGIs $50k-75k, 70.5% for AGIs $75k-100k, 74.7% for AGIs $100k-200k, 84.3% for AGIs over 200k)
Averages for the 2004 tax year for zip code 90035, filed in 2005:
Average Adjusted Gross Income (AGI) in 2004: $69,823 (Individual Income Tax Returns)
Here:
$69,823
State:
$58,600
Salary/wage: $60,033 (reported on 75.9% of returns)
Here:
$60,033
State:
$49,455
(% of AGI for various income ranges: 68.9% for AGIs $10k-25k, 78.3% for AGIs $25k-50k, 77.8% for AGIs $50k-75k, 72.6% for AGIs $75k-100k, 56.7% for AGIs over 100k)
Taxable interest for individuals: $5,758 (reported on 52.8% of returns)
This zip code:
$5,758
California:
$2,365
(% of AGI for various income ranges: 4.1% for AGIs $10k-25k, 2.7% for AGIs $25k-50k, 2.4% for AGIs $50k-75k, 2.7% for AGIs $75k-100k, 5.0% for AGIs over 100k)
Taxable dividends: $5,270 (reported on 34.1% of returns)
Here:
$5,270
State:
$4,746
(% of AGI for various income ranges: 2.3% for AGIs $10k-25k, 1.6% for AGIs $25k-50k, 1.4% for AGIs $50k-75k, 1.7% for AGIs $75k-100k, 3.0% for AGIs over 100k)
Net capital gain/loss: +$14,221 (reported on 31.0% of returns)
Here:
+$14,221
State:
+$23,418
(% of AGI for various income ranges: -0.3% for AGIs $10k-25k, 0.7% for AGIs $25k-50k, 1.0% for AGIs $50k-75k, 1.9% for AGIs $75k-100k, 9.6% for AGIs over 100k)
Profit/loss from business: +$16,222 (reported on 27.9% of returns)
Here:
+$16,222
State:
+$16,826
(% of AGI for various income ranges: 14.6% for AGIs $10k-25k, 7.9% for AGIs $25k-50k, 4.6% for AGIs $50k-75k, 6.9% for AGIs $75k-100k, 5.5% for AGIs over 100k)
IRA payment deduction: $3,285 (reported on 4.2% of returns)
90035:
$3,285
California:
$3,192
(% of AGI for various income ranges: 0.4% for AGIs $10k-25k, 0.4% for AGIs $25k-50k, 0.3% for AGIs $50k-75k, 0.3% for AGIs $75k-100k, 0.1% for AGIs over 100k)
Self-employed pension: $17,576 (reported on 2.6% of returns)
Here:
$17,576
California:
$17,688
(% of AGI for various income ranges: 0.2% for AGIs $10k-25k, 0.3% for AGIs $25k-50k, 0.3% for AGIs $50k-75k, 0.5% for AGIs $75k-100k, 0.8% for AGIs over 100k)
Total itemized deductions: $34,143 (26% of AGI, reported on 43.4% of returns)
Here:
$34,143
State:
$28,113
Here:
26.3% of AGI
State:
25.3% of AGI
(% of AGI for various income ranges: 15.6% for AGIs $10k-25k, 17.2% for AGIs $25k-50k, 18.7% for AGIs $50k-75k, 22.6% for AGIs $75k-100k, 22.1% for AGIs over 100k)
Charity contributions deductions: $7,736 (6% of AGI, reported on 39.3% of returns)
Here:
$7,736
State:
$3,923
Here:
5.7% of AGI
State:
3.3% of AGI
(% of AGI for various income ranges: 1.5% for AGIs $10k-25k, 2.2% for AGIs $25k-50k, 2.5% for AGIs $50k-75k, 3.1% for AGIs $75k-100k, 5.5% for AGIs over 100k)
Total tax: $13,930 (reported on 82.0% of returns)
90035:
$13,930
State:
$10,761
(% of AGI for various income ranges: 6.1% for AGIs $10k-25k, 8.8% for AGIs $25k-50k, 11.4% for AGIs $50k-75k, 12.4% for AGIs $75k-100k, 19.9% for AGIs over 100k)
Earned income credit: $1,267 (reported on 10.3% of returns)
Here:
$1,267
State:
$1,763
Percentage of individuals using paid preparers for their 2004 taxes: 71.0%
Here:
71%
State:
66%
(% for various income ranges: 67.2% for AGIs below $10k, 66.4% for AGIs $10k-25k, 69.1% for AGIs $25k-50k, 71.5% for AGIs $50k-75k, 76.3% for AGIs $75k-100k, 81.1% for AGIs over 100k)
Likely homosexual households (counted as self-reported same-sex unmarried-partner households)
Lesbian couples: 0.1% of all households
Gay men: 0.7% of all households
Household received Food Stamps/SNAP in the past 12 months: 811 Household did not receive Food Stamps/SNAP in the past 12 months: 10,667
Women who had a birth in the past 12 months: 435 (403 now married, 30 unmarried) Women who did not have a birth in the past 12 months: 6,815 (2,448 now married, 4,377 unmarried)
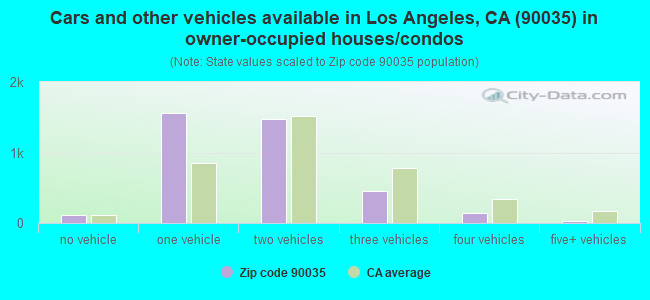
Housing units in zip code 90035 with a mortgage: 2,205 (290 second mortgage, 276 both second mortgage and home equity loan) Median monthly owner costs for units with a mortgage: $3,876 Median monthly owner costs for units without a mortgage: $1,013
Residents with income below the poverty level in 2022:
This zip code:
8.2%
Whole state:
12.2%
Residents with income below 50% of the poverty level in 2022:
This zip code:
4.3%
Whole state:
6.2%
Median number of rooms in houses and condos:
Here:
6.2
State:
6.0
Median number of rooms in apartments:
Here:
3.7
State:
3.9
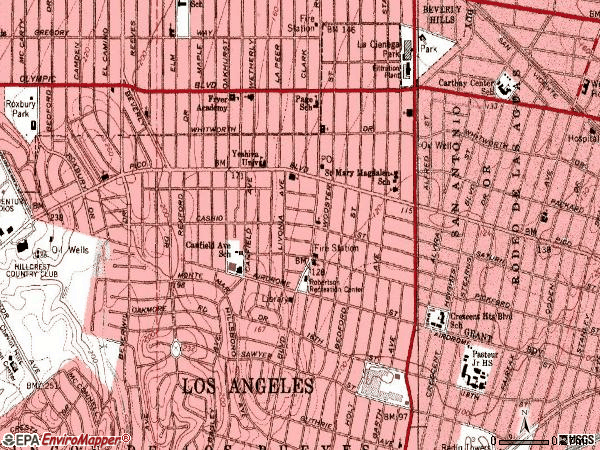
Notable locations in this zip code not listed on our city pages
Notable locations in zip code 90035: Robertson Branch Los Angeles Public Library (A), Museum of Tolerance (B), Claude Pepper Senior Citizens Center (C), City of Los Angeles Fire Department Station 58 (D). Display/hide their locations on the map
Churches in zip code 90035 include: B'nai David Synagogue (A), Anshe Emet Synagogue (B), Bnai David Congregation (C), Congregation Mogen David (D), Concordia Lutheran Church (E), Saint Mary Magdalen Roman Catholic Church (F), Temple Beth Am (G). Display/hide their locations on the map
4,542 married couples with children.
553 single-parent households (119 men, 434 women).
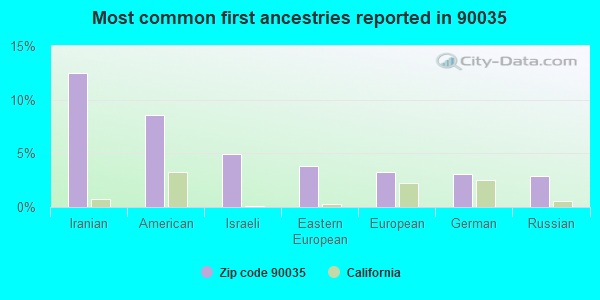
69.0% of residents of 90035 zip code speak English at home.
6.7% of residents speak Spanish at home (83% very well, 11% well, 4% not well, 1% not at all).
12.6% of residents speak other Indo-European language at home (70% very well, 18% well, 9% not well, 3% not at all).
3.3% of residents speak Asian or Pacific Island language at home (69% very well, 21% well, 7% not well, 3% not at all).
8.7% of residents speak other language at home (81% very well, 14% well, 6% not well).
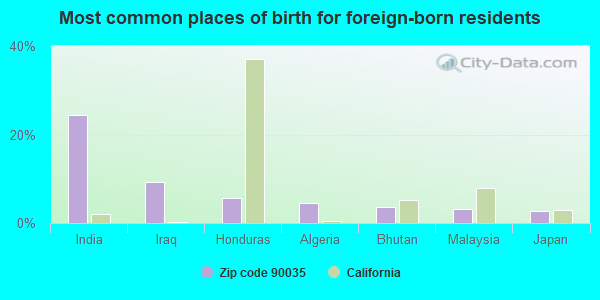
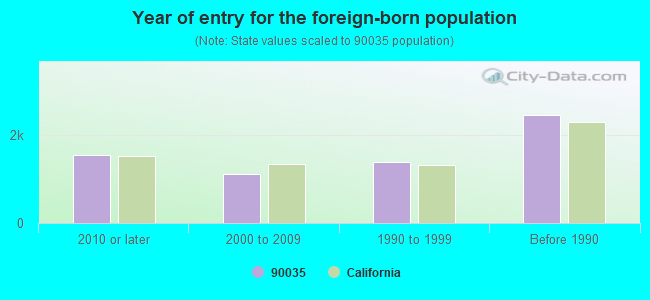
Foreign born population: 6,200 (23.5%) (69.2% of them are naturalized citizens)
Major facilities with environmental interests located in this zip code:
FELDMAR WATCH CO INC (9000 W PICO BLVD in LOS ANGELES, CA)
STATE MASTER (California - Hazardous Waste Tracking) - HAZARDOU WASTE PROGRAM Small Quantity Generators, between 100 kg and 1000 kg of hazardous waste/month (Resource Conservation and Recovery Act (tracking hazardous waste)) - notification Organizations: BARNEY FELDMAR (CONTACT/OWNER)
KEN DU CO INCORPORATED DBA PAULEE BODY SHOP (1115 SOUTH LA CIENAGA BOULEVARD in LOS ANGELES, CA)
STATE MASTER (California - Hazardous Waste Tracking) - HAZARDOU WASTE PROGRAM CRITERIA AND HAZARDOUS AIR POLLUTANT INVENTORY (Inventory of air pollution sources) Small Quantity Generators, between 100 kg and 1000 kg of hazardous waste/month (Resource Conservation and Recovery Act (tracking hazardous waste)) Business SIC classification: TOP, BODY, AND UPHOLSTERY REPAIR SHOPS AND PAINT SHOPS
LAUSD EVERGREEN ELEM SCHOOL (2730 GANAHL ST in LOS ANGELES, CA)
STATE MASTER (California - Hazardous Waste Tracking) - HAZARDOU WASTE PROGRAM Small Quantity Generators, between 100 kg and 1000 kg of hazardous waste/month (Resource Conservation and Recovery Act (tracking hazardous waste)) - notification Alternative names: EVERGREEN AVENUE ELEMENTARY, LAUSD/ EVERGREEN AVE ELEM
ALLSTAR CLEANERS (8500 W OLIMPIC BLVD in LOS ANGELES, CA)
STATE MASTER (California - Hazardous Waste Tracking) - HAZARDOU WASTE PROGRAM Small Quantity Generators, between 100 kg and 1000 kg of hazardous waste/month (Resource Conservation and Recovery Act (tracking hazardous waste))
LA CLEANERS (1415 S LA CIENEGA BLVD in LOS ANGELES, CA)
STATE MASTER (California - Hazardous Waste Tracking) - HAZARDOU WASTE PROGRAM Small Quantity Generators, between 100 kg and 1000 kg of hazardous waste/month (Resource Conservation and Recovery Act (tracking hazardous waste)) - notification Organizations: FRED GHOLIAN (CONTACT/OWNER)
LOS ANGELES CENTER FOR ENRICHED STUDIES (5931 W. 18TH ST. in LOS ANGELES, CA)
(National Center for Education Statistics) - STATE ID-1932847 Organizations: LOS ANGELES UNIFIED (SCHOOL DISTRICT)
CANFIELD AVENUE ELEMENTARY (9233 AIRDROME ST. in LOS ANGELES, CA)
(National Center for Education Statistics) - STATE ID-6016281 Organizations: LOS ANGELES UNIFIED (SCHOOL DISTRICT)
MASTERS BODY & PAINT (8955 W PICO BLVD in LOS ANGELES, CA)
Small Quantity Generators, between 100 kg and 1000 kg of hazardous waste/month (Resource Conservation and Recovery Act (tracking hazardous waste)) - notification Small Quantity Generators, between 100 kg and 1000 kg of hazardous waste/month (Resource Conservation and Recovery Act (tracking hazardous waste)) - notification Organizations: MARCO GOMEZ (CONTACT/OWNER)
, WILLIAM SHANKS (CONTACT/OWNER)
FRENCH CLEANERS (6014 W PICO BLVD in LOS ANGELES, CA)
Small Quantity Generators, between 100 kg and 1000 kg of hazardous waste/month (Resource Conservation and Recovery Act (tracking hazardous waste)) - notification Organizations: BEDROS LUSBAZON (CONTACT/OWNER)
KNIGHTS AUTO BODY (8630 W PICO BLVD in LOS ANGELES, CA)
Small Quantity Generators, between 100 kg and 1000 kg of hazardous waste/month (Resource Conservation and Recovery Act (tracking hazardous waste)) - notification Organizations: HAMID R BAHER (CONTACT/OWNER)
LA ROBERTSON LIBRARY (1719 S ROBERTSON BLVD in LOS ANGELES, CA)
Small Quantity Generators, between 100 kg and 1000 kg of hazardous waste/month (Resource Conservation and Recovery Act (tracking hazardous waste)) - notification Organizations: CITY OF LOS ANGELES (CONTACT/OWNER)
LONDON CARE CLEANERS (998 S ROBERTSON in LOS ANGELES, CA)
Small Quantity Generators, between 100 kg and 1000 kg of hazardous waste/month (Resource Conservation and Recovery Act (tracking hazardous waste)) - notification Organizations: DAVID DONG SOK CHOI (CONTACT/OWNER)
INTEREARS (1638 SO LACIENEGA in LOS ANGELES, CA)
Small Quantity Generators, between 100 kg and 1000 kg of hazardous waste/month (Resource Conservation and Recovery Act (tracking hazardous waste)) Business NAICS classification: GENERAL AUTOMOTIVE REPAIR.
Housing units lacking complete plumbing facilities: 0.0% Housing units lacking complete kitchen facilities: 2.1%
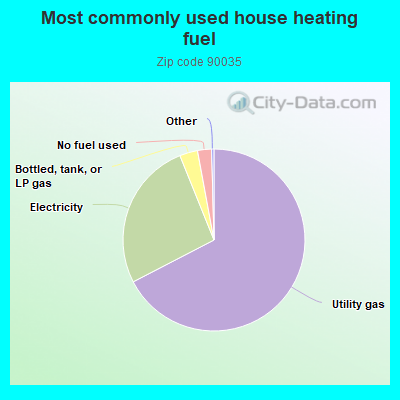
67.4%Utility gas
26.5%Electricity
3.2%Bottled, tank, or LP gas
2.5%No fuel used
Population in 1990: 25,723. Population change in the 1990s: +2,069 (+8.0%).
Place of birth for U.S.-born residents:
This state: 11,806
Northeast: 3,134
Midwest: 1,975
South: 1,892
West: 925
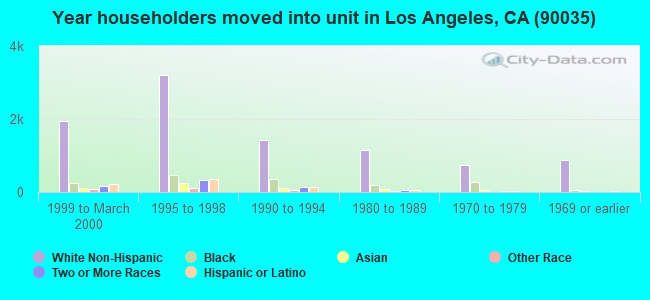
52% of the 90035 zip code residents lived in the same house 5 years ago. Out of people who lived in different houses, 71% lived in this county. Out of people who lived in different counties, 50% lived in California.
88% of the 90035 zip code residents lived in the same house 1 year ago. Out of people who lived in different houses, 62% moved from this county. Out of people who lived in different houses, 8% moved from different county within same state. Out of people who lived in different houses, 24% moved from different state. Out of people who lived in different houses, 4% moved from abroad.
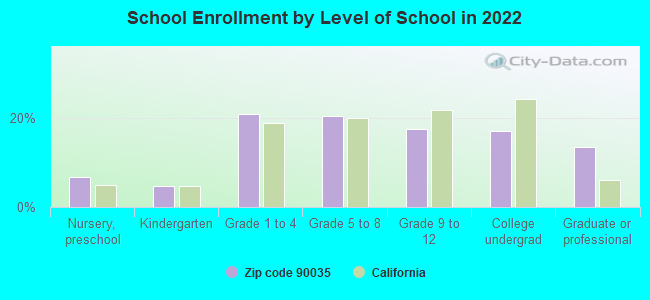
Private vs. public school enrollment:
Students in private schools in grades 1 to 8 (elementary and middle school): 1,395
Here:
64.4%
California:
10.5%
Students in private schools in grades 9 to 12 (high school): 439
Here:
50.0%
California:
8.5%
Students in private undergraduate colleges: 249
Here:
29.0%
California:
15.9%
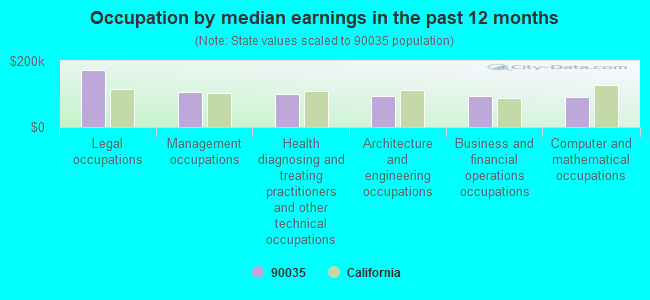
Occupation by median earnings in the past 12 months ($)
174,215Legal occupations
106,556Management occupations
99,890Health diagnosing and treating practitioners and other technical occupations
92,963Architecture and engineering occupations
92,713Business and financial operations occupations
90,443Computer and mathematical occupations
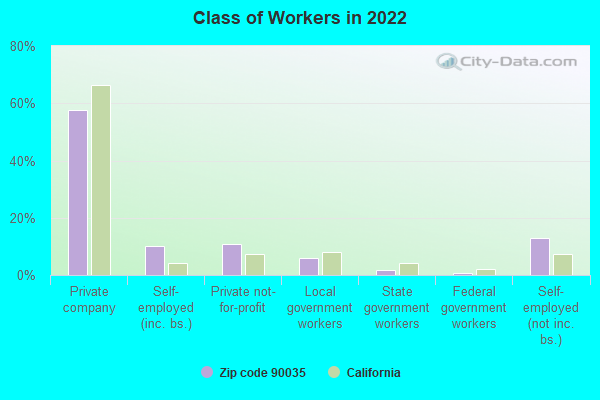
Companies with federal contracts located in this zip code:
TWENTIETH CNTURY FOX FILM CORP (10201 W PICOBLVD in LOS ANGELES, CA) : $6,556,340 in 141 contractsfrom 1999 to 2006
Contracts for Miscellaneous Items, Lease or Rental of Equipment -- Miscellaneous by Department of Defense, American Forces Information Service, Navy Signed by year:2000: $708,346; 2001: $1,525,663; 2002: $1,122,362; 2003: $1,362,544; 2004: $939,990; 2005: $652,695; 2006: $158,425.
Biggest contracts:
$251,970 with Department of Defense for Miscellaneous Items. Signed on 2001-09-10. Completion date: 2002-07-02.
$223,103, same as above.Signed on 2005-12-13. Completion date: 2005-12-15.
$175,973, same as above.Signed on 2003-06-18. Completion date: 2003-08-01.
$168,587 with American Forces Information Service for Miscellaneous Items. Signed on 2005-03-18. Completion date: 2005-07-01.
VESOFT INC (1135 S BEVERLY DR in LOS ANGELES, CA; small business) : $21,835 in 13 contractsfrom 2002 to 2005
Contracts for ADP Software, ADP Facility Operation and Maintenance Services, ADP Input/Output and Storage Devices, Maintenance, Repair and Rebuilding of Equipment -- Miscellaneous by Animal and Plant Health Inspection Service, Food Safety and Inspection Service, ENERGY, Department of, Army, and others Signed by year:2000: $0; 2001: $0; 2002: $2,520; 2003: $3,100; 2004: $6,705; 2005: $9,510; 2006: $0.
Biggest contracts:
$4,855 with Animal and Plant Health Inspection Service for ADP Software. Signed on 2004-10-13. Completion date: 2005-09-30.
$3,660 with Food Safety and Inspection Service for ADP Facility Operation and Maintenance Services. Taking place in DC. Signed on 2005-11-07. Completion date: 2006-10-01.
$3,325 with ENERGY, Department of for ADP Software. Taking place in MD. Signed on 2005-03-16. Completion date: 2005-09-30.
$1,860 with Army for ADP Software. Taking place in UT. Signed on 2005-10-13. Completion date: 2006-09-30.
NEXTCOM, INC (1022 SOUTH LA CIENEGA BLVD in LOS ANGELES, CA; small business)
$4,140 with Army for Maintenance, Repair and Rebuilding of Equipment -- Communication, Detection, and Coherent Radiation Equipment. Signed on 2005-07-20. Completion date: 2006-04-27.
Top industries in this zip code by the number of employees in 2005:
Administrative and Support and Waste Management and Remediation Services: Security Guards and Patrol Services (over 1000 employees: 1 establishment, 50-99 employees: 1 establishment)
2005 - 2018 National Fire Incident Reporting System (NFIRS) incidents
According to the data from the years 2005 - 2018 the average number of fires per year is 65. The highest number of fire incidents - 90 took place in 2005, and the least - 49 in 2014. The data has a decreasing trend.
When looking into fire subcategories, the most incidents belonged to: Structure Fires (64.1%), and Outside Fires (15.9%).
Fire incident types reported to NFIRS in Zip Code 90035

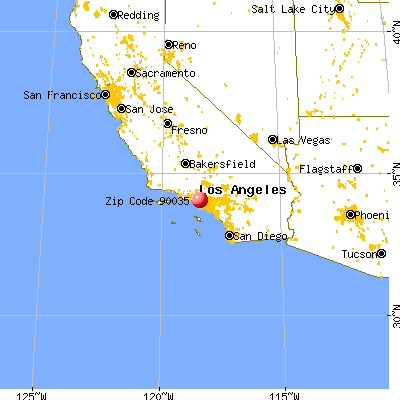


 Nearest zip codes: 90211, 90212, 90048, 90034, 90067, 90232.


 According to the data from the years 2005 - 2018 the average number of fires per year is 65. The highest number of fire incidents - 90 took place in 2005, and the least - 49 in 2014. The data has a decreasing trend.
 When looking into fire subcategories, the most incidents belonged to: Structure Fires (64.1%), and Outside Fires (15.9%).