Estimated zip code population in 2022: 16,513 Zip code population in 2010: 18,116 Zip code population in 2000: 19,614
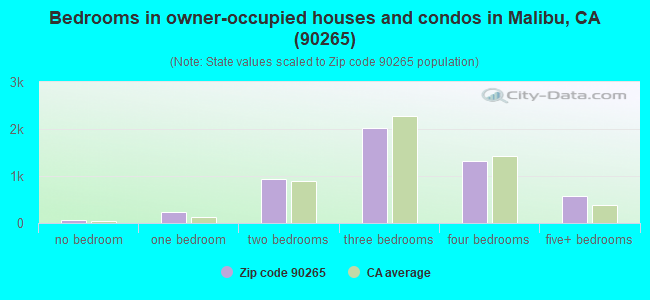
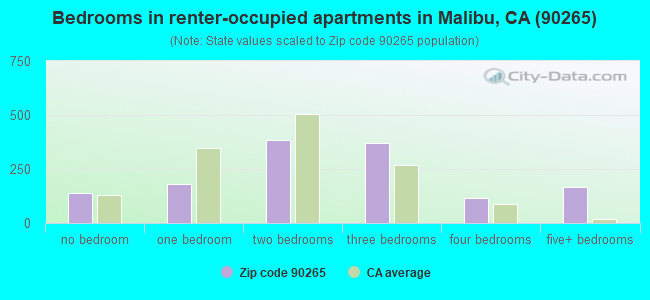
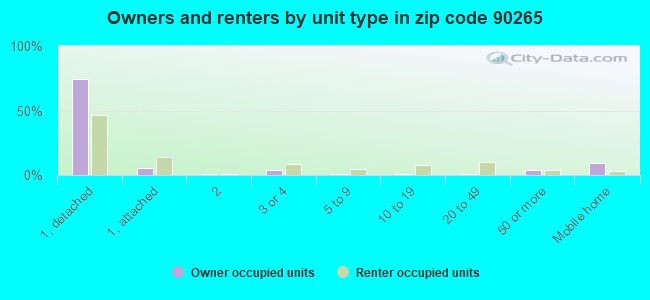
Houses and condos: 9,075 Renter-occupied apartments: 1,343
% of renters here:
21%
State:
44%
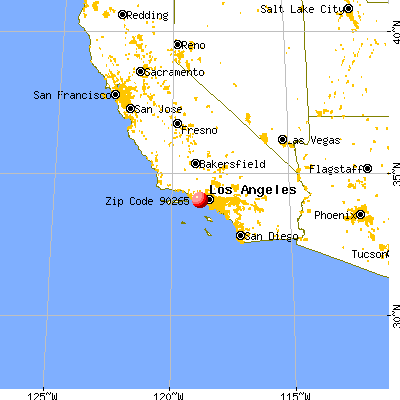
March 2022 cost of living index in zip code 90265: 143.4 (very high, U.S. average is 100)
Land area: 107.8 sq. mi. Water area: 7.3 sq. mi.
Population density: 153 people per square mile
(very low).
OSM Map
General Map
Google Map
MSN Map
OSM Map
General Map
Google Map
MSN Map
OSM Map
General Map
Google Map
MSN Map
OSM Map
General Map
Google Map
MSN Map
Please wait while loading the map...
Real estate property taxes paid for housing units in 2022:
This zip code:
0.5% ($10,292)
California:
0.7% ($4,831)
Median real estate property taxes paid for housing units with mortgages in 2022: $10,330 (0.5%) Median real estate property taxes paid for housing units with no mortgage in 2022: $10,572 (0.5%)
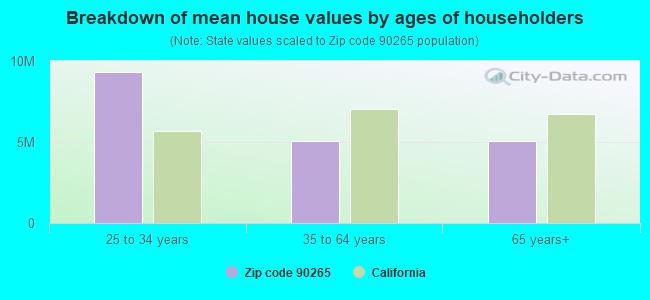
Estimated median house/condo value in 2022: $2,171,698
90265:
$2,171,698
California:
$715,900
According to our research of California and other state lists, there were 3 registered sex offenders living in 90265 zip code as of April 27, 2024. The ratio of all residents to sex offenders in zip code 90265 is 6,219 to 1. The ratio of registered sex offenders to all residents in this zip code is much lower than the state average.
Median resident age:
This zip code:
50.5 years
California median age:
37.9 years
Average household size:
This zip code:
2.4 people
California:
2.8 people
Averages for the 2020 tax year for zip code 90265, filed in 2021:
Average Adjusted Gross Income (AGI) in 2020: $353,107 (Individual Income Tax Returns)
Here:
$353,107
State:
$95,910
Salary/wage: $166,493 (reported on 60.5% of returns)
Here:
$166,493
State:
$77,331
(% of AGI for various income ranges: 1272.9% for AGIs below $25k, 4250.9% for AGIs $25k-50k, 7409.2% for AGIs $50k-75k, 10764.4% for AGIs $75k-100k, 22819.4% for AGIs $100k-200k, 174308.6% for AGIs over 200k)
Taxable interest for individuals: $11,206 (reported on 58.5% of returns)
This zip code:
$11,206
California:
$2,294
(% of AGI for various income ranges: 88.4% for AGIs below $25k, 223.4% for AGIs $25k-50k, 476.8% for AGIs $50k-75k, 499.4% for AGIs $75k-100k, 1061.3% for AGIs $100k-200k, 11964.5% for AGIs over 200k)
Ordinary dividends: $39,633 (reported on 49.3% of returns)
Here:
$39,633
State:
$10,949
(% of AGI for various income ranges: 244.4% for AGIs below $25k, 400.9% for AGIs $25k-50k, 1071.2% for AGIs $50k-75k, 1187.8% for AGIs $75k-100k, 3296.5% for AGIs $100k-200k, 36397.9% for AGIs over 200k)
Net capital gain/loss in AGI: +$156,667 (reported on 48.8% of returns)
Here:
+$156,667
State:
+$49,306
(% of AGI for various income ranges: 171.2% for AGIs below $25k, 443.4% for AGIs $25k-50k, 975.6% for AGIs $50k-75k, 1141.7% for AGIs $75k-100k, 3767.4% for AGIs $100k-200k, 160417.6% for AGIs over 200k)
Profit/loss from business: +$40,936 (reported on 31.9% of returns)
Here:
+$40,936
State:
+$15,671
(% of AGI for various income ranges: 531.6% for AGIs below $25k, 1369.4% for AGIs $25k-50k, 1789.6% for AGIs $50k-75k, 2182.8% for AGIs $75k-100k, 4057.7% for AGIs $100k-200k, 18379.3% for AGIs over 200k)
Taxable individual retirement arrangement distribution: $46,276 (reported on 12.0% of returns)
90265:
$46,276
California:
$23,505
(% of AGI for various income ranges: 56.5% for AGIs below $25k, 259.7% for AGIs $25k-50k, 474.8% for AGIs $50k-75k, 1007.8% for AGIs $75k-100k, 2508.1% for AGIs $100k-200k, 7965.9% for AGIs over 200k)
Self-employed (Keogh) retirement plans: $42,458 (reported on 3.8% of returns)
90265:
$42,458
California:
$30,163
(% of AGI for various income ranges: 98.9% for AGIs $25k-50k, 382.9% for AGIs $100k-200k, 2985.2% for AGIs over 200k)
Total itemized deductions: $66,574 (reported on 34.0% of returns)
Here:
$66,574
State:
$39,517
(% of AGI for various income ranges: 584.7% for AGIs below $25k, 1220.3% for AGIs $25k-50k, 1685.6% for AGIs $50k-75k, 2963.3% for AGIs $75k-100k, 6313.5% for AGIs $100k-200k, 36471.7% for AGIs over 200k)
Charity contributions: $25,210 (reported on 28.1% of returns)
Here:
$25,210
State:
$12,598
(% of AGI for various income ranges: 20.7% for AGIs below $25k, 72.9% for AGIs $25k-50k, 166.8% for AGIs $50k-75k, 323.3% for AGIs $75k-100k, 719.0% for AGIs $100k-200k, 14223.8% for AGIs over 200k)
Taxes paid: $9,136 (reported on 33.5% of returns)
90265:
$9,136
State:
$8,807
(% of AGI for various income ranges: 123.4% for AGIs below $25k, 231.1% for AGIs $25k-50k, 373.2% for AGIs $50k-75k, 604.4% for AGIs $75k-100k, 1389.7% for AGIs $100k-200k, 3928.3% for AGIs over 200k)
Earned income credit: $1,169 (reported on 6.2% of returns)
Here:
$1,169
State:
$2,074
(% of AGI for various income ranges: 47.6% for AGIs below $25k, 37.7% for AGIs $25k-50k)
Percentage of individuals using paid preparers for their 2020 taxes: 92.9%
Here:
93%
State:
92%
(% for various income ranges: 91.5% for AGIs below $25k, 92.8% for AGIs $25k-50k, 93.3% for AGIs $50k-75k, 91.7% for AGIs $75k-100k, 93.6% for AGIs $100k-200k, 94.1% for AGIs over 200k)
Averages for the 2012 tax year for zip code 90265, filed in 2013:
Average Adjusted Gross Income (AGI) in 2012: $295,315 (Individual Income Tax Returns)
Here:
$295,315
State:
$72,726
Salary/wage: $160,441 (reported on 64.9% of returns)
Here:
$160,441
State:
$59,079
(% of AGI for various income ranges: 53.2% for AGIs below $25k, 57.0% for AGIs $25k-50k, 50.9% for AGIs $50k-75k, 49.2% for AGIs $75k-100k, 50.8% for AGIs $100k-200k, 32.3% for AGIs over 200k)
Taxable interest for individuals: $13,044 (reported on 58.3% of returns)
This zip code:
$13,044
California:
$2,146
(% of AGI for various income ranges: 3.6% for AGIs below $25k, 2.8% for AGIs $25k-50k, 2.5% for AGIs $50k-75k, 3.1% for AGIs $75k-100k, 2.8% for AGIs $100k-200k, 2.5% for AGIs over 200k)
Ordinary dividends: $28,861 (reported on 45.5% of returns)
Here:
$28,861
State:
$9,308
(% of AGI for various income ranges: 7.3% for AGIs below $25k, 5.4% for AGIs $25k-50k, 5.4% for AGIs $50k-75k, 4.9% for AGIs $75k-100k, 5.1% for AGIs $100k-200k, 4.3% for AGIs over 200k)
Net capital gain/loss in AGI: +$125,439 (reported on 46.0% of returns)
Here:
+$125,439
State:
+$30,460
(% of AGI for various income ranges: 0.4% for AGIs below $25k, 1.6% for AGIs $25k-50k, 2.5% for AGIs $50k-75k, 2.0% for AGIs $75k-100k, 3.3% for AGIs $100k-200k, 22.6% for AGIs over 200k)
Profit/loss from business: +$34,394 (reported on 33.1% of returns)
Here:
+$34,394
State:
+$17,064
(% of AGI for various income ranges: 25.7% for AGIs below $25k, 16.0% for AGIs $25k-50k, 13.4% for AGIs $50k-75k, 9.0% for AGIs $75k-100k, 9.8% for AGIs $100k-200k, 2.3% for AGIs over 200k)
Taxable individual retirement arrangement distribution: $43,049 (reported on 15.2% of returns)
90265:
$43,049
California:
$19,557
(% of AGI for various income ranges: 4.9% for AGIs below $25k, 4.1% for AGIs $25k-50k, 5.9% for AGIs $50k-75k, 5.7% for AGIs $75k-100k, 6.5% for AGIs $100k-200k, 1.5% for AGIs over 200k)
Self-employment retirement plans: $41,517 (reported on 4.1% of returns)
90265:
$41,517
California:
$24,530
(% of AGI for various income ranges: 0.8% for AGIs below $25k, 0.9% for AGIs $50k-75k, 1.3% for AGIs $100k-200k, 0.5% for AGIs over 200k)
Total itemized deductions: $86,589 (18% of AGI, reported on 59.4% of returns)
Here:
$86,589
State:
$34,004
Here:
18.3% of AGI
State:
22.7% of AGI
(% of AGI for various income ranges: 42.2% for AGIs below $25k, 28.7% for AGIs $25k-50k, 28.7% for AGIs $50k-75k, 28.4% for AGIs $75k-100k, 26.2% for AGIs $100k-200k, 15.4% for AGIs over 200k)
Charity contributions: $14,985 (reported on 50.5% of returns)
Here:
$14,985
State:
$4,659
(% of AGI for various income ranges: 1.4% for AGIs below $25k, 1.7% for AGIs $25k-50k, 2.2% for AGIs $50k-75k, 2.5% for AGIs $75k-100k, 2.3% for AGIs $100k-200k, 2.6% for AGIs over 200k)
Taxes paid: $45,770 (reported on 59.0% of returns)
90265:
$45,770
State:
$14,448
(% of AGI for various income ranges: 10.5% for AGIs below $25k, 9.0% for AGIs $25k-50k, 8.4% for AGIs $50k-75k, 9.4% for AGIs $75k-100k, 10.5% for AGIs $100k-200k, 9.0% for AGIs over 200k)
Earned income credit: $1,294 (reported on 7.1% of returns)
Here:
$1,294
State:
$2,286
(% of AGI for various income ranges: 2.3% for AGIs below $25k, 0.4% for AGIs $25k-50k)
Percentage of individuals using paid preparers for their 2012 taxes: 76.3%
Here:
76%
State:
64%
(% for various income ranges: 65.6% for AGIs below $25k, 71.4% for AGIs $25k-50k, 79.2% for AGIs $50k-75k, 76.4% for AGIs $75k-100k, 81.5% for AGIs $100k-200k, 88.1% for AGIs over 200k)
Averages for the 2004 tax year for zip code 90265, filed in 2005:
Average Adjusted Gross Income (AGI) in 2004: $190,906 (Individual Income Tax Returns)
Here:
$190,906
State:
$58,600
Salary/wage: $126,730 (reported on 64.0% of returns)
Here:
$126,730
State:
$49,455
(% of AGI for various income ranges: 55.8% for AGIs $10k-25k, 58.0% for AGIs $25k-50k, 55.5% for AGIs $50k-75k, 55.9% for AGIs $75k-100k, 38.0% for AGIs over 100k)
Taxable interest for individuals: $14,642 (reported on 67.0% of returns)
This zip code:
$14,642
California:
$2,365
(% of AGI for various income ranges: 6.9% for AGIs $10k-25k, 4.5% for AGIs $25k-50k, 4.6% for AGIs $50k-75k, 3.7% for AGIs $75k-100k, 4.5% for AGIs over 100k)
Taxable dividends: $34,816 (reported on 50.9% of returns)
Here:
$34,816
State:
$4,746
(% of AGI for various income ranges: 6.6% for AGIs $10k-25k, 4.1% for AGIs $25k-50k, 4.2% for AGIs $50k-75k, 3.7% for AGIs $75k-100k, 9.2% for AGIs over 100k)
Net capital gain/loss: +$63,191 (reported on 50.2% of returns)
Here:
+$63,191
State:
+$23,418
(% of AGI for various income ranges: 0.5% for AGIs $10k-25k, 3.1% for AGIs $25k-50k, 4.1% for AGIs $50k-75k, 4.4% for AGIs $75k-100k, 17.1% for AGIs over 100k)
Profit/loss from business: +$33,058 (reported on 32.8% of returns)
Here:
+$33,058
State:
+$16,826
(% of AGI for various income ranges: 21.1% for AGIs $10k-25k, 15.2% for AGIs $25k-50k, 12.2% for AGIs $50k-75k, 10.8% for AGIs $75k-100k, 4.4% for AGIs over 100k)
IRA payment deduction: $3,851 (reported on 4.1% of returns)
90265:
$3,851
California:
$3,192
(% of AGI for various income ranges: 0.4% for AGIs $10k-25k, 0.4% for AGIs $25k-50k, 0.3% for AGIs $50k-75k, 0.3% for AGIs $75k-100k, 0.0% for AGIs over 100k)
Self-employed pension: $30,071 (reported on 5.3% of returns)
Here:
$30,071
California:
$17,688
(% of AGI for various income ranges: 0.4% for AGIs $10k-25k, 0.5% for AGIs $25k-50k, 0.9% for AGIs $50k-75k, 0.9% for AGIs $75k-100k, 0.8% for AGIs over 100k)
Total itemized deductions: $69,838 (21% of AGI, reported on 58.9% of returns)
Here:
$69,838
State:
$28,113
Here:
21.5% of AGI
State:
25.3% of AGI
(% of AGI for various income ranges: 43.2% for AGIs $10k-25k, 29.7% for AGIs $25k-50k, 31.7% for AGIs $50k-75k, 33.4% for AGIs $75k-100k, 18.8% for AGIs over 100k)
Charity contributions deductions: $9,709 (3% of AGI, reported on 52.3% of returns)
Here:
$9,709
State:
$3,923
Here:
2.8% of AGI
State:
3.3% of AGI
(% of AGI for various income ranges: 2.7% for AGIs $10k-25k, 2.4% for AGIs $25k-50k, 3.0% for AGIs $50k-75k, 2.8% for AGIs $75k-100k, 2.5% for AGIs over 100k)
Total tax: $54,670 (reported on 80.9% of returns)
90265:
$54,670
State:
$10,761
(% of AGI for various income ranges: 7.1% for AGIs $10k-25k, 9.3% for AGIs $25k-50k, 10.9% for AGIs $50k-75k, 11.2% for AGIs $75k-100k, 23.3% for AGIs over 100k)
Earned income credit: $967 (reported on 6.1% of returns)
Here:
$967
State:
$1,763
Percentage of individuals using paid preparers for their 2004 taxes: 77.8%
Here:
78%
State:
66%
(% for various income ranges: 73.0% for AGIs below $10k, 70.3% for AGIs $10k-25k, 71.6% for AGIs $25k-50k, 77.0% for AGIs $50k-75k, 80.6% for AGIs $75k-100k, 86.5% for AGIs over 100k)
Likely homosexual households (counted as self-reported same-sex unmarried-partner households)
Lesbian couples: 0.6% of all households
Gay men: 0.2% of all households
Household received Food Stamps/SNAP in the past 12 months: 89 Household did not receive Food Stamps/SNAP in the past 12 months: 6,226
Women who had a birth in the past 12 months: 139 (46 now married, 95 unmarried) Women who did not have a birth in the past 12 months: 3,431 (1,183 now married, 2,255 unmarried)
Housing units in zip code 90265 with a mortgage: 3,126 (612 second mortgage, 14 home equity loan, 511 both second mortgage and home equity loan) Houses without a mortgage: 71
Median monthly owner costs for units with a mortgage: $3,876 Median monthly owner costs for units without a mortgage: $1,556
Residents with income below the poverty level in 2022:
This zip code:
8.3%
Whole state:
12.2%
Residents with income below 50% of the poverty level in 2022:
This zip code:
1.1%
Whole state:
6.2%
Median number of rooms in houses and condos:
Here:
6.2
State:
6.0
Median number of rooms in apartments:
Here:
5.1
State:
3.9
Notable locations in this zip code not listed on our city pages
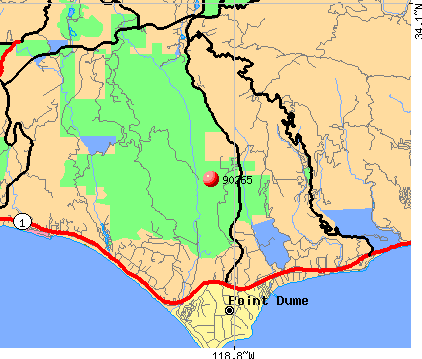
Parks in zip code 90265 include: Point Mugu State Park (1), Leo Carrillo State Park (2), Robert H Meyer Memorial State Beach (3), Leo Carrillo State Park (4), Zuma Beach County Park (5), Santa Monica Mountains National Recreation Area (6), Dan Blocker Beach (7), El Matador State Beach (8), El Pescador State Beach (9). Display/hide their locations on the map
Beaches: Carbon Beach (A), Encinal Beach (B), Malibu Beach (C), Las Tunas Beach (D), Puerco Beach (E), Amarillo Beach (F), Escondido Beach (G), Corral Beach (H), Topanga Beach (I). Display/hide their locations on the map
2,087 married couples with children.
618 single-parent households (362 men, 256 women).
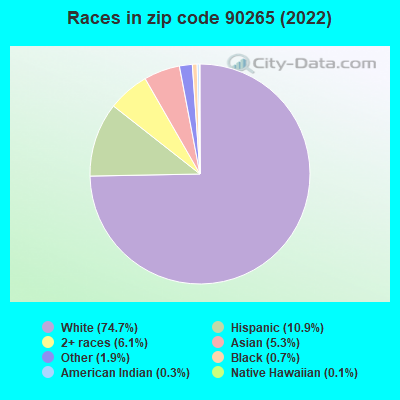
81.3% of residents of 90265 zip code speak English at home.
7.1% of residents speak Spanish at home (82% very well, 13% well, 4% not well, 1% not at all).
8.2% of residents speak other Indo-European language at home (84% very well, 16% well).
3.3% of residents speak Asian or Pacific Island language at home (64% very well, 30% well, 5% not well).
0.6% of residents speak other language at home (100% very well).
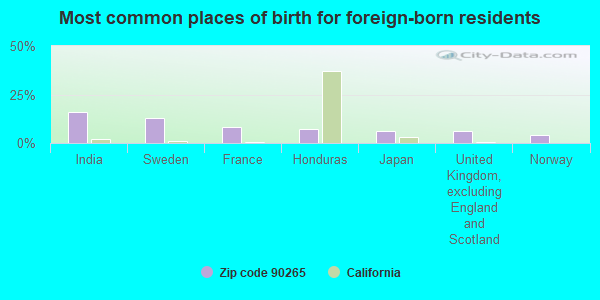
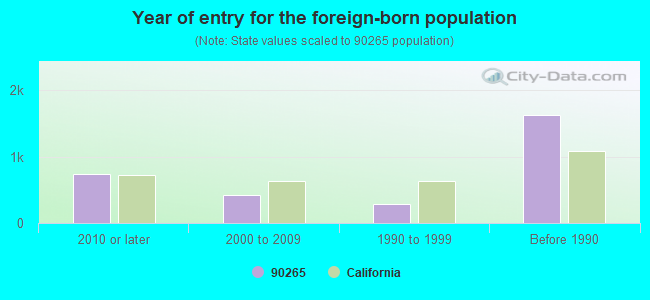
Foreign born population: 2,747 (16.6%) (76.4% of them are naturalized citizens)
This zip code:
16.6%
Whole state:
26.7%
16%India
13%Sweden
8%France
7%Honduras
6%Japan
6%United Kingdom, excluding England and Scotland
4%Norway
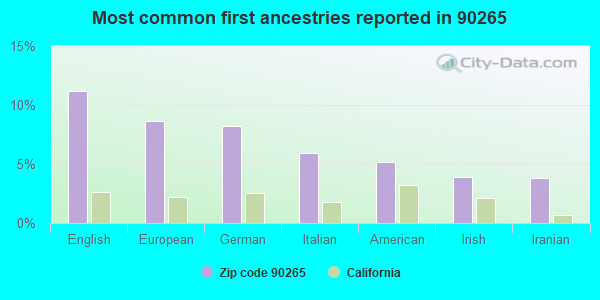
11%English
9%European
8%German
6%Italian
5%American
4%Irish
4%Iranian
Year of entry for the foreign-born population
7382010 or later
4262000 to 2009
2821990 to 1999
1,627Before 1990
Major facilities with environmental interests located in this zip code:
HUGHES RESEARCH LABORATORIES INCORPORATED (3011 MALIBU CANYON ROAD in MALIBU, CA)
STATE MASTER (California - Hazardous Waste Tracking) - HAZARDOU WASTE PROGRAM CRITERIA AND HAZARDOUS AIR POLLUTANT INVENTORY (Inventory of air pollution sources) HAZARDOUS WASTE BIENNIAL REPORTER (Resource Conservation and Recovery Act (tracking hazardous waste)) Large Quantity Generators, more that 1000 kg of hazardous waste/month (Resource Conservation and Recovery Act (tracking hazardous waste)) - notification TSD (Resource Conservation and Recovery Act (tracking hazardous waste)) - notification Business SIC classification: COMMERCIAL PHYSICAL AND BIOLOGICAL RESEARCH Organizations: HRL LABORATORIES, LLC (CONTACT/OPERATOR)
Alternative names: BOEING ELECTRON DYNAMIC DEVICES INC, H R L LABORATORIES LIMITED LIABILITY COMPANY, HRL LABORATORIES LLC
J PAUL GETTY VILLA MUSEUM JOBSITE OFFICE (17985 PACIFIC COAST HWY in MALIBU, CA)
STATE MASTER (California - Hazardous Waste Tracking) - HAZARDOU WASTE PROGRAM Small Quantity Generators, between 100 kg and 1000 kg of hazardous waste/month (Resource Conservation and Recovery Act (tracking hazardous waste)) - notification Small Quantity Generators, between 100 kg and 1000 kg of hazardous waste/month (Resource Conservation and Recovery Act (tracking hazardous waste)) Business NAICS classification: COMMERCIAL AND INSTITUTIONAL BUILDING CONSTRUCTION. Organizations: MORLEY CONSTRUCTION (CONTACT/OPERATOR)
, THE J PAUL GETTY TRUST (CONTACT/OWNER)
, J PAUL GETTY TRUST (CONTACT/OWNER)
Alternative names: THE J PAUL GETTY MUSEUM, J PAUL GETTY TRUST THE
A 1 ZUMA CLEANERS (29575 PACIFIC COAST HWY in MALIBU, CA)
STATE MASTER (California - Hazardous Waste Tracking) - HAZARDOU WASTE PROGRAM Small Quantity Generators, between 100 kg and 1000 kg of hazardous waste/month (Resource Conservation and Recovery Act (tracking hazardous waste)) - notification Organizations: JUNG SUNG (CONTACT/OWNER)
CALTRANS DISTRICT 7 (3503 LAS FLORES CYN RD in MALIBU, CA) . Federal Facility
STATE MASTER (California - Hazardous Waste Tracking) - HAZARDOU WASTE PROGRAM Small Quantity Generators, between 100 kg and 1000 kg of hazardous waste/month (Resource Conservation and Recovery Act (tracking hazardous waste)) - notification Alternative names: LAS FLORES MAINTENANCE STA, LAS FOLRES MAINTENANCE STA
CHEVRON STATION 97213 (23641 PACIFIC COAST HWY in MALIBU, CA)
STATE MASTER (California - Hazardous Waste Tracking) - HAZARDOU WASTE PROGRAM Small Quantity Generators, between 100 kg and 1000 kg of hazardous waste/month (Resource Conservation and Recovery Act (tracking hazardous waste)) - notification Organizations: CHEVRON USA PRODUCTS INC (CONTACT/OWNER)
Alternative names: CHEVRON 97213
CHEVRON STATION NO 93357 (30811 PACIFIC COAST HWY in MALIBU, CA)
STATE MASTER (California - Hazardous Waste Tracking) - HAZARDOU WASTE PROGRAM Small Quantity Generators, between 100 kg and 1000 kg of hazardous waste/month (Resource Conservation and Recovery Act (tracking hazardous waste)) - notification Organizations: CHEVRON PRODUCTS CO (CONTACT/OWNER)
CHEVRON STATION NO 97774 (23614 PACIFIC COAST HWY in MALIBU, CA)
STATE MASTER (California - Hazardous Waste Tracking) - HAZARDOU WASTE PROGRAM Small Quantity Generators, between 100 kg and 1000 kg of hazardous waste/month (Resource Conservation and Recovery Act (tracking hazardous waste)) - notification Organizations: CHEVRON PRODUCTS CO (CONTACT/OWNER)
MALIBU HIGH (30215 MORNINGVIEW DR. in MALIBU, CA)
(National Center for Education Statistics) - STATE ID-1995737 Organizations: SANTA MONICA-MALIBU UNIFIED (SCHOOL DISTRICT)
CABRILLO (JUAN) ELEMENTARY (30237 MORNINGVIEW DR. in MALIBU, CA)
(National Center for Education Statistics) - STATE ID-6022537 Organizations: SANTA MONICA-MALIBU UNIFIED (SCHOOL DISTRICT)
GENERAL TELEPHONE OF CA (22211 PACIFIC COAST HWY in MALIBU, CA)
(Resource Conservation and Recovery Act (tracking hazardous waste)) Organizations: GENERAL TELEPHONE CA (CONTACT/OWNER)
MALIBU MESA WWRP, NPDES (3963 MALIBU COUNTRY RD in MALIBU, CA)
National Pollutant Discharge Elimination System NON-MAJOR (Tracking pollutant discharge elimination systems) - permit Business SIC classification: SEWERAGE SYSTEMS Organizations: LOS ANGELES COUNTY DPW (CONTACT/OWNER)
Alternative names: LOS ANGELES COUNTY DPW
CALTRANS (18541 PACIFIC COAST HWY in MALIBU, CA)
Small Quantity Generators, between 100 kg and 1000 kg of hazardous waste/month (Resource Conservation and Recovery Act (tracking hazardous waste)) - notification Small Quantity Generators, between 100 kg and 1000 kg of hazardous waste/month (Resource Conservation and Recovery Act (tracking hazardous waste)) - notification Organizations: CALIFORNIA D O T CALTRANS (CONTACT/OWNER)
EUPHORIA MALIBU INC (23823 W MALIBU RD #100 in MALIBU, CA)
Small Quantity Generators, between 100 kg and 1000 kg of hazardous waste/month (Resource Conservation and Recovery Act (tracking hazardous waste)) - notification Organizations: JANET & TOM BIRCH (CONTACT/OWNER)
Housing units lacking complete plumbing facilities: 0.7% Housing units lacking complete kitchen facilities: 1.3%
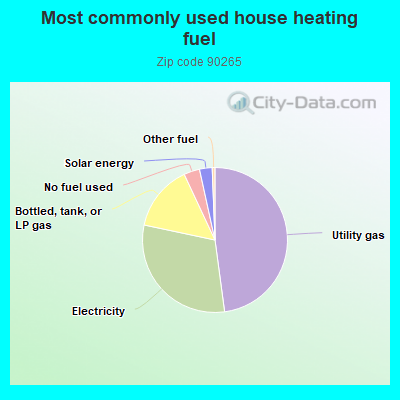
47.5%Utility gas
30.2%Electricity
14.6%Bottled, tank, or LP gas
3.5%No fuel used
2.8%Solar energy
0.6%Other fuel
Population in 1990: 17,850. Population change in the 1990s: +1,764 (+9.9%).
Place of birth for U.S.-born residents:
This state: 8,146
Northeast: 1,700
Midwest: 1,887
South: 872
West: 711
52% of the 90265 zip code residents lived in the same house 5 years ago. Out of people who lived in different houses, 63% lived in this county. Out of people who lived in different counties, 50% lived in California.
87% of the 90265 zip code residents lived in the same house 1 year ago. Out of people who lived in different houses, 57% moved from this county. Out of people who lived in different houses, 16% moved from different county within same state. Out of people who lived in different houses, 24% moved from different state. Out of people who lived in different houses, 1% moved from abroad.
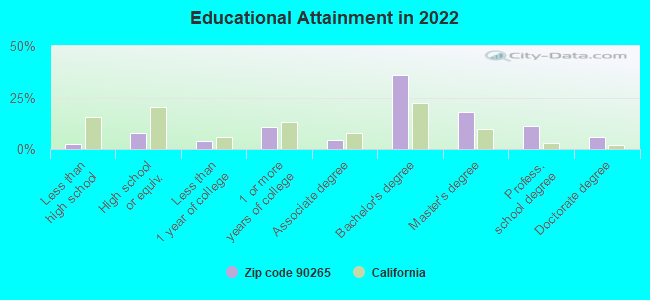
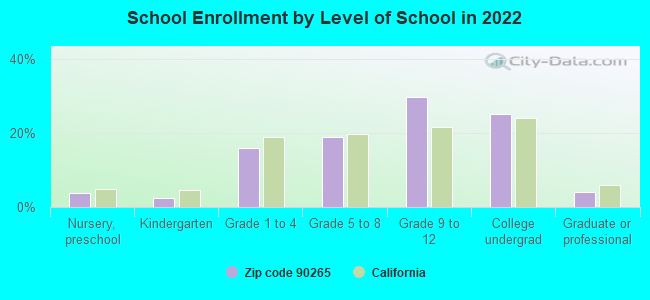
Private vs. public school enrollment:
Students in private schools in grades 1 to 8 (elementary and middle school): 655
Here:
48.0%
California:
10.5%
Students in private schools in grades 9 to 12 (high school): 369
Here:
32.6%
California:
8.5%
Students in private undergraduate colleges: 463
Here:
47.8%
California:
15.9%
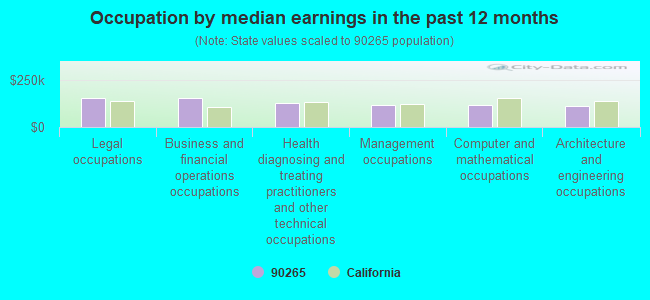
Occupation by median earnings in the past 12 months ($)
157,549Legal occupations
156,558Business and financial operations occupations
130,697Health diagnosing and treating practitioners and other technical occupations
119,245Management occupations
118,955Computer and mathematical occupations
115,330Architecture and engineering occupations
Companies with biggest federal contracts located in this zip code (MALIBU, CA):
HRL LABORATORIES, LLC (3011 MALIBU CANYON ROAD) : $112,837,184 in 223 contractsfrom 1999 to 2006
Contracts for Miscellaneous Defense Hard Goods -- Advanced Development (R&D), Other Defense -- Applied Research and Exploratory Development (R&D), Defense Electronics and Communication Equipment -- Applied Research and Exploratory Development (R&D), Other Defense -- Advanced Development (R&D), and moreby Navy, Department of Defense, Air Force, Army, and others Signed by year:2000: $15,254,131; 2001: $15,916,168; 2002: $20,039,911; 2003: $24,973,966; 2004: $22,707,715; 2005: $5,540,515; 2006: $4,182,217.
Biggest contracts:
$2,636,000 with Navy for Miscellaneous Defense Hard Goods -- Advanced Development (R&D). Signed on 2002-04-16. Completion date: 2005-06-28.
$2,446,468 with Department of Defense for Other Defense -- Applied Research and Exploratory Development (R&D). Signed on 2003-03-14. Completion date: 2004-03-31.
$2,302,574 with Air Force for Defense Electronics and Communication Equipment -- Applied Research and Exploratory Development (R&D). Signed on 2004-06-03. Completion date: 2007-10-30.
$2,250,000 with Air Force for Other Defense -- Advanced Development (R&D). Signed on 1999-12-22. Completion date: 2003-04-22.
CHAINER DAVID C (CHAINER-LEGAT CMR) : $600,167 in 6 contractsfrom 2002 to 2006
Contracts for Personal Services Contracts by Departmental Offices Signed by year:2000: $0; 2001: $0; 2002: $131,000; 2003: $0; 2004: $156,523; 2005: $142,271; 2006: $170,373.
Biggest contracts:
$170,373 with Departmental Offices for Personal Services Contracts. Taking place in DC. Signed on 2006-02-10. Effective on 2006-02-11. Completion date: 2007-02-10.
$156,523, same as above.Signed on 2004-02-05. Effective on 2004-02-11. Completion date: 2005-02-10.
$142,271, same as above.Signed on 2005-02-16. Completion date: 2006-02-10.
$131,000, same as above.Signed on 2002-01-15. Completion date: 2003-02-15.
RENMARK PACIFIC CORPORATION (2155 MC REYNOLDS RD; small business)
$551,550 with Defense Logistics Agency for Maintenance, Repair and Rebuilding of Equipment -- Materials Handling Equipment. Signed on 2004-09-15. Completion date: 2005-09-15.
DR ANTHONY PAUL CIERVO (24564 PIUMA ROAD; small business) : $198,962 in 4 contractsfrom 2001 to 2005
$96,222 with Navy for Other Defense -- Management and Support (R&D). Signed on 2001-04-30. Completion date: 2001-10-31.
$50,240 with Navy for Other Defense -- Advanced Development (R&D). Signed on 2002-08-27. Completion date: 2004-07-31.
$40,000 with Navy for Other Defense -- Applied Research and Exploratory Development (R&D). Signed on 2003-07-22. Completion date: 2004-07-31.
$12,500, same as above.Signed on 2005-07-23. Completion date: 2006-12-31.
J-LAB COMPANY (31258 BAILARD RD; small business) : $120,900 in 2 contractsin 2002
$83,700 with Navy for Electrical and Electronic assemblies, Boards, Cards, and Associated Hardware. Signed on 2002-05-17. Completion date: 2002-07-30.
$37,200, same as above.Signed on 2002-07-16. Completion date: 2002-09-30.
THE DOCUMEDIA GROUP, LLC (18106 WAKECREST DRIVE; small business) : $76,048 in 2 contractsfrom 2002 to 2004
$45,318 with Department of Defense for Miscellaneous Items. Signed on 2002-04-11. Completion date: 2002-05-01.
$30,730 with American Forces Information Service for Miscellaneous Items. Signed on 2004-02-05. Completion date: 2004-03-01.
AVIANCE GROUP (32111 MULHOLLAND HWY; small business) : $63,024 in 2 contractsfrom 1999 to 2000
$34,800 with Air Force for Maintenance, Repair and Rebuilding of Equipment -- Aircraft and Airframe Structural Components. Signed on 1999-10-01. Completion date: 1999-12-31.
$28,224 with Navy for Maintenance, Repair and Rebuilding of Equipment -- Aircraft and Airframe Structural Components. Signed on 2000-03-30. Completion date: 2000-06-30.
MILES AUTOMOTIVE GROUP, LTD (24955 PACIFIC COAST HWY ST; small business)
$27,100 with Air Force for Passenger Motor Vehicles. Signed on 2005-09-30. Completion date: 2005-12-30.
WIDGETS, INC (9550 YERBA BUENA RD) : $18,705 in 2 contractsfrom 2004 to 2005
$11,600 with Army for ADP Support Equipment. Signed on 2004-04-14. Completion date: 2004-04-23.
$7,105 with Navy for ADP Components. Signed on 2005-04-29. Completion date: 2005-05-03.
KRINGS, KENT JOHN (31518 ANACAPA VIEW DR; small business)
$6,174 with Army for Outerwear, Men's. Taking place in NJ. Signed on 2004-09-07. Completion date: 2004-10-08.
Top industries in this zip code by the number of employees in 2005:
Educational Services: Colleges, Universities, and Professional Schools (over 1000 employees: 1 establishment)
Administrative and Support and Waste Management and Remediation Services: Employment Placement Agencies (500-999: 1, 5-9: 1, 1-4: 2)
Professional, Scientific, and Technical Services: Research and Development in the Physical, Engineering, and Life Sciences (250-499: 1, 100-249: 1, 1-4: 3)
Arts, Entertainment, and Recreation: Independent Artists, Writers, and Performers (100-249: 1, 20-49: 4, 5-9: 3, 1-4: 68)
2005 - 2018 National Fire Incident Reporting System (NFIRS) incidents
According to the data from the years 2005 - 2018 the average number of fire incidents per year is 9. The highest number of fire incidents - 25 took place in 2007, and the least - 1 in 2006. The data has a rising trend.
When looking into fire subcategories, the most incidents belonged to: Outside Fires (40.0%), and Other (36.0%).
Fire incident types reported to NFIRS in Zip Code 90265


 Nearest zip codes: 91361, 91301, 91362, 90263, 91377, 91320.


 According to the data from the years 2005 - 2018 the average number of fire incidents per year is 9. The highest number of fire incidents - 25 took place in 2007, and the least - 1 in 2006. The data has a rising trend.
 When looking into fire subcategories, the most incidents belonged to: Outside Fires (40.0%), and Other (36.0%).