Estimated zip code population in 2022: 43,771 Zip code population in 2010: 44,274 Zip code population in 2000: 37,775
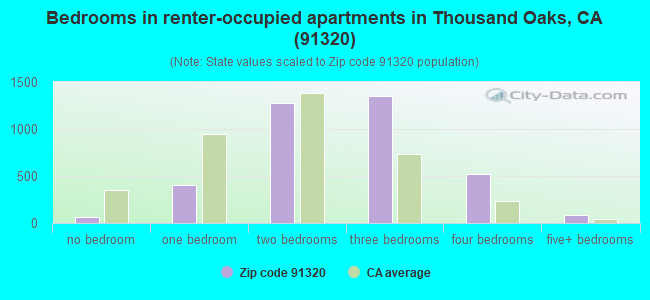
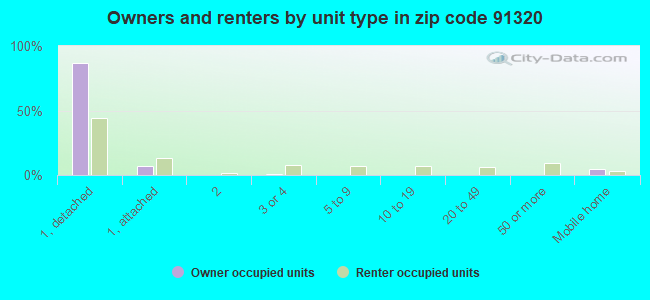
Houses and condos: 15,814 Renter-occupied apartments: 3,705
% of renters here:
24%
State:
44%
March 2022 cost of living index in zip code 91320: 92.8 (less than average, U.S. average is 100)
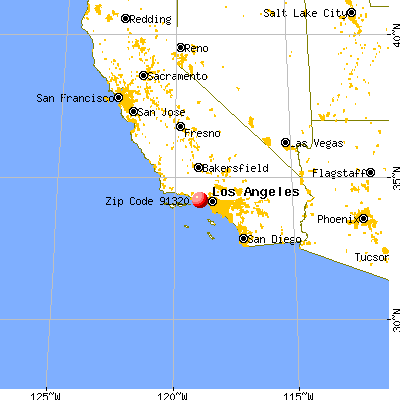
Land area: 18.3 sq. mi. Water area: 0.0 sq. mi.
Population density: 2,398 people per square mile
(low).
OSM Map
General Map
Google Map
MSN Map
OSM Map
General Map
Google Map
MSN Map
OSM Map
General Map
Google Map
MSN Map
OSM Map
General Map
Google Map
MSN Map
Please wait while loading the map...
Real estate property taxes paid for housing units in 2022:
This zip code:
0.7% ($6,516)
California:
0.7% ($4,831)
Median real estate property taxes paid for housing units with mortgages in 2022: $7,103 (0.7%) Median real estate property taxes paid for housing units with no mortgage in 2022: $4,676 (0.5%)
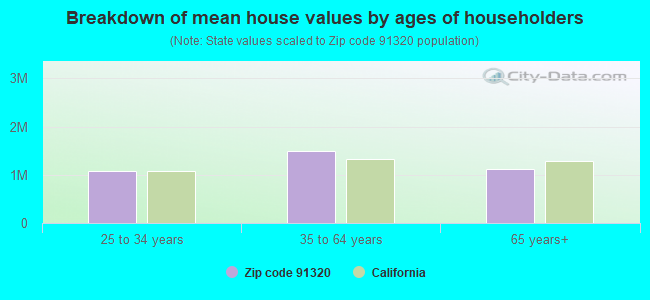
Estimated median house/condo value in 2022: $960,433
91320:
$960,433
California:
$715,900
According to our research of California and other state lists, there were 25 registered sex offenders living in 91320 zip code as of April 27, 2024. The ratio of all residents to sex offenders in zip code 91320 is 1,846 to 1. The ratio of registered sex offenders to all residents in this zip code is much lower than the state average.
Median resident age:
This zip code:
43.6 years
California median age:
37.9 years
Average household size:
This zip code:
2.8 people
California:
2.8 people
Averages for the 2020 tax year for zip code 91320, filed in 2021:
Average Adjusted Gross Income (AGI) in 2020: $121,526 (Individual Income Tax Returns)
Here:
$121,526
State:
$95,910
Salary/wage: $107,450 (reported on 78.3% of returns)
Here:
$107,450
State:
$77,331
(% of AGI for various income ranges: 1222.6% for AGIs below $25k, 4005.5% for AGIs $25k-50k, 7177.0% for AGIs $50k-75k, 9973.3% for AGIs $75k-100k, 20789.3% for AGIs $100k-200k, 100480.0% for AGIs over 200k)
Taxable interest for individuals: $1,833 (reported on 49.0% of returns)
This zip code:
$1,833
California:
$2,294
(% of AGI for various income ranges: 33.6% for AGIs below $25k, 66.0% for AGIs $25k-50k, 88.0% for AGIs $50k-75k, 166.2% for AGIs $75k-100k, 201.3% for AGIs $100k-200k, 923.7% for AGIs over 200k)
Ordinary dividends: $8,771 (reported on 35.6% of returns)
Here:
$8,771
State:
$10,949
(% of AGI for various income ranges: 56.8% for AGIs below $25k, 96.1% for AGIs $25k-50k, 186.1% for AGIs $50k-75k, 355.1% for AGIs $75k-100k, 561.4% for AGIs $100k-200k, 4414.2% for AGIs over 200k)
Net capital gain/loss in AGI: +$26,749 (reported on 32.9% of returns)
Here:
+$26,749
State:
+$49,306
(% of AGI for various income ranges: 36.0% for AGIs below $25k, 90.0% for AGIs $25k-50k, 140.7% for AGIs $50k-75k, 314.0% for AGIs $75k-100k, 821.7% for AGIs $100k-200k, 16180.4% for AGIs over 200k)
Profit/loss from business: +$19,162 (reported on 19.4% of returns)
Here:
+$19,162
State:
+$15,671
(% of AGI for various income ranges: 165.9% for AGIs below $25k, 290.7% for AGIs $25k-50k, 517.1% for AGIs $50k-75k, 523.8% for AGIs $75k-100k, 819.7% for AGIs $100k-200k, 3678.1% for AGIs over 200k)
Taxable individual retirement arrangement distribution: $24,374 (reported on 11.7% of returns)
91320:
$24,374
California:
$23,505
(% of AGI for various income ranges: 100.2% for AGIs below $25k, 187.6% for AGIs $25k-50k, 367.2% for AGIs $50k-75k, 697.1% for AGIs $75k-100k, 1083.6% for AGIs $100k-200k, 1693.8% for AGIs over 200k)
Self-employed (Keogh) retirement plans: $21,809 (reported on 1.5% of returns)
91320:
$21,809
California:
$30,163
(% of AGI for various income ranges: 45.2% for AGIs $50k-75k, 63.8% for AGIs $100k-200k, 507.2% for AGIs over 200k)
Total itemized deductions: $36,615 (reported on 26.6% of returns)
Here:
$36,615
State:
$39,517
(% of AGI for various income ranges: 197.5% for AGIs below $25k, 377.6% for AGIs $25k-50k, 896.0% for AGIs $50k-75k, 1570.9% for AGIs $75k-100k, 2920.1% for AGIs $100k-200k, 9973.6% for AGIs over 200k)
Charity contributions: $8,694 (reported on 23.3% of returns)
Here:
$8,694
State:
$12,598
(% of AGI for various income ranges: 8.7% for AGIs below $25k, 33.3% for AGIs $25k-50k, 90.5% for AGIs $50k-75k, 147.3% for AGIs $75k-100k, 423.1% for AGIs $100k-200k, 3014.8% for AGIs over 200k)
Taxes paid: $9,016 (reported on 26.6% of returns)
91320:
$9,016
State:
$8,807
(% of AGI for various income ranges: 33.5% for AGIs below $25k, 80.6% for AGIs $25k-50k, 217.4% for AGIs $50k-75k, 429.8% for AGIs $75k-100k, 858.4% for AGIs $100k-200k, 2164.1% for AGIs over 200k)
Earned income credit: $1,665 (reported on 6.5% of returns)
Here:
$1,665
State:
$2,074
(% of AGI for various income ranges: 46.9% for AGIs below $25k, 40.0% for AGIs $25k-50k)
Percentage of individuals using paid preparers for their 2020 taxes: 93.1%
Here:
93%
State:
92%
(% for various income ranges: 91.4% for AGIs below $25k, 92.6% for AGIs $25k-50k, 93.6% for AGIs $50k-75k, 93.8% for AGIs $75k-100k, 93.8% for AGIs $100k-200k, 94.7% for AGIs over 200k)
Averages for the 2012 tax year for zip code 91320, filed in 2013:
Average Adjusted Gross Income (AGI) in 2012: $100,550 (Individual Income Tax Returns)
Here:
$100,550
State:
$72,726
Salary/wage: $90,217 (reported on 81.8% of returns)
Here:
$90,217
State:
$59,079
(% of AGI for various income ranges: 73.2% for AGIs below $25k, 69.4% for AGIs $25k-50k, 69.5% for AGIs $50k-75k, 71.4% for AGIs $75k-100k, 77.6% for AGIs $100k-200k, 71.9% for AGIs over 200k)
Taxable interest for individuals: $1,542 (reported on 49.9% of returns)
This zip code:
$1,542
California:
$2,146
(% of AGI for various income ranges: 1.6% for AGIs below $25k, 1.0% for AGIs $25k-50k, 0.9% for AGIs $50k-75k, 0.8% for AGIs $75k-100k, 0.6% for AGIs $100k-200k, 0.7% for AGIs over 200k)
Ordinary dividends: $5,299 (reported on 33.2% of returns)
Here:
$5,299
State:
$9,308
(% of AGI for various income ranges: 2.5% for AGIs below $25k, 1.5% for AGIs $25k-50k, 1.8% for AGIs $50k-75k, 1.7% for AGIs $75k-100k, 1.3% for AGIs $100k-200k, 2.0% for AGIs over 200k)
Net capital gain/loss in AGI: +$15,838 (reported on 30.4% of returns)
Here:
+$15,838
State:
+$30,460
(% of AGI for various income ranges: 0.1% for AGIs below $25k, 0.1% for AGIs $25k-50k, 0.2% for AGIs $50k-75k, 0.4% for AGIs $75k-100k, 0.9% for AGIs $100k-200k, 10.0% for AGIs over 200k)
Profit/loss from business: +$20,696 (reported on 19.9% of returns)
Here:
+$20,696
State:
+$17,064
(% of AGI for various income ranges: 10.2% for AGIs below $25k, 8.2% for AGIs $25k-50k, 6.0% for AGIs $50k-75k, 4.4% for AGIs $75k-100k, 3.9% for AGIs $100k-200k, 2.9% for AGIs over 200k)
Taxable individual retirement arrangement distribution: $21,312 (reported on 12.1% of returns)
91320:
$21,312
California:
$19,557
(% of AGI for various income ranges: 4.0% for AGIs below $25k, 4.2% for AGIs $25k-50k, 4.0% for AGIs $50k-75k, 3.8% for AGIs $75k-100k, 3.1% for AGIs $100k-200k, 1.4% for AGIs over 200k)
Self-employment retirement plans: $18,563 (reported on 1.7% of returns)
91320:
$18,563
California:
$24,530
(% of AGI for various income ranges: 0.3% for AGIs $50k-75k, 0.3% for AGIs $75k-100k, 0.3% for AGIs $100k-200k, 0.4% for AGIs over 200k)
Total itemized deductions: $36,119 (22% of AGI, reported on 53.6% of returns)
Here:
$36,119
State:
$34,004
Here:
22.5% of AGI
State:
22.7% of AGI
(% of AGI for various income ranges: 18.8% for AGIs below $25k, 17.4% for AGIs $25k-50k, 20.9% for AGIs $50k-75k, 22.2% for AGIs $75k-100k, 21.9% for AGIs $100k-200k, 16.9% for AGIs over 200k)
Charity contributions: $3,736 (reported on 47.2% of returns)
Here:
$3,736
State:
$4,659
(% of AGI for various income ranges: 1.0% for AGIs below $25k, 1.4% for AGIs $25k-50k, 1.8% for AGIs $50k-75k, 1.9% for AGIs $75k-100k, 2.0% for AGIs $100k-200k, 1.6% for AGIs over 200k)
Taxes paid: $14,964 (reported on 53.4% of returns)
91320:
$14,964
State:
$14,448
(% of AGI for various income ranges: 3.3% for AGIs below $25k, 3.9% for AGIs $25k-50k, 5.5% for AGIs $50k-75k, 6.8% for AGIs $75k-100k, 8.3% for AGIs $100k-200k, 9.2% for AGIs over 200k)
Earned income credit: $1,778 (reported on 7.6% of returns)
Here:
$1,778
State:
$2,286
(% of AGI for various income ranges: 2.9% for AGIs below $25k, 0.7% for AGIs $25k-50k)
Percentage of individuals using paid preparers for their 2012 taxes: 61.7%
Here:
62%
State:
64%
(% for various income ranges: 53.2% for AGIs below $25k, 62.7% for AGIs $25k-50k, 64.3% for AGIs $50k-75k, 65.2% for AGIs $75k-100k, 65.5% for AGIs $100k-200k, 69.5% for AGIs over 200k)
Averages for the 2004 tax year for zip code 91320, filed in 2005:
Average Adjusted Gross Income (AGI) in 2004: $81,728 (Individual Income Tax Returns)
Here:
$81,728
State:
$58,600
Salary/wage: $77,929 (reported on 83.8% of returns)
Here:
$77,929
State:
$49,455
(% of AGI for various income ranges: 71.9% for AGIs $10k-25k, 74.2% for AGIs $25k-50k, 75.9% for AGIs $50k-75k, 81.0% for AGIs $75k-100k, 79.8% for AGIs over 100k)
Taxable interest for individuals: $1,622 (reported on 60.9% of returns)
This zip code:
$1,622
California:
$2,365
(% of AGI for various income ranges: 3.3% for AGIs $10k-25k, 1.7% for AGIs $25k-50k, 1.5% for AGIs $50k-75k, 1.1% for AGIs $75k-100k, 0.9% for AGIs over 100k)
Taxable dividends: $2,600 (reported on 35.9% of returns)
Here:
$2,600
State:
$4,746
(% of AGI for various income ranges: 2.0% for AGIs $10k-25k, 1.5% for AGIs $25k-50k, 1.1% for AGIs $50k-75k, 1.0% for AGIs $75k-100k, 1.0% for AGIs over 100k)
Net capital gain/loss: +$12,221 (reported on 33.2% of returns)
Here:
+$12,221
State:
+$23,418
(% of AGI for various income ranges: -0.1% for AGIs $10k-25k, 0.1% for AGIs $25k-50k, 0.6% for AGIs $50k-75k, 1.0% for AGIs $75k-100k, 7.1% for AGIs over 100k)
Profit/loss from business: +$18,259 (reported on 20.5% of returns)
Here:
+$18,259
State:
+$16,826
(% of AGI for various income ranges: 9.2% for AGIs $10k-25k, 8.8% for AGIs $25k-50k, 6.0% for AGIs $50k-75k, 5.0% for AGIs $75k-100k, 3.5% for AGIs over 100k)
IRA payment deduction: $3,479 (reported on 4.0% of returns)
91320:
$3,479
California:
$3,192
(% of AGI for various income ranges: 0.3% for AGIs $10k-25k, 0.4% for AGIs $25k-50k, 0.2% for AGIs $50k-75k, 0.3% for AGIs $75k-100k, 0.1% for AGIs over 100k)
Self-employed pension: $14,009 (reported on 2.3% of returns)
Here:
$14,009
California:
$17,688
(% of AGI for various income ranges: 0.2% for AGIs $25k-50k, 0.3% for AGIs $50k-75k, 0.4% for AGIs $75k-100k, 0.4% for AGIs over 100k)
Total itemized deductions: $31,721 (25% of AGI, reported on 57.6% of returns)
Here:
$31,721
State:
$28,113
Here:
25.3% of AGI
State:
25.3% of AGI
(% of AGI for various income ranges: 21.4% for AGIs $10k-25k, 25.0% for AGIs $25k-50k, 26.0% for AGIs $50k-75k, 26.7% for AGIs $75k-100k, 20.4% for AGIs over 100k)
Charity contributions deductions: $3,541 (3% of AGI, reported on 53.3% of returns)
Here:
$3,541
State:
$3,923
Here:
2.7% of AGI
State:
3.3% of AGI
(% of AGI for various income ranges: 1.5% for AGIs $10k-25k, 2.2% for AGIs $25k-50k, 2.5% for AGIs $50k-75k, 2.6% for AGIs $75k-100k, 2.2% for AGIs over 100k)
Total tax: $14,631 (reported on 82.0% of returns)
91320:
$14,631
State:
$10,761
(% of AGI for various income ranges: 4.9% for AGIs $10k-25k, 7.4% for AGIs $25k-50k, 8.9% for AGIs $50k-75k, 9.5% for AGIs $75k-100k, 17.6% for AGIs over 100k)
Earned income credit: $1,485 (reported on 6.5% of returns)
Here:
$1,485
State:
$1,763
Percentage of individuals using paid preparers for their 2004 taxes: 64.1%
Here:
64%
State:
66%
(% for various income ranges: 52.2% for AGIs below $10k, 61.2% for AGIs $10k-25k, 66.1% for AGIs $25k-50k, 67.7% for AGIs $50k-75k, 68.0% for AGIs $75k-100k, 68.4% for AGIs over 100k)
Likely homosexual households (counted as self-reported same-sex unmarried-partner households)
Lesbian couples: 0.1% of all households
Gay men: 0.0% of all households
Household received Food Stamps/SNAP in the past 12 months: 675 Household did not receive Food Stamps/SNAP in the past 12 months: 14,373
Women who had a birth in the past 12 months: 611 (451 now married, 159 unmarried) Women who did not have a birth in the past 12 months: 8,583 (4,217 now married, 4,331 unmarried)
Housing units in zip code 91320 with a mortgage: 8,324 (935 second mortgage, 51 home equity loan, 795 both second mortgage and home equity loan) Houses without a mortgage: 221
Median monthly owner costs for units with a mortgage: $3,312 Median monthly owner costs for units without a mortgage: $876
Residents with income below the poverty level in 2022:
This zip code:
6.9%
Whole state:
12.2%
Residents with income below 50% of the poverty level in 2022:
This zip code:
3.0%
Whole state:
6.2%
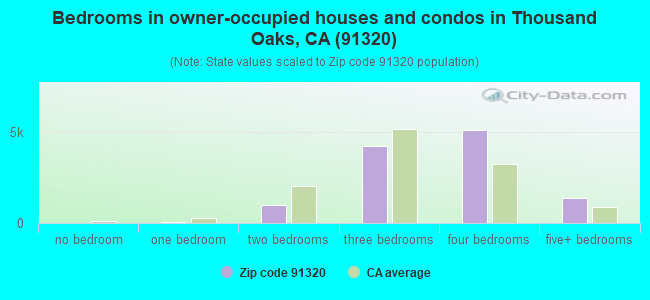
Median number of rooms in houses and condos:
Here:
6.9
State:
6.0
Median number of rooms in apartments:
Here:
4.8
State:
3.9
Notable locations in this zip code not listed on our city pages
Notable locations in zip code 91320: Stage Coach Inn Museum (A), Newbury Park Library (B), Borchard Community Center (C), Ventura County Fire Protection District Station 35 Newbury Park (D), Ventura County Fire Protection District Station 32 Potrero (E). Display/hide their locations on the map
Shopping Centers: Newbury Park Shopping Center (1), Jeffries Center Shopping Center (2), Newbury Square Shopping Center (3), Lucky and Longs Shopping Center (4), Casa Conejo Plaza Shopping Center (5). Display/hide their locations on the map
Churches in zip code 91320 include: Christ the King Lutheran Church (A), Conejo Valley Church of the Nazarene (B), Evangelical Free Church of the Conejo Valley (C), First Christian Church of Newbury Park (D), King of Glory Lutheran Church (E), Seventh Day Adventist Church (F), Kingdom Hall of Jehovahs Witnesses (G). Display/hide their locations on the map
Parks in zip code 91320 include: Banyan Park (1), Borchard Community Park (2), Cypress Park (3), Hickory Park (4), Peppertree Playfield (5), Potrero Open Space (6), Rancho Conejo Open Space (7), Wendy Park (8), Hope Nature Preserve (9). Display/hide their locations on the map
Tourist attraction (not listed on the city page) : Conejo Valley Historical Society (Cultural Attractions- Events- & Facilities; 51 South Ventu Park Road) (1). Display/hide its approximate location on the map
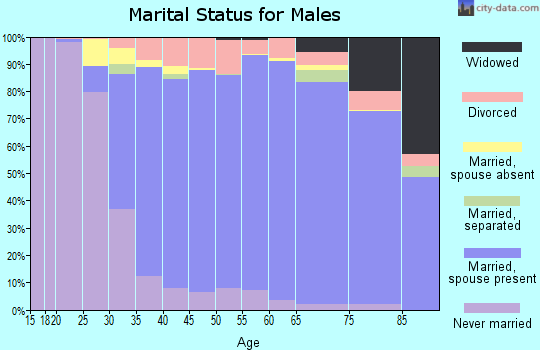
7,711 married couples with children.
1,271 single-parent households (531 men, 740 women).
75.6% of residents of 91320 zip code speak English at home.
12.6% of residents speak Spanish at home (65% very well, 11% well, 16% not well, 7% not at all).
4.6% of residents speak other Indo-European language at home (82% very well, 13% well, 5% not well).
6.2% of residents speak Asian or Pacific Island language at home (66% very well, 20% well, 10% not well, 4% not at all).
0.7% of residents speak other language at home (93% very well, 7% well).
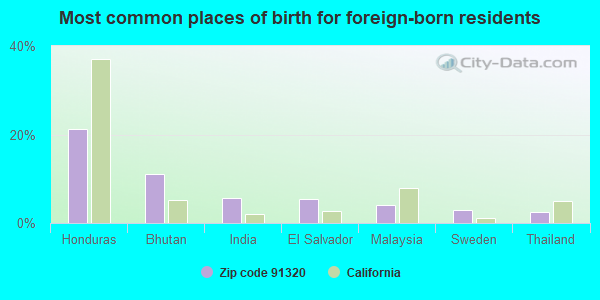
Foreign born population: 8,356 (19.1%) (59.0% of them are naturalized citizens)
This zip code:
19.1%
Whole state:
26.7%
21%Honduras
11%Bhutan
6%India
5%El Salvador
4%Malaysia
3%Sweden
3%Thailand
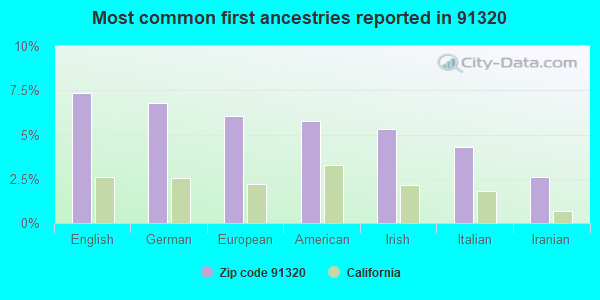
7%English
7%German
6%European
6%American
5%Irish
4%Italian
3%Iranian
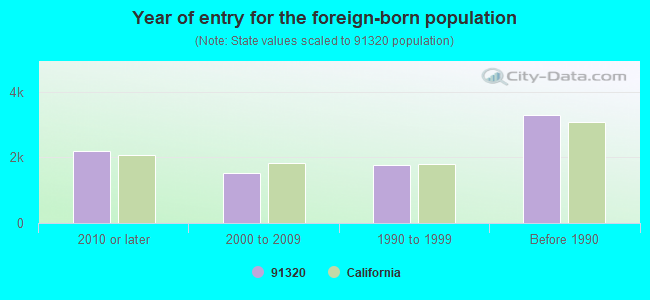
Year of entry for the foreign-born population
2,1812010 or later
1,5122000 to 2009
1,7791990 to 1999
3,286Before 1990
Major facilities with environmental interests located in this zip code:
AMGEN, INCORPORATED (2495 TELLER ROAD in THOUSAND OAKS, CA)
STATE MASTER (California - Hazardous Waste Tracking) - HAZARDOU WASTE PROGRAM HAZARDOUS WASTE BIENNIAL REPORTER (Resource Conservation and Recovery Act (tracking hazardous waste)) - ICIS-, ENFORCEMENT/COMPLIANCE ACTIVITY Large Quantity Generators, more that 1000 kg of hazardous waste/month (Resource Conservation and Recovery Act (tracking hazardous waste)) - ICIS-, ENFORCEMENT/COMPLIANCE ACTIVITY Business NAICS classification: PHARMACEUTICAL PREPARATION MANUFACTURING. Organizations: AMGEN INC (CONTACT/OPERATOR)
AMPLICA INCORPORATED (950 LAWRENCE DRIVE in NEWBURY PARK, CA)
AIR MINOR (AIRS/AFS) (Integrated Compliance Information System) - ICIS-09-2000-0037, FORMAL ENFORCEMENT ACTION CRITERIA AND HAZARDOUS AIR POLLUTANT INVENTORY (Inventory of air pollution sources) Small Quantity Generators, between 100 kg and 1000 kg of hazardous waste/month (Resource Conservation and Recovery Act (tracking hazardous waste)) Business SIC classification: RADIO AND TELEVISION BROADCASTING AND COMMUNICATIONS EQUIPMENT; ELECTRONIC COMPONENTS
NORTHROP CORPORATION - VENTURA DIVISION (1515 RANCHO CONEJO BOULEVARD in NEWBURY PARK, CA)
STATE MASTER (California - Hazardous Waste Tracking) - HAZARDOU WASTE PROGRAM CRITERIA AND HAZARDOUS AIR POLLUTANT INVENTORY (Inventory of air pollution sources) HAZARDOUS WASTE BIENNIAL REPORTER (Resource Conservation and Recovery Act (tracking hazardous waste)) Small Quantity Generators, between 100 kg and 1000 kg of hazardous waste/month (Resource Conservation and Recovery Act (tracking hazardous waste)) - notification TRI REPORTER (Tracking of toxic chemicals releasing facilities) Business SIC classification: AIRCRAFT PARTS AND AUXILIARY EQUIPMENT Organizations: NORTHROP GRUMMAN CORP (CONTACT/OWNER)
Alternative names: NORTHROP CORP. AIRCRAFT DIV., NORTHROP GRUMMAN CORPORATION NEWBURY PARK SITE, NORTHROP GRUMMAN NEWBURY PARK
JW MANUFACTURING (2517 AZURITE CIR in NEWBURY PARK, CA)
STATE MASTER (California - Hazardous Waste Tracking) - HAZARDOU WASTE PROGRAM Small Quantity Generators, between 100 kg and 1000 kg of hazardous waste/month (Resource Conservation and Recovery Act (tracking hazardous waste)) - notification Organizations: JACOB WOOD (CONTACT/OWNER)
MRC TECHNOLOGIES INC (3537 OLD CONEJO RD in NEWBURY PARK, CA)
STATE MASTER (California - Hazardous Waste Tracking) - HAZARDOU WASTE PROGRAM TRANSPORTER (Resource Conservation and Recovery Act (tracking hazardous waste))
CHEVRON STATION NO 97256 (2290 BORCHARD in NEWBURY PARK, CA)
STATE MASTER (California - Hazardous Waste Tracking) - HAZARDOU WASTE PROGRAM CRITERIA AND HAZARDOUS AIR POLLUTANT INVENTORY (Inventory of air pollution sources) Small Quantity Generators, between 100 kg and 1000 kg of hazardous waste/month (Resource Conservation and Recovery Act (tracking hazardous waste)) - notification Business SIC classification: GASOLINE SERVICE STATIONS Organizations: CHEVRON PRODUCTS CO (CONTACT/OWNER)
ADVANCED METAL PRODUCTS INC (830 TOURMALINE DR in NEWBURY PARK, CA)
STATE MASTER (California - Hazardous Waste Tracking) - HAZARDOU WASTE PROGRAM Small Quantity Generators, between 100 kg and 1000 kg of hazardous waste/month (Resource Conservation and Recovery Act (tracking hazardous waste)) - notification
C M P DISPLAY SYSTEMS INC (2490 TURQUOISE CIR in NEWBURY PARK, CA)
STATE MASTER (California - Hazardous Waste Tracking) - HAZARDOU WASTE PROGRAM Small Quantity Generators, between 100 kg and 1000 kg of hazardous waste/month (Resource Conservation and Recovery Act (tracking hazardous waste)) - notification Business NAICS classification: ALL OTHER PLASTICS PRODUCT MANUFACTURING.
K E CURTIS CONSTRUCTION CO INC (1400 OLD CONEJO RD in NEWBURY PARK, CA)
STATE MASTER (California - Hazardous Waste Tracking) - HAZARDOU WASTE PROGRAM Small Quantity Generators, between 100 kg and 1000 kg of hazardous waste/month (Resource Conservation and Recovery Act (tracking hazardous waste))
MAPLE ELEMENTARY (3501 KIMBER DR. in NEWBURY PARK, CA)
(National Center for Education Statistics) - STATE ID-6055909 Organizations: CONEJO VALLEY UNIFIED (SCHOOL DISTRICT)
MANZANITA ELEMENTARY (2626 MICHAEL DR. in NEWBURY PARK, CA)
(National Center for Education Statistics) - STATE ID-6055883 Organizations: CONEJO VALLEY UNIFIED (SCHOOL DISTRICT)
NEWBURY PARK HIGH (456 N. REINO ROAD in NEWBURY PARK, CA)
(National Center for Education Statistics) - STATE ID-5633748 Organizations: CONEJO VALLEY UNIFIED (SCHOOL DISTRICT)
NEWBURY PARK FEED (735 WENDY DRIVE in NEWBURY PARK, CA)
(Integrated Compliance Information System) - ICIS-09-2004-0076, FORMAL ENFORCEMENT ACTION COMPLIANCE ACTIVITY (Tracking inspections of insecticide, fungicide, and rodenticide, and toxic substances)
Housing units lacking complete plumbing facilities: 0.2% Housing units lacking complete kitchen facilities: 0.7%
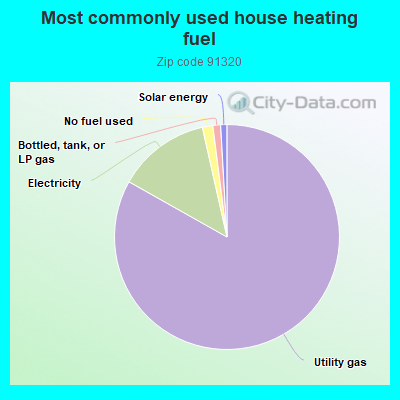
83.0%Utility gas
13.3%Electricity
1.5%No fuel used
1.1%Bottled, tank, or LP gas
0.9%Solar energy
Population in 1990: 31,941. Population change in the 1990s: +5,834 (+18.3%).
Place of birth for U.S.-born residents:
This state: 24,844
Northeast: 2,981
Midwest: 3,426
South: 2,253
West: 1,374
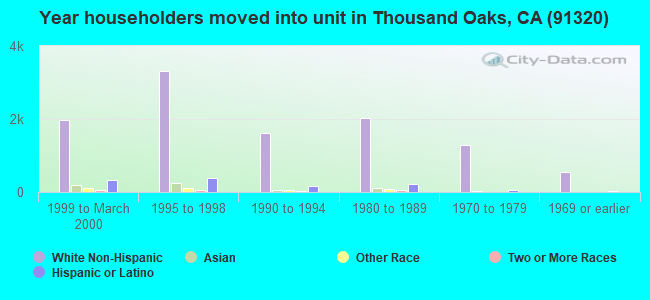
52% of the 91320 zip code residents lived in the same house 5 years ago. Out of people who lived in different houses, 51% lived in this county. Out of people who lived in different counties, 50% lived in California.
94% of the 91320 zip code residents lived in the same house 1 year ago. Out of people who lived in different houses, 53% moved from this county. Out of people who lived in different houses, 22% moved from different county within same state. Out of people who lived in different houses, 22% moved from different state. Out of people who lived in different houses, 7% moved from abroad.
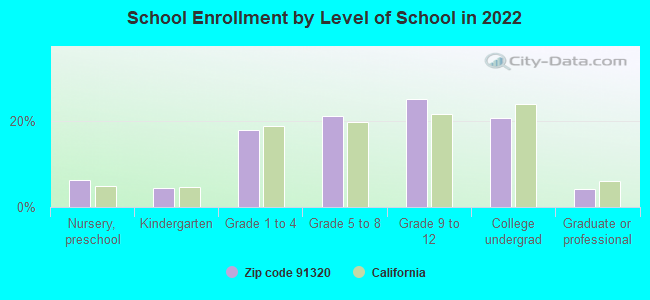
Private vs. public school enrollment:
Students in private schools in grades 1 to 8 (elementary and middle school): 643
Here:
14.6%
California:
10.5%
Students in private schools in grades 9 to 12 (high school): 324
Here:
11.5%
California:
8.5%
Students in private undergraduate colleges: 326
Here:
14.0%
California:
15.9%
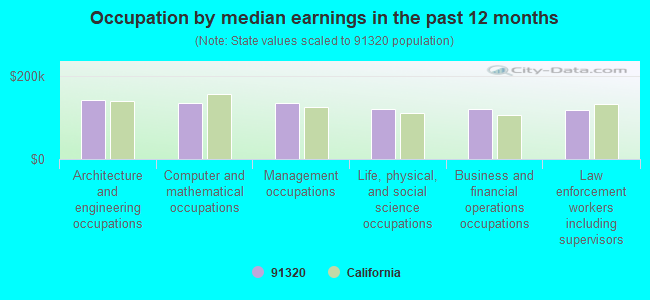
Occupation by median earnings in the past 12 months ($)
141,280Architecture and engineering occupations
136,270Computer and mathematical occupations
134,682Management occupations
121,808Life, physical, and social science occupations
120,034Business and financial operations occupations
118,214Law enforcement workers including supervisors
Companies with biggest federal contracts located in this zip code:
J W MANUFACTURING, INC (2517 AZURITE CIRCLE in NEWBURY PARK, CA; small business) : $2,473,071 in 248 contractsfrom 2000 to 2006
Contracts for Bolts, Packing and Gasket Materials, Screws, Guns, 75 mm through 125 mm, and moreby Defense Logistics Agency, Air Force Signed by year:2000: $348,450; 2001: $419,023; 2002: $161,911; 2003: $29,160; 2004: $270,738; 2005: $882,855; 2006: $360,934.
Biggest contracts:
$77,062 with Defense Logistics Agency for Bolts. Signed on 2000-11-20. Completion date: 2000-11-28.
$63,470, same as above.Signed on 2001-04-17. Completion date: 2001-07-28.
$60,881, same as above.Signed on 2002-02-12. Completion date: 2002-06-12.
$60,320, same as above.Signed on 2004-06-14. Completion date: 2004-06-14.
CAP WIRELESS INC (3235 GRANDE VISTA DR in NEWBURY PARK, CA; small business) : $2,094,418 in 21 contractsfrom 2002 to 2006
Contracts for Defense Electronics and Communication Equipment -- Operational Systems Development (R&D), Amplifiers, Defense Electronics and Communication Equipment -- Management and Support (R&D), Miscellaneous Electrical and Electronic Components by Air Force, Navy, Army Signed by year:2000: $0; 2001: $0; 2002: $86,250; 2003: $111,870; 2004: $381,223; 2005: $965,100; 2006: $549,975.
Biggest contracts:
$750,000 with Air Force for Defense Electronics and Communication Equipment -- Operational Systems Development (R&D). Signed on 2005-04-29. Completion date: 2007-02-12.
$375,000, same as above.Signed on 2006-03-30. Completion date: 2007-02-12.
$95,925 with Navy for Amplifiers. Taking place in NY. Signed on 2006-04-05. Completion date: 2006-10-05.
$95,819 with Air Force for Defense Electronics and Communication Equipment -- Management and Support (R&D). Signed on 2004-05-04. Completion date: 2005-01-17.
C M P DISPLAY SYSTEMS, INC (2490 TURQUOISE CIR in NEWBURY PARK, CA; small business) : $1,203,601 in 111 contractsfrom 2000 to 2006
Contracts for Miscellaneous Aircraft Accessories and Components, Electric Vehicular Lights and Fixtures, Miscellaneous Fire Control Equipment, Gas Turbines and Jet Engines, Aircraft; Prime Moving, and Components, and moreby Navy, Defense Logistics Agency, Army Signed by year:2000: $150,440; 2001: $136,700; 2002: $50,464; 2003: $55,970; 2004: $88,111; 2005: $470,454; 2006: $251,462.
Biggest contracts:
$150,440 with Navy for Miscellaneous Aircraft Accessories and Components. Signed on 2000-08-04. Completion date: 2001-07-20.
$65,280 with Defense Logistics Agency for Electric Vehicular Lights and Fixtures. Signed on 2001-10-03. Completion date: 2002-10-03.
$47,600, same as above.Signed on 2002-03-19. Completion date: 2002-11-13.
$40,050 with Defense Logistics Agency for Miscellaneous Fire Control Equipment. Signed on 2005-02-14. Completion date: 2005-09-04.
WFI GOVERNMENT SERVICES,INC (2630 LAVERY CT STE D in NEWBURY PARK, CA) : $1,107,280 in 5 contractsfrom 2000 to 2005
Contracts for Launchers, Guided Missile, Relays and Solenoids, Miscellaneous Electric Power and Distribution Equipment by Air Force, Defense Logistics Agency, Navy Signed by year:2000: $35,700; 2001: $0; 2002: $25,560; 2003: $1,017,600; 2004: $0; 2005: $28,420; 2006: $0.
Biggest contracts:
$1,017,600 with Air Force for Launchers, Guided Missile. Signed on 2003-09-24. Completion date: 2004-08-02.
$35,700 with Defense Logistics Agency for Relays and Solenoids. Signed on 2000-09-28. Completion date: 2001-01-26.
$25,560 with Defense Logistics Agency for Launchers, Guided Missile. Signed on 2002-01-14. Completion date: 2002-04-14.
$23,750 with Navy for Miscellaneous Electric Power and Distribution Equipment. Signed on 2005-03-23. Completion date: 2005-07-21.
VECTOR TEST SYSTEMS (2033 YELLOWTHROAT PL in THOUSAND OAKS, CA; small business) : $1,064,041 in 9 contractsfrom 2003 to 2006
Contracts for Other Medical -- Basic Research (R&D), Biomedical -- Basic Research (R&D), In Vitro Diagnostic Substances, Reagents, Test Kits, and Sets by Army Signed by year:2000: $0; 2001: $0; 2002: $0; 2003: $69,600; 2004: $448,902; 2005: $430,659; 2006: $114,880.
Biggest contracts:
$398,902 with Army for Other Medical -- Basic Research (R&D). Signed on 2004-11-18. Completion date: 2004-07-11.
$331,043, same as above.Signed on 2005-12-08. Completion date: 2004-07-11.
$99,880 with Army for Biomedical -- Basic Research (R&D). Signed on 2006-02-02. Completion date: 2007-01-31.
$99,616 with Army for Other Medical -- Basic Research (R&D). Signed on 2005-01-27. Completion date: 2005-08-25.
AIRPOWER AVIATION RESOURCES IN (702 PASEO VISTA in THOUSAND OAKS, CA; small business) : $608,884 in 12 contractsfrom 2000 to 2004
Contracts for Other Education and Training Services, Aircraft, Fixed Wing, Education Services by Navy Signed by year:2000: $228,598; 2001: $212,670; 2002: $52,000; 2003: $60,826; 2004: $54,790; 2005: $0; 2006: $0.
Biggest contracts:
$196,598 with Navy for Other Education and Training Services. Taking place in MD. Signed on 2000-07-21. Completion date: 2000-08-24.
$60,826 with Navy for Aircraft, Fixed Wing. Taking place in MD. Signed on 2003-05-14. Completion date: 2003-05-25.
$58,050 with Navy for Other Education and Training Services. Taking place in MD. Signed on 2004-05-10. Completion date: 2004-05-30.
$55,000 with Navy for Education Services. Taking place in MD. Signed on 2001-05-21. Completion date: 2001-06-01.
COMPUTER LOCATORS,INC (DIGICOM (3537 OLD CONEJO RD UNIT 10 in NEWBURY PARK, CA; small business) : $521,378 in 12 contractsfrom 2000 to 2005
Contracts for Electrical and Electronic assemblies, Boards, Cards, and Associated Hardware, Microcircuits, Electronic, Miscellaneous Electrical and Electronic Components, Synchros and Resolvers by Air Force, Defense Logistics Agency, Navy Signed by year:2000: $314,072; 2001: $64,888; 2002: $137,420; 2003: $0; 2004: $0; 2005: $4,998; 2006: $0.
Biggest contracts:
$270,070 with Air Force for Electrical and Electronic assemblies, Boards, Cards, and Associated Hardware. Signed on 2000-08-22. Completion date: 2000-11-30.
$68,000 with Defense Logistics Agency for Microcircuits, Electronic. Signed on 2002-05-23. Completion date: 2002-06-22.
$44,070, same as above.Signed on 2002-08-13. Completion date: 2002-09-12.
$44,002 with Navy for Miscellaneous Electrical and Electronic Components. Signed on 2000-09-25. Completion date: 2000-10-30.
DIAMOND GROUND PRODUCTS INC (2550 AZURITE CIR in NEWBURY PARK, CA; small business) : $289,467 in 19 contractsfrom 2002 to 2005
Contracts for Miscellaneous Welding, Soldering, and Brazing Supplies and Accessories, Electrical Contact Brushes and Electrodes, Sets, Kits, and Outfits of Measuring Tools, Bars and Rods by Navy Signed by year:2000: $0; 2001: $0; 2002: $81,600; 2003: $10,000; 2004: $138,093; 2005: $59,774; 2006: $0.
Biggest contracts:
$86,400 with Navy for Miscellaneous Welding, Soldering, and Brazing Supplies and Accessories. Signed on 2004-05-27. Completion date: 2009-05-26.
$81,600 with Navy for Electrical Contact Brushes and Electrodes. Signed on 2002-03-26. Completion date: 2003-04-27.
$29,430 with Navy for Miscellaneous Welding, Soldering, and Brazing Supplies and Accessories. Signed on 2004-01-08. Completion date: 2004-02-27.
$23,549, same as above.Signed on 2005-09-06. Completion date: 2005-10-19.
OPTO DIODE CORPORATION (750 MITCHELL RD in NEWBURY PARK, CA; small business) : $225,556 in 5 contractsfrom 2001 to 2005
Contracts for Optoelectronic Devices and Associated Hardware, Miscellaneous Aircraft Accessories and Components, Miscellaneous Items, Miscellaneous Electrical and Electronic Components by Defense Logistics Agency, Navy, Department of Defense Signed by year:2000: $0; 2001: $215,600; 2002: $0; 2003: $0; 2004: $2,215; 2005: $7,741; 2006: $0.
Biggest contracts:
$215,600 with Defense Logistics Agency for Optoelectronic Devices and Associated Hardware. Signed on 2001-12-19. Completion date: 2003-01-29.
$4,182 with Navy for Optoelectronic Devices and Associated Hardware. Signed on 2005-02-24. Completion date: 2005-03-15.
$3,280 with Department of Defense for Miscellaneous Aircraft Accessories and Components. Signed on 2005-07-11. Completion date: 2005-07-27.
$2,215 with Navy for Miscellaneous Items. Signed on 2004-11-17. Completion date: 2004-12-01.
STRUCTURAL DIAGNOSTICS INC (3675 OLD CONEJO RD in NEWBURY PARK, CA; small business) : $205,611 in 3 contractsfrom 2000 to 2003
$156,000 with NASA for Physical Properties Testing and Inspection. Signed on 2000-06-15. Completion date: 2000-11-15.
$93,300 with Navy for Laboratory Equipment and Supplies. Signed on 2003-05-02. Completion date: 2003-07-11.
-$43,689 with Air Force for Installation of Equipment -- Instruments and Laboratory Equipment. Taking place in TX. Signed on 2000-02-09. Completion date: 1997-10-15.
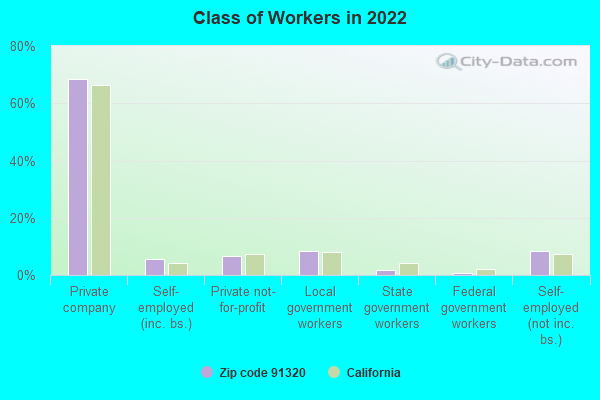
Top industries in this zip code by the number of employees in 2005:
Finance and Insurance: Direct Health and Medical Insurance Carriers (500-999 employees: 2 establishments, 20-49 employees: 3 establishments, 1-4 employees: 2 establishments)
Finance and Insurance: Insurance Agencies and Brokerages (100-249: 2, 50-99: 1, 20-49: 1, 10-19: 1, 1-4: 16)
Professional, Scientific, and Technical Services: Research and Development in the Physical, Engineering, and Life Sciences (250-499: 1, 10-19: 1, 5-9: 2, 1-4: 2)
People in group quarters in 2010:
59 people in nursing facilities/skilled-nursing facilities
19 people in workers' group living quarters and job corps centers
7 people in group homes intended for adults
2 people in other noninstitutional facilities
People in group quarters in 2000:
126 people in nursing homes
113 people in other noninstitutional group quarters
69 people in other group homes
14 people in religious group quarters
13 people in homes for the mentally retarded
Fatal accident statistics in 2013:
Fatal accident count: 5
Vehicles involved in fatal accidents: 9
Fatal accidents caused by drunken drivers: 2
Fatalities: 5
Persons involved in fatal accidents: 15
Pedestrians involved in fatal accidents: 0
Fatal accident statistics in 2012:
Fatal accident count: 1
Vehicles involved in fatal accidents: 2
Fatal accidents caused by drunken drivers: 0
Fatalities: 1
Persons involved in fatal accidents: 9
Pedestrians involved in fatal accidents: 0
Home Mortgage Disclosure Act Aggregated Statistics For Year 2009 (Based on 12 full and 2 partial tracts)
A) FHA, FSA/RHS & VA Home Purchase Loans
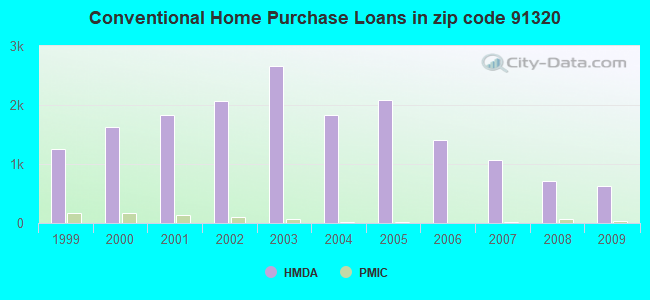
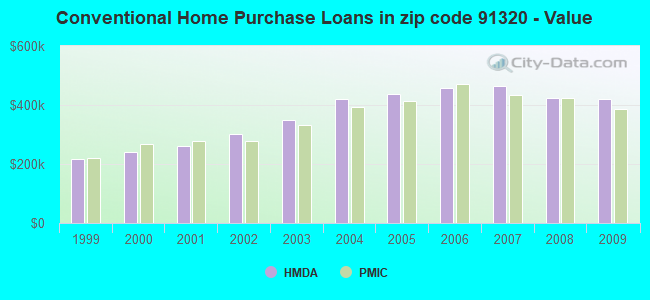
B) Conventional Home Purchase Loans
C) Refinancings
D) Home Improvement Loans
F) Non-occupant Loans on < 5 Family Dwellings (A B C & D)
G) Loans On Manufactured Home Dwelling (A B C & D)
Number
Average Value
Number
Average Value
Number
Average Value
Number
Average Value
Number
Average Value
Number
Average Value
LOANS ORIGINATED
204
$438,125
631
$420,055
3,934
$318,426
128
$320,740
156
$250,631
5
$235,792
APPLICATIONS APPROVED, NOT ACCEPTED
25
$354,460
88
$407,677
362
$368,649
8
$111,839
24
$259,668
5
$109,394
APPLICATIONS DENIED
30
$373,527
84
$506,437
761
$417,709
20
$85,695
56
$268,935
11
$107,234
APPLICATIONS WITHDRAWN
20
$397,026
94
$474,674
559
$394,237
10
$195,272
27
$271,560
0
$0
FILES CLOSED FOR INCOMPLETENESS
6
$283,260
17
$454,411
134
$406,207
2
$349,150
9
$318,080
0
$0
Aggregated Statistics For Year 2008 (Based on 12 full and 2 partial tracts)
A) FHA, FSA/RHS & VA Home Purchase Loans
B) Conventional Home Purchase Loans
C) Refinancings
D) Home Improvement Loans
F) Non-occupant Loans on < 5 Family Dwellings (A B C & D)
G) Loans On Manufactured Home Dwelling (A B C & D)
Number
Average Value
Number
Average Value
Number
Average Value
Number
Average Value
Number
Average Value
Number
Average Value
LOANS ORIGINATED
65
$458,788
718
$424,228
1,221
$371,956
77
$218,931
127
$267,614
19
$85,566
APPLICATIONS APPROVED, NOT ACCEPTED
4
$609,150
145
$422,031
225
$371,594
11
$127,911
13
$223,451
2
$68,500
APPLICATIONS DENIED
19
$352,174
174
$432,705
502
$468,079
57
$238,812
45
$313,385
12
$117,350
APPLICATIONS WITHDRAWN
6
$494,775
116
$408,935
229
$407,692
22
$259,610
19
$288,719
1
$79,000
FILES CLOSED FOR INCOMPLETENESS
6
$394,900
28
$506,346
85
$421,471
10
$181,916
5
$258,788
0
$0
Aggregated Statistics For Year 2007 (Based on 12 full and 2 partial tracts)
A) FHA, FSA/RHS & VA Home Purchase Loans
B) Conventional Home Purchase Loans
C) Refinancings
D) Home Improvement Loans
E) Loans on Dwellings For 5+ Families
F) Non-occupant Loans on < 5 Family Dwellings (A B C & D)
G) Loans On Manufactured Home Dwelling (A B C & D)
Number
Average Value
Number
Average Value
Number
Average Value
Number
Average Value
Number
Average Value
Number
Average Value
Number
Average Value
LOANS ORIGINATED
2
$360,130
1,074
$464,608
1,905
$400,551
205
$256,701
2
$1,250,000
225
$340,442
15
$109,605
APPLICATIONS APPROVED, NOT ACCEPTED
0
$0
242
$434,010
382
$425,823
32
$266,599
0
$0
37
$315,706
14
$139,563
APPLICATIONS DENIED
0
$0
244
$461,770
959
$452,839
91
$309,202
0
$0
105
$380,272
8
$72,441
APPLICATIONS WITHDRAWN
0
$0
175
$445,845
386
$417,560
32
$236,656
0
$0
61
$322,214
5
$217,250
FILES CLOSED FOR INCOMPLETENESS
0
$0
49
$485,626
145
$385,162
11
$261,603
0
$0
16
$318,690
2
$159,950
Aggregated Statistics For Year 2006 (Based on 12 full and 2 partial tracts)
B) Conventional Home Purchase Loans
C) Refinancings
D) Home Improvement Loans
E) Loans on Dwellings For 5+ Families
F) Non-occupant Loans on < 5 Family Dwellings (A B C & D)
G) Loans On Manufactured Home Dwelling (A B C & D)
Number
Average Value
Number
Average Value
Number
Average Value
Number
Average Value
Number
Average Value
Number
Average Value
LOANS ORIGINATED
1,400
$457,592
2,887
$413,344
323
$265,155
0
$0
258
$369,637
23
$97,119
APPLICATIONS APPROVED, NOT ACCEPTED
201
$402,229
495
$424,751
69
$266,434
0
$0
37
$447,002
5
$122,990
APPLICATIONS DENIED
346
$426,699
901
$429,463
127
$266,055
0
$0
89
$419,373
7
$106,623
APPLICATIONS WITHDRAWN
238
$407,491
668
$406,155
73
$360,712
2
$500,000
47
$346,760
9
$102,611
FILES CLOSED FOR INCOMPLETENESS
57
$360,127
167
$377,929
8
$82,968
0
$0
14
$336,758
3
$160,263
Aggregated Statistics For Year 2005 (Based on 12 full and 2 partial tracts)
A) FHA, FSA/RHS & VA Home Purchase Loans
B) Conventional Home Purchase Loans
C) Refinancings
D) Home Improvement Loans
F) Non-occupant Loans on < 5 Family Dwellings (A B C & D)
G) Loans On Manufactured Home Dwelling (A B C & D)
Number
Average Value
Number
Average Value
Number
Average Value
Number
Average Value
Number
Average Value
Number
Average Value
LOANS ORIGINATED
4
$176,172
2,093
$436,601
3,464
$392,282
423
$301,172
378
$329,112
20
$122,527
APPLICATIONS APPROVED, NOT ACCEPTED
0
$0
521
$328,473
452
$392,890
71
$212,084
42
$288,654
18
$121,178
APPLICATIONS DENIED
2
$108,765
373
$412,048
997
$411,089
147
$235,629
91
$320,154
13
$139,188
APPLICATIONS WITHDRAWN
0
$0
309
$408,568
821
$372,115
124
$274,704
52
$364,234
13
$150,329
FILES CLOSED FOR INCOMPLETENESS
0
$0
73
$425,800
292
$381,566
14
$204,201
10
$299,827
3
$224,267
Aggregated Statistics For Year 2004 (Based on 12 full and 2 partial tracts)
A) FHA, FSA/RHS & VA Home Purchase Loans
B) Conventional Home Purchase Loans
C) Refinancings
D) Home Improvement Loans
F) Non-occupant Loans on < 5 Family Dwellings (A B C & D)
G) Loans On Manufactured Home Dwelling (A B C & D)
Number
Average Value
Number
Average Value
Number
Average Value
Number
Average Value
Number
Average Value
Number
Average Value
LOANS ORIGINATED
0
$0
1,829
$421,019
4,788
$344,453
385
$239,971
345
$257,956
10
$68,154
APPLICATIONS APPROVED, NOT ACCEPTED
0
$0
420
$375,528
644
$325,231
57
$193,326
55
$235,874
12
$95,159
APPLICATIONS DENIED
2
$263,675
441
$365,852
960
$367,584
132
$163,293
80
$292,566
9
$72,194
APPLICATIONS WITHDRAWN
2
$298,500
274
$394,053
853
$334,419
89
$191,939
33
$296,486
11
$65,922
FILES CLOSED FOR INCOMPLETENESS
2
$305,275
69
$410,654
325
$325,910
27
$194,436
13
$209,307
3
$105,243
Aggregated Statistics For Year 2003 (Based on 12 full and 2 partial tracts)
A) FHA, FSA/RHS & VA Home Purchase Loans
B) Conventional Home Purchase Loans
C) Refinancings
D) Home Improvement Loans
F) Non-occupant Loans on < 5 Family Dwellings (A B C & D)
Number
Average Value
Number
Average Value
Number
Average Value
Number
Average Value
Number
Average Value
LOANS ORIGINATED
25
$149,856
2,657
$348,174
10,265
$276,051
205
$100,635
463
$216,509
APPLICATIONS APPROVED, NOT ACCEPTED
2
$159,200
369
$345,979
1,252
$268,816
65
$76,878
69
$221,140
APPLICATIONS DENIED
0
$0
380
$305,097
1,329
$282,215
98
$90,622
71
$209,525
APPLICATIONS WITHDRAWN
5
$115,432
305
$349,047
1,405
$277,033
54
$78,422
64
$242,488
FILES CLOSED FOR INCOMPLETENESS
0
$0
125
$365,644
314
$294,010
12
$35,114
11
$208,187
Aggregated Statistics For Year 2002 (Based on 6 full and 2 partial tracts)
A) FHA, FSA/RHS & VA Home Purchase Loans
B) Conventional Home Purchase Loans
C) Refinancings
D) Home Improvement Loans
E) Loans on Dwellings For 5+ Families
F) Non-occupant Loans on < 5 Family Dwellings (A B C & D)
Number
Average Value
Number
Average Value
Number
Average Value
Number
Average Value
Number
Average Value
Number
Average Value
LOANS ORIGINATED
50
$130,326
2,070
$302,601
5,602
$254,270
139
$81,518
2
$2,670,000
283
$163,670
APPLICATIONS APPROVED, NOT ACCEPTED
6
$160,858
278
$339,300
703
$246,449
23
$61,634
0
$0
29
$193,945
APPLICATIONS DENIED
0
$0
258
$294,428
699
$239,914
54
$43,210
0
$0
41
$168,112
APPLICATIONS WITHDRAWN
6
$127,028
206
$250,888
814
$236,211
33
$77,249
2
$4,378,000
30
$145,129
FILES CLOSED FOR INCOMPLETENESS
0
$0
91
$316,440
199
$271,127
0
$0
0
$0
9
$255,123
Aggregated Statistics For Year 2001 (Based on 6 full and 2 partial tracts)
A) FHA, FSA/RHS & VA Home Purchase Loans
B) Conventional Home Purchase Loans
C) Refinancings
D) Home Improvement Loans
E) Loans on Dwellings For 5+ Families
F) Non-occupant Loans on < 5 Family Dwellings (A B C & D)
Number
Average Value
Number
Average Value
Number
Average Value
Number
Average Value
Number
Average Value
Number
Average Value
LOANS ORIGINATED
97
$119,768
1,824
$259,752
3,521
$228,691
180
$50,534
2
$2,300,000
173
$174,455
APPLICATIONS APPROVED, NOT ACCEPTED
2
$240,000
280
$274,898
537
$219,903
38
$64,198
0
$0
33
$190,971
APPLICATIONS DENIED
8
$139,595
181
$254,084
735
$202,965
85
$28,545
0
$0
47
$171,646
APPLICATIONS WITHDRAWN
10
$135,718
211
$267,107
650
$197,941
36
$45,288
2
$2,370,000
41
$168,263
FILES CLOSED FOR INCOMPLETENESS
2
$116,415
69
$289,777
168
$233,018
2
$8,000
0
$0
12
$157,698
Aggregated Statistics For Year 2000 (Based on 6 full and 2 partial tracts)
A) FHA, FSA/RHS & VA Home Purchase Loans
B) Conventional Home Purchase Loans
C) Refinancings
D) Home Improvement Loans
E) Loans on Dwellings For 5+ Families
F) Non-occupant Loans on < 5 Family Dwellings (A B C & D)
Number
Average Value
Number
Average Value
Number
Average Value
Number
Average Value
Number
Average Value
Number
Average Value
LOANS ORIGINATED
149
$90,552
1,630
$240,861
743
$159,207
179
$41,217
0
$0
94
$140,654
APPLICATIONS APPROVED, NOT ACCEPTED
6
$93,350
350
$250,918
166
$160,260
51
$38,977
0
$0
22
$142,602
APPLICATIONS DENIED
16
$135,512
349
$209,152
267
$161,915
92
$37,359
0
$0
30
$170,667
APPLICATIONS WITHDRAWN
12
$117,078
251
$242,812
211
$155,483
25
$43,555
2
$994,000
16
$306,823
FILES CLOSED FOR INCOMPLETENESS
4
$162,232
91
$224,406
60
$175,770
0
$0
0
$0
2
$217,000
Aggregated Statistics For Year 1999 (Based on 5 full and 1 partial tracts)
A) FHA, FSA/RHS & VA Home Purchase Loans
B) Conventional Home Purchase Loans
C) Refinancings
D) Home Improvement Loans
F) Non-occupant Loans on < 5 Family Dwellings (A B C & D)
2005 - 2018 National Fire Incident Reporting System (NFIRS) incidents
According to the data from the years 2005 - 2018 the average number of fires per year is 48. The highest number of fires - 80 took place in 2007, and the least - 19 in 2006. The data has a growing trend.
When looking into fire subcategories, the most reports belonged to: Outside Fires (34.6%), and Structure Fires (25.6%).
Fire incident types reported to NFIRS in Zip Code 91320


 Nearest zip codes: 93012, 91361, 91360, 91362, 93021, 93066.


 According to the data from the years 2005 - 2018 the average number of fires per year is 48. The highest number of fires - 80 took place in 2007, and the least - 19 in 2006. The data has a growing trend.
 When looking into fire subcategories, the most reports belonged to: Outside Fires (34.6%), and Structure Fires (25.6%).