Estimated zip code population in 2022: 42,091 Zip code population in 2010: 42,402 Zip code population in 2000: 42,513
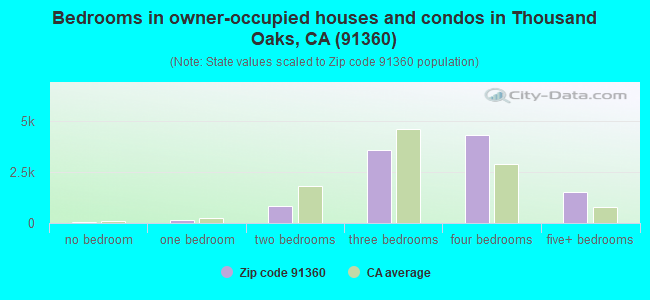
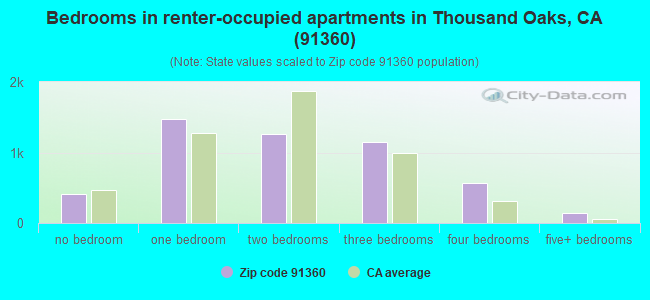
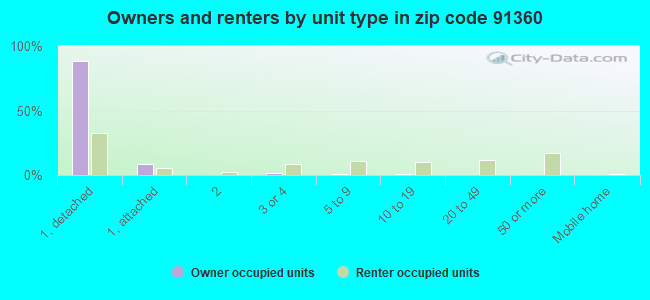
Houses and condos: 15,843 Renter-occupied apartments: 4,998
% of renters here:
32%
State:
44%
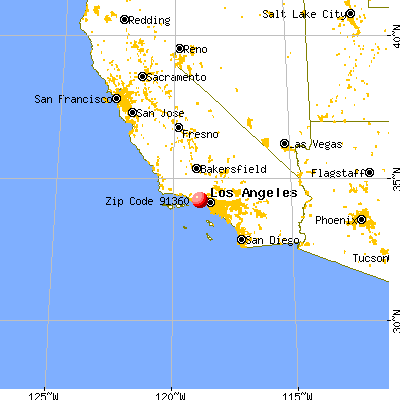
March 2022 cost of living index in zip code 91360: 93.4 (less than average, U.S. average is 100)
Land area: 14.5 sq. mi. Water area: 0.0 sq. mi.
Population density: 2,898 people per square mile
(average).
OSM Map
General Map
Google Map
MSN Map
OSM Map
General Map
Google Map
MSN Map
OSM Map
General Map
Google Map
MSN Map
OSM Map
General Map
Google Map
MSN Map
Please wait while loading the map...
Real estate property taxes paid for housing units in 2022:
This zip code:
0.5% ($5,021)
California:
0.7% ($4,831)
Median real estate property taxes paid for housing units with mortgages in 2022: $5,547 (0.6%) Median real estate property taxes paid for housing units with no mortgage in 2022: $3,758 (0.4%)
Estimated median house/condo value in 2022: $918,302
91360:
$918,302
California:
$715,900
According to our research of California and other state lists, there were 19 registered sex offenders living in 91360 zip code as of April 26, 2024. The ratio of all residents to sex offenders in zip code 91360 is 2,307 to 1. The ratio of registered sex offenders to all residents in this zip code is much lower than the state average.
Median resident age:
This zip code:
43.8 years
California median age:
37.9 years
Average household size:
This zip code:
2.6 people
California:
2.8 people
Averages for the 2020 tax year for zip code 91360, filed in 2021:
Average Adjusted Gross Income (AGI) in 2020: $104,834 (Individual Income Tax Returns)
Here:
$104,834
State:
$95,910
Salary/wage: $85,407 (reported on 74.6% of returns)
Here:
$85,407
State:
$77,331
(% of AGI for various income ranges: 1226.4% for AGIs below $25k, 3923.1% for AGIs $25k-50k, 7053.6% for AGIs $50k-75k, 9986.2% for AGIs $75k-100k, 20666.7% for AGIs $100k-200k, 83531.3% for AGIs over 200k)
Taxable interest for individuals: $1,871 (reported on 46.8% of returns)
This zip code:
$1,871
California:
$2,294
(% of AGI for various income ranges: 32.7% for AGIs below $25k, 45.6% for AGIs $25k-50k, 91.8% for AGIs $50k-75k, 162.8% for AGIs $75k-100k, 266.0% for AGIs $100k-200k, 1124.4% for AGIs over 200k)
Ordinary dividends: $8,662 (reported on 32.0% of returns)
Here:
$8,662
State:
$10,949
(% of AGI for various income ranges: 56.9% for AGIs below $25k, 104.7% for AGIs $25k-50k, 214.1% for AGIs $50k-75k, 444.9% for AGIs $75k-100k, 772.1% for AGIs $100k-200k, 4368.5% for AGIs over 200k)
Net capital gain/loss in AGI: +$23,184 (reported on 29.8% of returns)
Here:
+$23,184
State:
+$49,306
(% of AGI for various income ranges: 16.6% for AGIs below $25k, 57.7% for AGIs $25k-50k, 189.1% for AGIs $50k-75k, 336.4% for AGIs $75k-100k, 861.5% for AGIs $100k-200k, 16986.5% for AGIs over 200k)
Profit/loss from business: +$17,070 (reported on 21.2% of returns)
Here:
+$17,070
State:
+$15,671
(% of AGI for various income ranges: 227.7% for AGIs below $25k, 415.9% for AGIs $25k-50k, 492.7% for AGIs $50k-75k, 640.7% for AGIs $75k-100k, 960.0% for AGIs $100k-200k, 3624.4% for AGIs over 200k)
Taxable individual retirement arrangement distribution: $26,970 (reported on 12.2% of returns)
91360:
$26,970
California:
$23,505
(% of AGI for various income ranges: 86.1% for AGIs below $25k, 162.9% for AGIs $25k-50k, 413.0% for AGIs $50k-75k, 773.2% for AGIs $75k-100k, 1300.8% for AGIs $100k-200k, 3198.7% for AGIs over 200k)
Self-employed (Keogh) retirement plans: $22,670 (reported on 1.3% of returns)
91360:
$22,670
California:
$30,163
(% of AGI for various income ranges: 30.7% for AGIs $50k-75k, 22.3% for AGIs $75k-100k, 70.7% for AGIs $100k-200k, 572.3% for AGIs over 200k)
Total itemized deductions: $36,131 (reported on 24.4% of returns)
Here:
$36,131
State:
$39,517
(% of AGI for various income ranges: 205.8% for AGIs below $25k, 429.1% for AGIs $25k-50k, 984.2% for AGIs $50k-75k, 1817.2% for AGIs $75k-100k, 3315.5% for AGIs $100k-200k, 9862.7% for AGIs over 200k)
Charity contributions: $7,944 (reported on 21.1% of returns)
Here:
$7,944
State:
$12,598
(% of AGI for various income ranges: 8.2% for AGIs below $25k, 36.9% for AGIs $25k-50k, 93.2% for AGIs $50k-75k, 209.4% for AGIs $75k-100k, 477.2% for AGIs $100k-200k, 2983.7% for AGIs over 200k)
Taxes paid: $8,564 (reported on 24.3% of returns)
91360:
$8,564
State:
$8,807
(% of AGI for various income ranges: 34.3% for AGIs below $25k, 81.5% for AGIs $25k-50k, 202.6% for AGIs $50k-75k, 461.5% for AGIs $75k-100k, 911.2% for AGIs $100k-200k, 2139.7% for AGIs over 200k)
Earned income credit: $1,649 (reported on 8.2% of returns)
Here:
$1,649
State:
$2,074
(% of AGI for various income ranges: 55.1% for AGIs below $25k, 42.2% for AGIs $25k-50k)
Percentage of individuals using paid preparers for their 2020 taxes: 92.6%
Here:
93%
State:
92%
(% for various income ranges: 90.0% for AGIs below $25k, 92.6% for AGIs $25k-50k, 93.4% for AGIs $50k-75k, 94.1% for AGIs $75k-100k, 93.6% for AGIs $100k-200k, 95.2% for AGIs over 200k)
Averages for the 2012 tax year for zip code 91360, filed in 2013:
Average Adjusted Gross Income (AGI) in 2012: $80,385 (Individual Income Tax Returns)
Here:
$80,385
State:
$72,726
Salary/wage: $71,266 (reported on 77.4% of returns)
Here:
$71,266
State:
$59,079
(% of AGI for various income ranges: 69.1% for AGIs below $25k, 71.8% for AGIs $25k-50k, 64.9% for AGIs $50k-75k, 64.4% for AGIs $75k-100k, 73.2% for AGIs $100k-200k, 65.4% for AGIs over 200k)
Taxable interest for individuals: $1,651 (reported on 47.2% of returns)
This zip code:
$1,651
California:
$2,146
(% of AGI for various income ranges: 1.9% for AGIs below $25k, 1.2% for AGIs $25k-50k, 1.1% for AGIs $50k-75k, 0.9% for AGIs $75k-100k, 0.9% for AGIs $100k-200k, 0.9% for AGIs over 200k)
Ordinary dividends: $5,922 (reported on 30.2% of returns)
Here:
$5,922
State:
$9,308
(% of AGI for various income ranges: 2.6% for AGIs below $25k, 1.8% for AGIs $25k-50k, 2.0% for AGIs $50k-75k, 2.3% for AGIs $75k-100k, 1.8% for AGIs $100k-200k, 2.8% for AGIs over 200k)
Net capital gain/loss in AGI: +$10,840 (reported on 27.0% of returns)
Here:
+$10,840
State:
+$30,460
(% of AGI for various income ranges: 0.4% for AGIs $25k-50k, 0.2% for AGIs $50k-75k, 0.6% for AGIs $75k-100k, 1.2% for AGIs $100k-200k, 9.4% for AGIs over 200k)
Profit/loss from business: +$18,769 (reported on 20.0% of returns)
Here:
+$18,769
State:
+$17,064
(% of AGI for various income ranges: 12.7% for AGIs below $25k, 8.2% for AGIs $25k-50k, 6.4% for AGIs $50k-75k, 5.1% for AGIs $75k-100k, 3.6% for AGIs $100k-200k, 3.1% for AGIs over 200k)
Taxable individual retirement arrangement distribution: $21,620 (reported on 14.5% of returns)
91360:
$21,620
California:
$19,557
(% of AGI for various income ranges: 4.3% for AGIs below $25k, 3.9% for AGIs $25k-50k, 4.9% for AGIs $50k-75k, 4.9% for AGIs $75k-100k, 3.9% for AGIs $100k-200k, 3.3% for AGIs over 200k)
Self-employment retirement plans: $18,319 (reported on 1.3% of returns)
91360:
$18,319
California:
$24,530
(% of AGI for various income ranges: 0.3% for AGIs below $25k, 0.2% for AGIs $50k-75k, 0.2% for AGIs $75k-100k, 0.3% for AGIs $100k-200k, 0.5% for AGIs over 200k)
Total itemized deductions: $32,392 (24% of AGI, reported on 48.0% of returns)
Here:
$32,392
State:
$34,004
Here:
24.2% of AGI
State:
22.7% of AGI
(% of AGI for various income ranges: 21.4% for AGIs below $25k, 17.3% for AGIs $25k-50k, 20.1% for AGIs $50k-75k, 21.1% for AGIs $75k-100k, 20.9% for AGIs $100k-200k, 17.3% for AGIs over 200k)
Charity contributions: $3,878 (reported on 41.8% of returns)
Here:
$3,878
State:
$4,659
(% of AGI for various income ranges: 1.0% for AGIs below $25k, 1.3% for AGIs $25k-50k, 1.9% for AGIs $50k-75k, 2.3% for AGIs $75k-100k, 2.1% for AGIs $100k-200k, 2.2% for AGIs over 200k)
Taxes paid: $12,048 (reported on 47.9% of returns)
91360:
$12,048
State:
$14,448
(% of AGI for various income ranges: 3.4% for AGIs below $25k, 3.3% for AGIs $25k-50k, 4.9% for AGIs $50k-75k, 6.1% for AGIs $75k-100k, 7.7% for AGIs $100k-200k, 9.1% for AGIs over 200k)
Earned income credit: $1,902 (reported on 9.3% of returns)
Here:
$1,902
State:
$2,286
(% of AGI for various income ranges: 3.5% for AGIs below $25k, 0.7% for AGIs $25k-50k)
Percentage of individuals using paid preparers for their 2012 taxes: 62.1%
Here:
62%
State:
64%
(% for various income ranges: 54.5% for AGIs below $25k, 61.4% for AGIs $25k-50k, 65.9% for AGIs $50k-75k, 66.8% for AGIs $75k-100k, 67.5% for AGIs $100k-200k, 71.4% for AGIs over 200k)
Averages for the 2004 tax year for zip code 91360, filed in 2005:
Average Adjusted Gross Income (AGI) in 2004: $68,182 (Individual Income Tax Returns)
Here:
$68,182
State:
$58,600
Salary/wage: $62,141 (reported on 79.9% of returns)
Here:
$62,141
State:
$49,455
(% of AGI for various income ranges: 271.6% for AGIs below $10k, 67.3% for AGIs $10k-25k, 73.9% for AGIs $25k-50k, 72.0% for AGIs $50k-75k, 76.4% for AGIs $75k-100k, 71.2% for AGIs over 100k)
Taxable interest for individuals: $1,749 (reported on 58.0% of returns)
This zip code:
$1,749
California:
$2,365
(% of AGI for various income ranges: 20.9% for AGIs below $10k, 3.4% for AGIs $10k-25k, 2.1% for AGIs $25k-50k, 1.5% for AGIs $50k-75k, 1.2% for AGIs $75k-100k, 1.2% for AGIs over 100k)
Taxable dividends: $2,792 (reported on 33.8% of returns)
Here:
$2,792
State:
$4,746
(% of AGI for various income ranges: 17.3% for AGIs below $10k, 2.6% for AGIs $10k-25k, 1.6% for AGIs $25k-50k, 1.4% for AGIs $50k-75k, 1.2% for AGIs $75k-100k, 1.2% for AGIs over 100k)
Net capital gain/loss: +$16,337 (reported on 29.4% of returns)
Here:
+$16,337
State:
+$23,418
(% of AGI for various income ranges: -4.9% for AGIs below $10k, 1.2% for AGIs $10k-25k, 0.1% for AGIs $25k-50k, 1.2% for AGIs $50k-75k, 0.9% for AGIs $75k-100k, 11.4% for AGIs over 100k)
Profit/loss from business: +$18,030 (reported on 21.7% of returns)
Here:
+$18,030
State:
+$16,826
(% of AGI for various income ranges: 28.3% for AGIs below $10k, 11.5% for AGIs $10k-25k, 7.9% for AGIs $25k-50k, 6.3% for AGIs $50k-75k, 6.3% for AGIs $75k-100k, 4.5% for AGIs over 100k)
IRA payment deduction: $3,409 (reported on 3.9% of returns)
91360:
$3,409
California:
$3,192
(% of AGI for various income ranges: 1.6% for AGIs below $10k, 0.3% for AGIs $10k-25k, 0.3% for AGIs $25k-50k, 0.3% for AGIs $50k-75k, 0.3% for AGIs $75k-100k, 0.1% for AGIs over 100k)
Self-employed pension: $13,160 (reported on 2.2% of returns)
Here:
$13,160
California:
$17,688
(% of AGI for various income ranges: 0.2% for AGIs $10k-25k, 0.3% for AGIs $25k-50k, 0.3% for AGIs $50k-75k, 0.4% for AGIs $75k-100k, 0.5% for AGIs over 100k)
Total itemized deductions: $27,915 (26% of AGI, reported on 51.7% of returns)
Here:
$27,915
State:
$28,113
Here:
25.6% of AGI
State:
25.3% of AGI
(% of AGI for various income ranges: 99.1% for AGIs below $10k, 22.5% for AGIs $10k-25k, 21.8% for AGIs $25k-50k, 24.0% for AGIs $50k-75k, 25.2% for AGIs $75k-100k, 19.0% for AGIs over 100k)
Charity contributions deductions: $3,356 (3% of AGI, reported on 47.4% of returns)
Here:
$3,356
State:
$3,923
Here:
3.0% of AGI
State:
3.3% of AGI
(% of AGI for various income ranges: 4.1% for AGIs below $10k, 1.7% for AGIs $10k-25k, 1.9% for AGIs $25k-50k, 2.5% for AGIs $50k-75k, 2.8% for AGIs $75k-100k, 2.3% for AGIs over 100k)
Total tax: $11,574 (reported on 80.7% of returns)
91360:
$11,574
State:
$10,761
(% of AGI for various income ranges: 14.4% for AGIs below $10k, 5.2% for AGIs $10k-25k, 7.5% for AGIs $25k-50k, 9.3% for AGIs $50k-75k, 9.9% for AGIs $75k-100k, 17.2% for AGIs over 100k)
Earned income credit: $1,444 (reported on 7.7% of returns)
Here:
$1,444
State:
$1,763
Percentage of individuals using paid preparers for their 2004 taxes: 64.9%
Here:
65%
State:
66%
(% for various income ranges: 55.5% for AGIs below $10k, 61.8% for AGIs $10k-25k, 65.9% for AGIs $25k-50k, 68.7% for AGIs $50k-75k, 67.8% for AGIs $75k-100k, 70.6% for AGIs over 100k)
Likely homosexual households (counted as self-reported same-sex unmarried-partner households)
Lesbian couples: 0.1% of all households
Gay men: 0.1% of all households
Household received Food Stamps/SNAP in the past 12 months: 954 Household did not receive Food Stamps/SNAP in the past 12 months: 14,243
Women who had a birth in the past 12 months: 583 (468 now married, 114 unmarried) Women who did not have a birth in the past 12 months: 8,037 (3,242 now married, 4,792 unmarried)
Housing units in zip code 91360 with a mortgage: 7,523 (801 second mortgage, 9 home equity loan, 717 both second mortgage and home equity loan) Houses without a mortgage: 145
Median monthly owner costs for units with a mortgage: $2,972 Median monthly owner costs for units without a mortgage: $763
Residents with income below the poverty level in 2022:
This zip code:
8.2%
Whole state:
12.2%
Residents with income below 50% of the poverty level in 2022:
This zip code:
3.9%
Whole state:
6.2%
Median number of rooms in houses and condos:
Here:
6.7
State:
6.0
Median number of rooms in apartments:
Here:
4.2
State:
3.9
Notable locations in this zip code not listed on our city pages
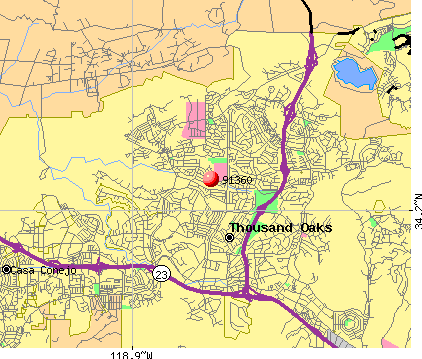
Notable locations in zip code 91360: Sunset Hills Country Club (A), Hill Canyon Treatment Plant (B), Rockwell International Science Center Library (C), Rockwell International Science Center (D), Conejo Valley Community Center (E), Thousand Oask Community Center (F), Los Robles Regional Medical Center Medical Staff Library (G), Ventura County Fire Protection District Station 34 Arboles (H), Ventura County Fire Protection District Station 30 Civic Center (I). Display/hide their locations on the map
Shopping Centers: Village Square Shopping Center (1), Village Court Shopping Center (2), Oaks Shopping Center (3), Sun Plaza Shopping Center (4), Janss Mall Shopping Center (5), El Cid Plaza Shopping Center (6), Conejo Valley Plaza Shopping Center (7), Park Oaks Shopping Center (8). Display/hide their locations on the map
Churches in zip code 91360 include: Conejo Valley Baptist Church (A), The Church of Jesus Christ of Latter Day Saints (B), Church of the Oaks (C), Redeemer Lutheran Church (D). Display/hide their locations on the map
Parks in zip code 91360 include: Arroyo Conejo Open Space (1), Fort Wildwood Park (2), Suburbia Park (3), Wildflower Playfield (4), Wildwood Regional Park (5), Acorn Acres Park (6), Canada Park (7), Conejo Creek Equestrian Park (8), Flore Playfield (9). Display/hide their locations on the map
5,504 married couples with children.
1,071 single-parent households (357 men, 714 women).
75.9% of residents of 91360 zip code speak English at home.
14.7% of residents speak Spanish at home (59% very well, 20% well, 11% not well, 9% not at all).
4.9% of residents speak other Indo-European language at home (80% very well, 13% well, 7% not well, 1% not at all).
3.9% of residents speak Asian or Pacific Island language at home (50% very well, 35% well, 13% not well, 1% not at all).
0.7% of residents speak other language at home (93% very well, 5% well, 2% not well).
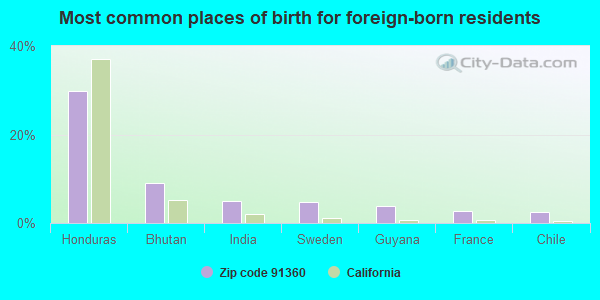
Foreign born population: 7,393 (17.6%) (58.2% of them are naturalized citizens)
Major facilities with environmental interests located in this zip code:
CHEVRON STATION NO 96152 (1152 AVENIDA DE LOS ARBOLES in THOUSAND OAKS, CA)
STATE MASTER (California - Hazardous Waste Tracking) - HAZARDOU WASTE PROGRAM Small Quantity Generators, between 100 kg and 1000 kg of hazardous waste/month (Resource Conservation and Recovery Act (tracking hazardous waste)) (Resource Conservation and Recovery Act (tracking hazardous waste)) Organizations: CHEVRON PRODUCTS CO (CONTACT/OWNER)
Alternative names: CHEVRON STA 9 6152, CHEVRON STA 96152, CHEVRON USA PRODUCTS CO STA.96152
LOS ROBLES HOSPITAL (215 WEST JANSS ROAD in THOUSAND OAKS, CA)
STATE MASTER (California - Hazardous Waste Tracking) - HAZARDOU WASTE PROGRAM CRITERIA AND HAZARDOUS AIR POLLUTANT INVENTORY (Inventory of air pollution sources) Small Quantity Generators, between 100 kg and 1000 kg of hazardous waste/month (Resource Conservation and Recovery Act (tracking hazardous waste)) - notification Business SIC and NAICS classification: GENERAL MEDICAL AND SURGICAL HOSPITALS Organizations: LOS ROBLES REG MED CT (CONTACT/OWNER)
Alternative names: LOS ROBLES REGIONAL MED CTR
ACE CLEANERS (2220 MOORE PARK RD in THOUSAND OAKS, CA)
STATE MASTER (California - Hazardous Waste Tracking) - HAZARDOU WASTE PROGRAM Small Quantity Generators, between 100 kg and 1000 kg of hazardous waste/month (Resource Conservation and Recovery Act (tracking hazardous waste)) - notification Organizations: PARK SHEEN (CONTACT/OWNER)
EQUILON ENTERPRISES (172 MOORPARK in THOUSAND OAKS, CA) . Federal Facility
STATE MASTER (California - Hazardous Waste Tracking) - HAZARDOU WASTE PROGRAM CRITERIA AND HAZARDOUS AIR POLLUTANT INVENTORY (Inventory of air pollution sources) Small Quantity Generators, between 100 kg and 1000 kg of hazardous waste/month (Resource Conservation and Recovery Act (tracking hazardous waste)) - notification Business SIC classification: GASOLINE SERVICE STATIONS Organizations: EQUILON ENTERPRISES, LLC (CONTACT/OWNER)
Alternative names: SHELL OIL CO
EQUILON ENTERPRISES (2658 THOUSAND OAKS in THOUSAND OAKS, CA) . Federal Facility
STATE MASTER (California - Hazardous Waste Tracking) - HAZARDOU WASTE PROGRAM CRITERIA AND HAZARDOUS AIR POLLUTANT INVENTORY (Inventory of air pollution sources) Small Quantity Generators, between 100 kg and 1000 kg of hazardous waste/month (Resource Conservation and Recovery Act (tracking hazardous waste)) - notification Business SIC classification: GASOLINE SERVICE STATIONS Organizations: EQUILON ENTERPRISES, LLC (CONTACT/OWNER)
Alternative names: SHELL OIL CO
CHEVRON 97236 (101 THOUSAND OAKS BLVD in THOUSAND OAKS, CA)
CRITERIA AND HAZARDOUS AIR POLLUTANT INVENTORY (Inventory of air pollution sources) Large Quantity Generators, more that 1000 kg of hazardous waste/month (Resource Conservation and Recovery Act (tracking hazardous waste)) HAZARDOUS WASTE BIENNIAL REPORTER (Resource Conservation and Recovery Act (tracking hazardous waste)) Large Quantity Generators, more that 1000 kg of hazardous waste/month (Resource Conservation and Recovery Act (tracking hazardous waste)) Business SIC classification: GASOLINE SERVICE STATIONS Organizations: CHEVRON PRODUCTS CO. (CONTACT/OPERATOR)
Alternative names: CHEVRON STATION NO 97236, JOHNSONS CHEVRON
ACACIA ELEMENTARY SCHOOL (55 NORMAN AVE in THOUSAND OAKS, CA)
(Geographic Names Information System) (National Center for Education Statistics) - STATE ID-6055842 Organizations: CONEJO VALLEY UNIFIED (SCHOOL DISTRICT)
JEFF FIELDS TRUCKING (3128 CALLE QUEBRACHO in THOUSAND OAKS, CA)
STATE MASTER (California - Hazardous Waste Tracking) - HAZARDOU WASTE PROGRAM TRANSPORTER (Resource Conservation and Recovery Act (tracking hazardous waste)) - notification
LINCOLN OAKS CLEANERS (140 W HILLCREST DR NO 109 in THOUSAND OAKS, CA)
STATE MASTER (California - Hazardous Waste Tracking) - HAZARDOU WASTE PROGRAM Small Quantity Generators, between 100 kg and 1000 kg of hazardous waste/month (Resource Conservation and Recovery Act (tracking hazardous waste)) - notification Organizations: CHANG EUI SHON (CONTACT/OWNER)
MARQUIS CLEANERS (1334 MOORPARK BLVD in THOUSAND OAKS, CA)
STATE MASTER (California - Hazardous Waste Tracking) - HAZARDOU WASTE PROGRAM Small Quantity Generators, between 100 kg and 1000 kg of hazardous waste/month (Resource Conservation and Recovery Act (tracking hazardous waste))
MAZDA OF THOUSAND OAKS (3945 AUTOMALL DR in THOUSAND OAKS, CA)
STATE MASTER (California - Hazardous Waste Tracking) - HAZARDOU WASTE PROGRAM Small Quantity Generators, between 100 kg and 1000 kg of hazardous waste/month (Resource Conservation and Recovery Act (tracking hazardous waste)) - notification Organizations: JOHN ANDERSON (CONTACT/OWNER)
MEDICAL DIAGNOSTIC IMAGING (300 LOMBARD ST in THOUSAND OAKS, CA)
STATE MASTER (California - Hazardous Waste Tracking) - HAZARDOU WASTE PROGRAM Small Quantity Generators, between 100 kg and 1000 kg of hazardous waste/month (Resource Conservation and Recovery Act (tracking hazardous waste)) - notification Organizations: MEDICAL DIAGNOSTIC MED GROUP (CONTACT/OWNER)
Alternative names: MDI IMAGING, INC.
CHEVRON 90482 (234 W AVE DE LOS ARBOLES in THOUSAND OAKS, CA) . Federal Facility
STATE MASTER (California - Hazardous Waste Tracking) - HAZARDOU WASTE PROGRAM Small Quantity Generators, between 100 kg and 1000 kg of hazardous waste/month (Resource Conservation and Recovery Act (tracking hazardous waste)) - notification Organizations: CHEVRON USA PRODUCTS CO (CONTACT/OWNER)
Alternative names: CHEVRON STATION 9 0482
Housing units lacking complete plumbing facilities: 0.3% Housing units lacking complete kitchen facilities: 1.9%
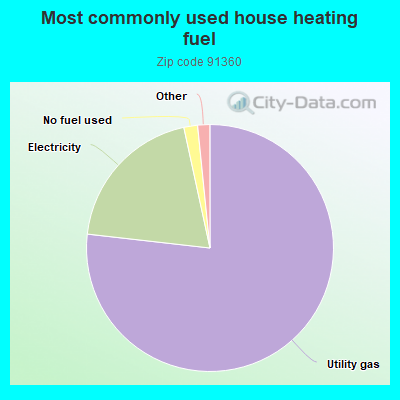
76.8%Utility gas
19.8%Electricity
1.8%No fuel used
0.7%Bottled, tank, or LP gas
0.5%Solar energy
Population in 1990: 41,654. Population change in the 1990s: +859 (+2.1%).
Place of birth for U.S.-born residents:
This state: 25,029
Northeast: 2,823
Midwest: 3,093
South: 1,413
West: 1,660
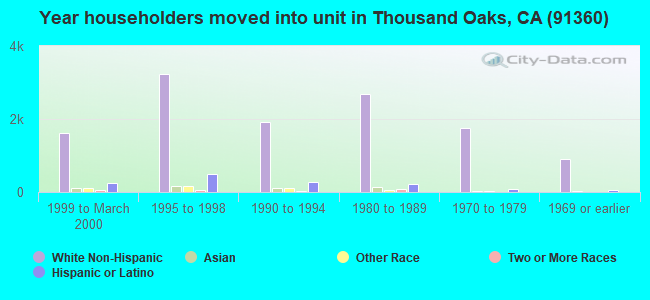
58% of the 91360 zip code residents lived in the same house 5 years ago. Out of people who lived in different houses, 52% lived in this county. Out of people who lived in different counties, 50% lived in California.
93% of the 91360 zip code residents lived in the same house 1 year ago. Out of people who lived in different houses, 69% moved from this county. Out of people who lived in different houses, 19% moved from different county within same state. Out of people who lived in different houses, 11% moved from different state. Out of people who lived in different houses, 2% moved from abroad.
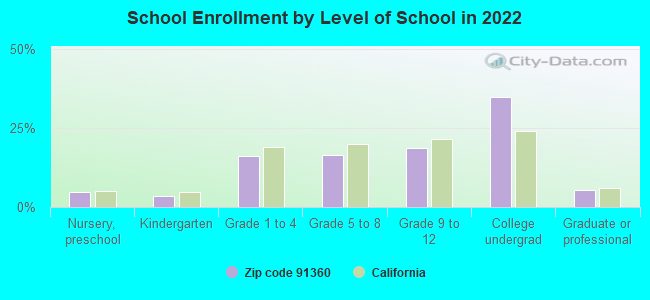
Private vs. public school enrollment:
Students in private schools in grades 1 to 8 (elementary and middle school): 340
Here:
10.1%
California:
10.5%
Students in private schools in grades 9 to 12 (high school): 36
Here:
1.9%
California:
8.5%
Students in private undergraduate colleges: 1,608
Here:
44.3%
California:
15.9%
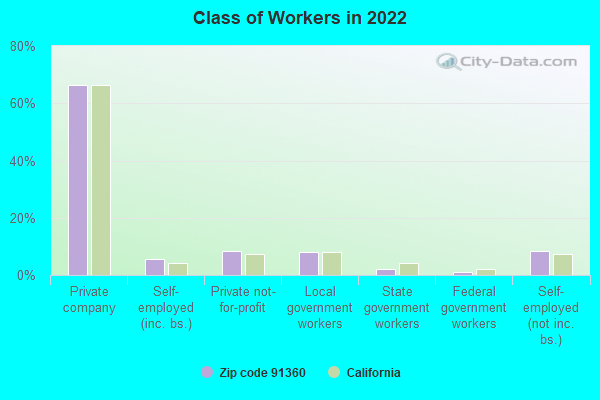
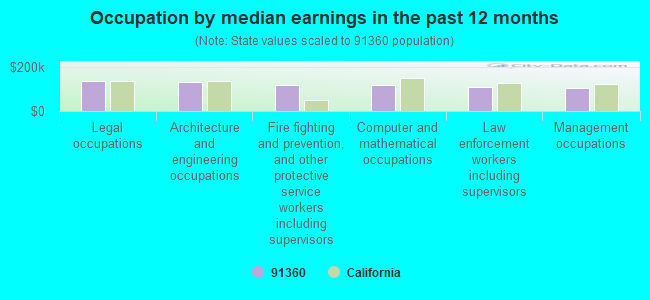
Occupation by median earnings in the past 12 months ($)
139,389Legal occupations
130,445Architecture and engineering occupations
120,290Fire fighting and prevention, and other protective service workers including supervisors
118,292Computer and mathematical occupations
111,419Law enforcement workers including supervisors
106,344Management occupations
Companies with federal contracts located in this zip code (THOUSAND OAKS, CA):
ROCKWELL AUTOMATION, INC (1049 CAMINO DOS RIOS) : $21,597,775 in 68 contractsfrom 1999 to 2006
Contracts for Defense Electronics and Communication Equipment -- Applied Research and Exploratory Development (R&D), Defense Electronics and Communication Equipment -- Advanced Development (R&D), Textiles, Clothing and Equipage -- Operational Systems Development (R&D), Other Defense -- Advanced Development (R&D), and moreby Air Force, Army, Navy, NASA, and others Signed by year:2000: $6,325,000; 2001: $3,561,767; 2002: $2,579,908; 2003: $1,925,000; 2004: $12,000; 2005: $3,263,398; 2006: $53,933.
Biggest contracts:
$1,719,000 with Air Force for Defense Electronics and Communication Equipment -- Applied Research and Exploratory Development (R&D). Signed on 1999-12-21. Completion date: 2002-09-14.
$1,300,000 with Army for Defense Electronics and Communication Equipment -- Advanced Development (R&D). Signed on 2003-03-06. Completion date: 2006-03-30.
$1,300,000 with Air Force for Textiles, Clothing and Equipage -- Operational Systems Development (R&D). Signed on 2002-04-02. Completion date: 2003-08-31.
$1,240,738, same as above.Signed on 2005-09-20. Completion date: 2006-03-31.
GOLD COAST HELICOPTERS, INC (143 SANDBERG ST; small business) : $3,503,322 in 10 contractsfrom 2005 to 2006
Contracts for Miscellaneous Aircraft Accessories and Components by Department of Defense, U.S. Special Operations Command Signed by year:2000: $0; 2001: $0; 2002: $0; 2003: $0; 2004: $0; 2005: $1,415,758; 2006: $2,087,564.
Biggest contracts:
$911,177 with Department of Defense for Miscellaneous Aircraft Accessories and Components. Signed on 2005-09-22. Completion date: 2009-12-31.
$734,917 with U.S. Special Operations Command for Miscellaneous Aircraft Accessories and Components. Signed on 2006-02-01. Completion date: 2006-09-30.
$726,256, same as above.Signed on 2006-06-28. Completion date: 2007-03-31.
$254,113 with Department of Defense for Miscellaneous Aircraft Accessories and Components. Signed on 2005-09-22. Completion date: 2009-12-31.
MONOPOLE RESEARCH (739 CALLE SEQUOIA; small business) : $3,262,162 in 16 contractsfrom 2000 to 2006
Contracts for Defense Electronics and Communication Equipment -- Operational Systems Development (R&D), Other Defense -- Management and Support (R&D), Ammunition -- Basic Research (R&D), Physical Sciences -- Management and Support (R&D), and moreby Air Force, Army Signed by year:2000: $364,353; 2001: $169,900; 2002: $148,488; 2003: $1,139,376; 2004: $1,040,179; 2005: $299,938; 2006: $99,928.
Biggest contracts:
$375,000 with Air Force for Defense Electronics and Communication Equipment -- Operational Systems Development (R&D). Signed on 2004-01-12. Completion date: 2005-06-30.
$375,000, same as above.Signed on 2003-02-28. Completion date: 2005-07-05.
$365,245 with Army for Other Defense -- Management and Support (R&D). Signed on 2004-03-18. Completion date: 2005-04-15.
$364,500, same as above.Signed on 2003-04-10. Completion date: 2005-04-15.
TABLE MOUNTAIN OPTICS (509 MARIN STREET STE 125; small business) : $849,495 in 2 contractsfrom 2005 to 2006
$749,995 with Army for Defense Missile and Space Systems -- Advanced Development (R&D). Signed on 2006-04-20. Completion date: 2008-04-20.
$99,500 with Air Force for Defense Aircraft -- Basic Research (R&D). Signed on 2005-02-17. Completion date: 2005-09-12.
C & M MACHINING (1326 CALLE CRISANTEMO; small business) : $196,936 in 20 contractsfrom 2003 to 2006
Contracts for Airframe Structural Components, Hardware, Weapon System, Lugs, Terminals, and Terminal Strips by Defense Logistics Agency Signed by year:2000: $0; 2001: $0; 2002: $0; 2003: $0; 2004: $73,750; 2005: $116,985; 2006: $6,201.
Biggest contracts:
$51,887 with Defense Logistics Agency for Airframe Structural Components. Signed on 2004-11-12. Completion date: 2005-03-12.
$44,598, same as above.Signed on 2005-07-01. Completion date: 2005-10-29.
$22,773, same as above.Signed on 2005-02-04. Completion date: 2005-07-06.
$19,448, same as above.Signed on 2005-11-15. Completion date: 2006-03-15.
GOGESCH MICRO SYSTEMS, INC (187 EAST WILBUR ROAD, SUIT; small business) : $112,950 in 7 contractsfrom 2000 to 2004
Contracts for Other Management Support Services, ADP Software, ADP Central Processing Unit (CPU, Computer), Hybrid by Army Signed by year:2000: $49,950; 2001: $0; 2002: $36,000; 2003: $23,000; 2004: $4,000; 2005: $0; 2006: $0.
Biggest contracts:
$49,950 with Army for Other Management Support Services. Taking place in VA. Signed on 2000-03-21. Completion date: 2000-09-30.
$20,000 with Army for ADP Software. Taking place in VA. Signed on 2002-11-18. Completion date: 2003-09-30.
$16,000, same as above.Signed on 2002-01-31. Completion date: 2002-09-30.
$12,000 with Army for ADP Central Processing Unit (CPU, Computer), Hybrid. Signed on 2003-11-20. Completion date: 2004-09-30.
BELLEN, JO ANN (2024 SIMSBURY CT; small business) : $82,000 in 3 contractsfrom 2003 to 2006
$48,000 with Army for Other Social Services. Signed on 2005-10-28. Completion date: 2005-11-11.
$30,000, same as above.Signed on 2003-04-16. Completion date: 2003-01-03.
$4,000, same as above.Signed on 2006-02-17. Completion date: 2005-11-11.
ROGUE INDUSTRIAL SYSTEMS (3 WESTBURY ST; small business)
$34,490 with Air Force for Miscellaneous Prefabricated Structures. Signed on 2002-01-14. Completion date: 2002-05-14.
WILLIAM CORNICK (3283 SUNBURST PL; small business) : $15,153 in 4 contractsfrom 2003 to 2006
$5,000 with Air Force for Other Social Services. Signed on 2006-03-31. Completion date: 2006-06-04.
$4,500 with Air Force for Recreational Services. Signed on 2004-10-22. Completion date: 2004-10-31.
$4,500, same as above.Signed on 2004-04-16. Completion date: 2004-04-23.
$1,153 with Air Force for Aerial Photographic Services. Signed on 2003-09-09. Completion date: 2003-09-09.
Top industries in this zip code by the number of employees in 2005:
Educational Services: Colleges, Universities, and Professional Schools (over 1000 employees: 1 establishment, 100-249 employees: 1 establishment, 10-19 employees: 1 establishment)
Health Care and Social Assistance: General Medical and Surgical Hospitals (over 1000: 1)
Professional, Scientific, and Technical Services: Research and Development in the Physical, Engineering, and Life Sciences (250-499: 1, 50-99: 1, 10-19: 1, 1-4: 1)
People in group quarters in 2010:
1,210 people in college/university student housing
173 people in nursing facilities/skilled-nursing facilities
82 people in other noninstitutional facilities
32 people in workers' group living quarters and job corps centers
27 people in group homes intended for adults
9 people in residential treatment centers for adults
4 people in correctional residential facilities
People in group quarters in 2000:
875 people in college dormitories (includes college quarters off campus)
447 people in other noninstitutional group quarters
127 people in nursing homes
45 people in religious group quarters
11 people in homes for the mentally retarded
9 people in other group homes
Fatal accident statistics in 2014:
Fatal accident count: 2
Vehicles involved in fatal accidents: 2
Fatal accidents caused by drunken drivers: 1
Fatalities: 2
Persons involved in fatal accidents: 2
Pedestrians involved in fatal accidents: 0
Fatal accident statistics in 2012:
Fatal accident count: 1
Vehicles involved in fatal accidents: 2
Fatal accidents caused by drunken drivers: 1
Fatalities: 1
Persons involved in fatal accidents: 9
Pedestrians involved in fatal accidents: 0
Home Mortgage Disclosure Act Aggregated Statistics For Year 2009 (Based on 17 full tracts)
A) FHA, FSA/RHS & VA Home Purchase Loans
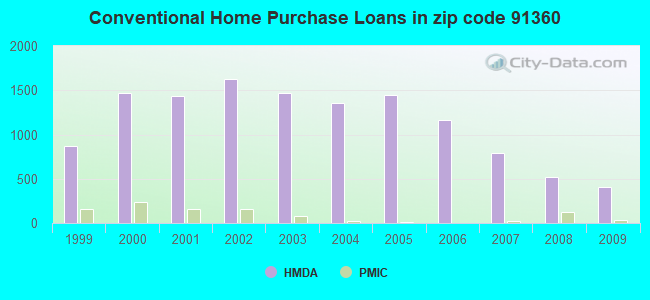
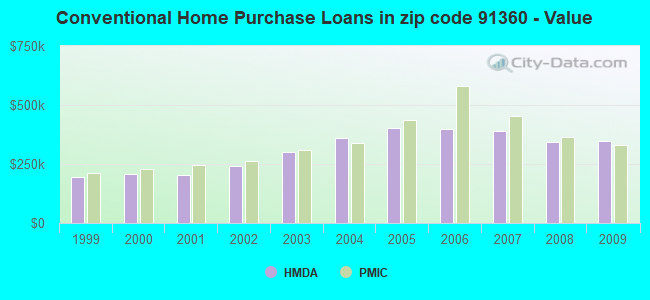
B) Conventional Home Purchase Loans
C) Refinancings
D) Home Improvement Loans
F) Non-occupant Loans on < 5 Family Dwellings (A B C & D)
G) Loans On Manufactured Home Dwelling (A B C & D)
Number
Average Value
Number
Average Value
Number
Average Value
Number
Average Value
Number
Average Value
Number
Average Value
LOANS ORIGINATED
141
$385,893
408
$346,104
2,327
$306,510
89
$262,368
141
$251,935
1
$25,000
APPLICATIONS APPROVED, NOT ACCEPTED
27
$443,684
50
$354,051
240
$343,294
10
$296,039
24
$262,069
0
$0
APPLICATIONS DENIED
45
$427,208
68
$342,901
612
$352,860
31
$147,229
47
$208,402
2
$74,545
APPLICATIONS WITHDRAWN
29
$393,678
75
$339,921
461
$355,285
17
$145,287
46
$223,927
0
$0
FILES CLOSED FOR INCOMPLETENESS
3
$340,040
10
$372,260
94
$348,699
6
$112,462
5
$317,838
0
$0
Aggregated Statistics For Year 2008 (Based on 17 full tracts)
A) FHA, FSA/RHS & VA Home Purchase Loans
B) Conventional Home Purchase Loans
C) Refinancings
D) Home Improvement Loans
E) Loans on Dwellings For 5+ Families
F) Non-occupant Loans on < 5 Family Dwellings (A B C & D)
G) Loans On Manufactured Home Dwelling (A B C & D)
Number
Average Value
Number
Average Value
Number
Average Value
Number
Average Value
Number
Average Value
Number
Average Value
Number
Average Value
LOANS ORIGINATED
75
$425,321
522
$343,160
827
$312,484
73
$210,727
10
$8,992,520
124
$243,196
9
$92,731
APPLICATIONS APPROVED, NOT ACCEPTED
12
$446,233
74
$347,038
155
$318,485
16
$218,561
0
$0
18
$193,943
8
$116,115
APPLICATIONS DENIED
25
$385,104
139
$392,425
415
$408,161
66
$262,907
2
$7,305,165
53
$320,167
4
$211,480
APPLICATIONS WITHDRAWN
12
$367,237
90
$354,320
218
$345,506
20
$278,394
0
$0
24
$240,915
0
$0
FILES CLOSED FOR INCOMPLETENESS
4
$428,982
19
$338,789
69
$409,415
7
$95,443
0
$0
13
$327,545
0
$0
Aggregated Statistics For Year 2007 (Based on 17 full tracts)
B) Conventional Home Purchase Loans
C) Refinancings
D) Home Improvement Loans
E) Loans on Dwellings For 5+ Families
F) Non-occupant Loans on < 5 Family Dwellings (A B C & D)
G) Loans On Manufactured Home Dwelling (A B C & D)
Number
Average Value
Number
Average Value
Number
Average Value
Number
Average Value
Number
Average Value
Number
Average Value
LOANS ORIGINATED
792
$391,365
1,772
$395,720
186
$237,798
6
$4,421,837
186
$373,328
0
$0
APPLICATIONS APPROVED, NOT ACCEPTED
122
$410,213
347
$428,360
44
$253,378
0
$0
39
$358,745
2
$69,785
APPLICATIONS DENIED
241
$417,000
874
$435,783
100
$328,754
0
$0
96
$356,575
3
$141,313
APPLICATIONS WITHDRAWN
121
$401,062
329
$407,372
40
$379,865
0
$0
26
$384,743
0
$0
FILES CLOSED FOR INCOMPLETENESS
24
$314,258
184
$394,336
15
$276,641
0
$0
8
$283,369
0
$0
Aggregated Statistics For Year 2006 (Based on 17 full tracts)
A) FHA, FSA/RHS & VA Home Purchase Loans
B) Conventional Home Purchase Loans
C) Refinancings
D) Home Improvement Loans
E) Loans on Dwellings For 5+ Families
F) Non-occupant Loans on < 5 Family Dwellings (A B C & D)
G) Loans On Manufactured Home Dwelling (A B C & D)
Number
Average Value
Number
Average Value
Number
Average Value
Number
Average Value
Number
Average Value
Number
Average Value
Number
Average Value
LOANS ORIGINATED
2
$339,400
1,160
$399,335
2,358
$388,293
332
$270,027
4
$13,222,898
265
$343,638
0
$0
APPLICATIONS APPROVED, NOT ACCEPTED
0
$0
194
$368,515
445
$387,135
61
$322,857
0
$0
43
$363,009
2
$262,185
APPLICATIONS DENIED
0
$0
364
$388,954
920
$434,251
141
$264,434
0
$0
63
$362,294
4
$348,902
APPLICATIONS WITHDRAWN
0
$0
209
$401,369
610
$408,530
72
$303,049
0
$0
36
$352,420
2
$96,410
FILES CLOSED FOR INCOMPLETENESS
0
$0
34
$413,671
159
$373,257
14
$219,714
0
$0
9
$294,407
0
$0
Aggregated Statistics For Year 2005 (Based on 17 full tracts)
B) Conventional Home Purchase Loans
C) Refinancings
D) Home Improvement Loans
E) Loans on Dwellings For 5+ Families
F) Non-occupant Loans on < 5 Family Dwellings (A B C & D)
G) Loans On Manufactured Home Dwelling (A B C & D)
Number
Average Value
Number
Average Value
Number
Average Value
Number
Average Value
Number
Average Value
Number
Average Value
LOANS ORIGINATED
1,444
$402,707
2,786
$359,445
394
$270,875
6
$6,834,748
312
$349,305
3
$103,030
APPLICATIONS APPROVED, NOT ACCEPTED
187
$403,030
364
$348,510
46
$229,206
0
$0
34
$334,901
2
$89,720
APPLICATIONS DENIED
386
$412,343
882
$401,250
149
$247,951
0
$0
106
$357,256
7
$149,614
APPLICATIONS WITHDRAWN
273
$385,775
782
$363,760
108
$272,283
2
$1,746,625
59
$321,618
0
$0
FILES CLOSED FOR INCOMPLETENESS
53
$332,971
180
$372,963
12
$119,749
0
$0
26
$376,718
0
$0
Aggregated Statistics For Year 2004 (Based on 17 full tracts)
B) Conventional Home Purchase Loans
C) Refinancings
D) Home Improvement Loans
E) Loans on Dwellings For 5+ Families
F) Non-occupant Loans on < 5 Family Dwellings (A B C & D)
G) Loans On Manufactured Home Dwelling (A B C & D)
Number
Average Value
Number
Average Value
Number
Average Value
Number
Average Value
Number
Average Value
Number
Average Value
LOANS ORIGINATED
1,356
$359,664
4,006
$314,609
368
$200,713
4
$12,557,242
333
$285,120
6
$44,203
APPLICATIONS APPROVED, NOT ACCEPTED
230
$368,372
539
$317,879
57
$159,740
0
$0
43
$261,435
0
$0
APPLICATIONS DENIED
286
$345,576
921
$333,050
148
$182,728
0
$0
83
$300,572
8
$74,222
APPLICATIONS WITHDRAWN
238
$359,857
757
$314,931
71
$188,317
0
$0
38
$293,882
0
$0
FILES CLOSED FOR INCOMPLETENESS
43
$377,119
342
$316,325
28
$71,356
2
$18,318,035
15
$242,641
0
$0
Aggregated Statistics For Year 2003 (Based on 17 full tracts)
A) FHA, FSA/RHS & VA Home Purchase Loans
B) Conventional Home Purchase Loans
C) Refinancings
D) Home Improvement Loans
F) Non-occupant Loans on < 5 Family Dwellings (A B C & D)
Number
Average Value
Number
Average Value
Number
Average Value
Number
Average Value
Number
Average Value
LOANS ORIGINATED
8
$244,279
1,468
$302,878
8,462
$245,881
172
$91,910
532
$211,932
APPLICATIONS APPROVED, NOT ACCEPTED
2
$100,000
214
$292,838
987
$259,888
36
$78,957
52
$240,408
APPLICATIONS DENIED
2
$223,935
249
$268,947
1,087
$269,931
74
$62,229
77
$236,137
APPLICATIONS WITHDRAWN
0
$0
208
$306,298
1,270
$255,326
52
$82,219
40
$243,264
FILES CLOSED FOR INCOMPLETENESS
0
$0
48
$310,620
291
$259,790
9
$91,204
25
$232,171
Aggregated Statistics For Year 2002 (Based on 17 full tracts)
A) FHA, FSA/RHS & VA Home Purchase Loans
B) Conventional Home Purchase Loans
C) Refinancings
D) Home Improvement Loans
E) Loans on Dwellings For 5+ Families
F) Non-occupant Loans on < 5 Family Dwellings (A B C & D)
Number
Average Value
Number
Average Value
Number
Average Value
Number
Average Value
Number
Average Value
Number
Average Value
LOANS ORIGINATED
14
$196,685
1,624
$242,041
5,998
$232,495
140
$63,062
7
$6,124,021
345
$201,013
APPLICATIONS APPROVED, NOT ACCEPTED
2
$256,205
172
$256,220
832
$236,151
38
$39,723
0
$0
37
$169,867
APPLICATIONS DENIED
6
$262,317
251
$252,768
866
$227,946
76
$44,882
0
$0
39
$194,563
APPLICATIONS WITHDRAWN
4
$132,090
137
$219,742
981
$233,913
44
$52,791
0
$0
28
$189,177
FILES CLOSED FOR INCOMPLETENESS
0
$0
58
$251,783
260
$230,186
4
$49,818
2
$2,481,000
12
$243,282
Aggregated Statistics For Year 2001 (Based on 17 full tracts)
A) FHA, FSA/RHS & VA Home Purchase Loans
B) Conventional Home Purchase Loans
C) Refinancings
D) Home Improvement Loans
E) Loans on Dwellings For 5+ Families
F) Non-occupant Loans on < 5 Family Dwellings (A B C & D)
Number
Average Value
Number
Average Value
Number
Average Value
Number
Average Value
Number
Average Value
Number
Average Value
LOANS ORIGINATED
60
$202,628
1,431
$203,497
4,196
$215,631
176
$53,267
1
$235,000
242
$163,489
APPLICATIONS APPROVED, NOT ACCEPTED
8
$193,098
171
$227,146
608
$201,406
55
$53,130
0
$0
32
$175,465
APPLICATIONS DENIED
7
$204,609
237
$197,392
839
$214,369
73
$41,149
0
$0
28
$160,525
APPLICATIONS WITHDRAWN
10
$142,280
156
$203,790
744
$197,665
47
$42,660
0
$0
30
$144,344
FILES CLOSED FOR INCOMPLETENESS
2
$194,000
33
$196,043
241
$229,155
20
$63,001
2
$3,727,125
11
$154,674
Aggregated Statistics For Year 2000 (Based on 17 full tracts)
A) FHA, FSA/RHS & VA Home Purchase Loans
B) Conventional Home Purchase Loans
C) Refinancings
D) Home Improvement Loans
F) Non-occupant Loans on < 5 Family Dwellings (A B C & D)
Number
Average Value
Number
Average Value
Number
Average Value
Number
Average Value
Number
Average Value
LOANS ORIGINATED
53
$188,787
1,469
$207,149
1,167
$176,953
169
$44,238
137
$137,903
APPLICATIONS APPROVED, NOT ACCEPTED
6
$167,203
254
$217,451
184
$185,688
81
$40,858
10
$147,524
APPLICATIONS DENIED
6
$153,640
253
$204,896
485
$160,894
87
$52,260
7
$167,191
APPLICATIONS WITHDRAWN
11
$134,481
208
$197,951
322
$162,146
36
$43,993
25
$160,025
FILES CLOSED FOR INCOMPLETENESS
8
$210,969
75
$217,187
106
$203,863
4
$32,495
11
$184,561
Aggregated Statistics For Year 1999 (Based on 8 full and 2 partial tracts)
A) FHA, FSA/RHS & VA Home Purchase Loans
B) Conventional Home Purchase Loans
C) Refinancings
D) Home Improvement Loans
E) Loans on Dwellings For 5+ Families
F) Non-occupant Loans on < 5 Family Dwellings (A B C & D)
2005 - 2018 National Fire Incident Reporting System (NFIRS) incidents
According to the data from the years 2005 - 2018 the average number of fires per year is 73. The highest number of fires - 96 took place in 2007, and the least - 39 in 2006. The data has a dropping trend.
When looking into fire subcategories, the most reports belonged to: Outside Fires (36.6%), and Structure Fires (24.7%).
Fire incident types reported to NFIRS in Zip Code 91360


 Nearest zip codes: 91362, 91320, 91361, 93021, 93012, 93065.


 According to the data from the years 2005 - 2018 the average number of fires per year is 73. The highest number of fires - 96 took place in 2007, and the least - 39 in 2006. The data has a dropping trend.
 When looking into fire subcategories, the most reports belonged to: Outside Fires (36.6%), and Structure Fires (24.7%).