Estimated zip code population in 2022: 16,102 Zip code population in 2010: 16,591 Zip code population in 2000: 16,380
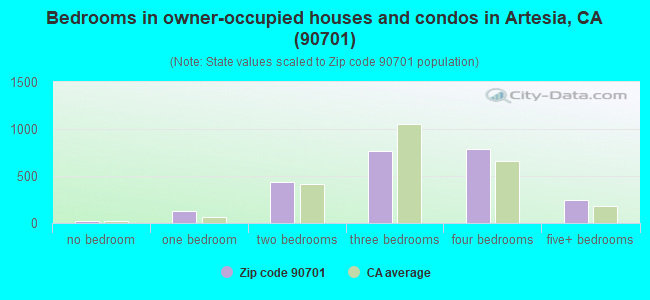
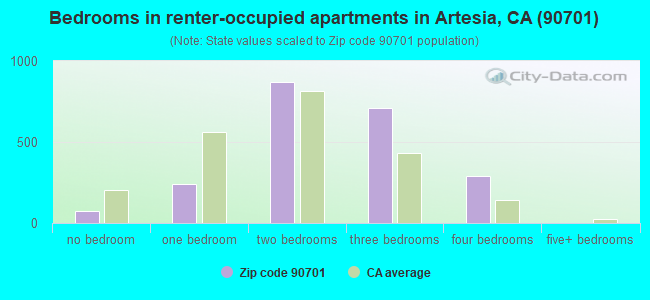
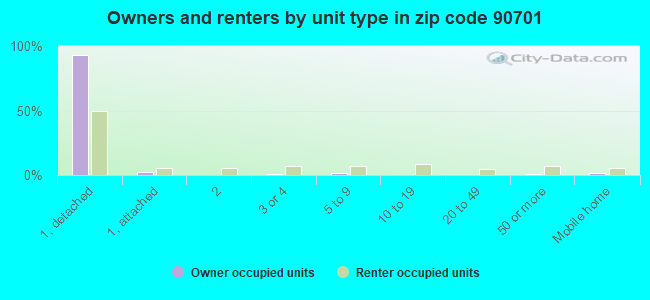
Houses and condos: 4,840 Renter-occupied apartments: 2,189
% of renters here:
48%
State:
44%
March 2022 cost of living index in zip code 90701: 134.9 (high, U.S. average is 100)
Land area: 1.6 sq. mi. Water area: 0.0 sq. mi.
Population density: 9,878 people per square mile
(high).
OSM Map
General Map
Google Map
MSN Map
OSM Map
General Map
Google Map
MSN Map
OSM Map
General Map
Google Map
MSN Map
OSM Map
General Map
Google Map
MSN Map
Please wait while loading the map...
Real estate property taxes paid for housing units in 2022:
This zip code:
0.6% ($4,899)
California:
0.7% ($4,831)
Median real estate property taxes paid for housing units with mortgages in 2022: $5,746 (0.7%) Median real estate property taxes paid for housing units with no mortgage in 2022: $3,634 (0.5%)
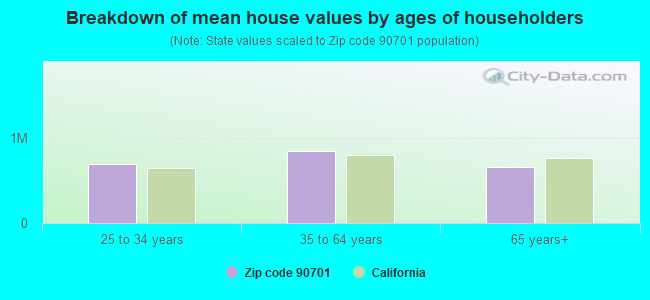
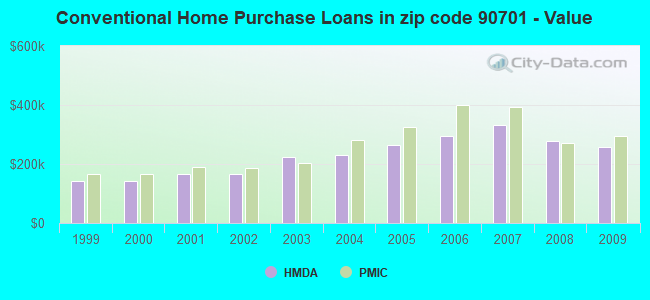
Estimated median house/condo value in 2022: $757,814
90701:
$757,814
California:
$715,900
According to our research of California and other state lists, there were 19 registered sex offenders living in 90701 zip code as of April 27, 2024. The ratio of all residents to sex offenders in zip code 90701 is 899 to 1. The ratio of registered sex offenders to all residents in this zip code is near the state average.
Median resident age:
This zip code:
39.7 years
California median age:
37.9 years
Average household size:
This zip code:
3.4 people
California:
2.8 people
Averages for the 2020 tax year for zip code 90701, filed in 2021:
Average Adjusted Gross Income (AGI) in 2020: $55,311 (Individual Income Tax Returns)
Here:
$55,311
State:
$95,910
Salary/wage: $49,012 (reported on 81.7% of returns)
Here:
$49,012
State:
$77,331
(% of AGI for various income ranges: 1183.1% for AGIs below $25k, 4029.3% for AGIs $25k-50k, 7980.8% for AGIs $50k-75k, 12063.8% for AGIs $75k-100k, 20857.8% for AGIs $100k-200k, 117833.3% for AGIs over 200k)
Taxable interest for individuals: $1,412 (reported on 27.8% of returns)
This zip code:
$1,412
California:
$2,294
(% of AGI for various income ranges: 15.2% for AGIs below $25k, 21.5% for AGIs $25k-50k, 43.0% for AGIs $50k-75k, 105.0% for AGIs $75k-100k, 143.1% for AGIs $100k-200k, 3836.7% for AGIs over 200k)
Ordinary dividends: $2,584 (reported on 11.9% of returns)
Here:
$2,584
State:
$10,949
(% of AGI for various income ranges: 10.5% for AGIs below $25k, 11.9% for AGIs $25k-50k, 38.8% for AGIs $50k-75k, 75.2% for AGIs $75k-100k, 129.6% for AGIs $100k-200k, 3070.0% for AGIs over 200k)
Net capital gain/loss in AGI: +$9,647 (reported on 14.5% of returns)
Here:
+$9,647
State:
+$49,306
(% of AGI for various income ranges: 2.2% for AGIs below $25k, 24.0% for AGIs $25k-50k, 99.3% for AGIs $50k-75k, 158.8% for AGIs $75k-100k, 461.3% for AGIs $100k-200k, 24736.7% for AGIs over 200k)
Profit/loss from business: +$6,901 (reported on 19.4% of returns)
Here:
+$6,901
State:
+$15,671
(% of AGI for various income ranges: 165.8% for AGIs below $25k, 149.9% for AGIs $25k-50k, 213.1% for AGIs $50k-75k, 215.2% for AGIs $75k-100k, 326.0% for AGIs $100k-200k, 4410.0% for AGIs over 200k)
Taxable individual retirement arrangement distribution: $16,700 (reported on 3.7% of returns)
90701:
$16,700
California:
$23,505
(% of AGI for various income ranges: 35.1% for AGIs below $25k, 53.2% for AGIs $25k-50k, 89.3% for AGIs $50k-75k, 153.0% for AGIs $75k-100k, 495.3% for AGIs $100k-200k)
Total itemized deductions: $33,385 (reported on 10.4% of returns)
Here:
$33,385
State:
$39,517
(% of AGI for various income ranges: 49.0% for AGIs below $25k, 187.8% for AGIs $25k-50k, 526.6% for AGIs $50k-75k, 981.0% for AGIs $75k-100k, 2116.0% for AGIs $100k-200k, 22706.7% for AGIs over 200k)
Charity contributions: $7,162 (reported on 8.9% of returns)
Here:
$7,162
State:
$12,598
(% of AGI for various income ranges: 3.4% for AGIs below $25k, 21.7% for AGIs $25k-50k, 60.1% for AGIs $50k-75k, 141.5% for AGIs $75k-100k, 406.7% for AGIs $100k-200k, 6363.3% for AGIs over 200k)
Taxes paid: $8,401 (reported on 10.4% of returns)
90701:
$8,401
State:
$8,807
(% of AGI for various income ranges: 10.4% for AGIs below $25k, 46.3% for AGIs $25k-50k, 140.5% for AGIs $50k-75k, 309.5% for AGIs $75k-100k, 629.3% for AGIs $100k-200k, 3400.0% for AGIs over 200k)
Earned income credit: $1,856 (reported on 17.1% of returns)
Here:
$1,856
State:
$2,074
(% of AGI for various income ranges: 77.0% for AGIs below $25k, 68.9% for AGIs $25k-50k)
Percentage of individuals using paid preparers for their 2020 taxes: 91.1%
Here:
91%
State:
92%
(% for various income ranges: 90.5% for AGIs below $25k, 89.9% for AGIs $25k-50k, 92.5% for AGIs $50k-75k, 94.1% for AGIs $75k-100k, 92.0% for AGIs $100k-200k, 89.5% for AGIs over 200k)
Averages for the 2012 tax year for zip code 90701, filed in 2013:
Average Adjusted Gross Income (AGI) in 2012: $42,197 (Individual Income Tax Returns)
Here:
$42,197
State:
$72,726
Salary/wage: $39,257 (reported on 84.4% of returns)
Here:
$39,257
State:
$59,079
(% of AGI for various income ranges: 78.0% for AGIs below $25k, 85.6% for AGIs $25k-50k, 82.4% for AGIs $50k-75k, 82.7% for AGIs $75k-100k, 78.9% for AGIs $100k-200k, 45.2% for AGIs over 200k)
Taxable interest for individuals: $1,399 (reported on 28.7% of returns)
This zip code:
$1,399
California:
$2,146
(% of AGI for various income ranges: 0.7% for AGIs below $25k, 0.6% for AGIs $25k-50k, 0.6% for AGIs $50k-75k, 0.7% for AGIs $75k-100k, 0.8% for AGIs $100k-200k, 3.8% for AGIs over 200k)
Ordinary dividends: $2,549 (reported on 8.8% of returns)
Here:
$2,549
State:
$9,308
(% of AGI for various income ranges: 0.4% for AGIs below $25k, 0.3% for AGIs $25k-50k, 0.6% for AGIs $50k-75k, 0.6% for AGIs $75k-100k, 0.7% for AGIs $100k-200k, 0.6% for AGIs over 200k)
Net capital gain/loss in AGI: +$1,793 (reported on 8.3% of returns)
Here:
+$1,793
State:
+$30,460
(% of AGI for various income ranges: 0.2% for AGIs $100k-200k, 4.9% for AGIs over 200k)
Profit/loss from business: +$9,365 (reported on 17.2% of returns)
Here:
+$9,365
State:
+$17,064
(% of AGI for various income ranges: 11.6% for AGIs below $25k, 4.3% for AGIs $25k-50k, 2.6% for AGIs $50k-75k, 1.5% for AGIs $75k-100k, 2.4% for AGIs $100k-200k)
Taxable individual retirement arrangement distribution: $13,885 (reported on 4.7% of returns)
90701:
$13,885
California:
$19,557
(% of AGI for various income ranges: 1.1% for AGIs below $25k, 1.0% for AGIs $25k-50k, 1.3% for AGIs $50k-75k, 1.8% for AGIs $75k-100k, 3.1% for AGIs $100k-200k)
Total itemized deductions: $23,173 (28% of AGI, reported on 27.7% of returns)
Here:
$23,173
State:
$34,004
Here:
28.3% of AGI
State:
22.7% of AGI
(% of AGI for various income ranges: 6.5% for AGIs below $25k, 11.2% for AGIs $25k-50k, 16.6% for AGIs $50k-75k, 17.8% for AGIs $75k-100k, 20.3% for AGIs $100k-200k, 19.1% for AGIs over 200k)
Charity contributions: $3,449 (reported on 23.9% of returns)
Here:
$3,449
State:
$4,659
(% of AGI for various income ranges: 0.5% for AGIs below $25k, 1.2% for AGIs $25k-50k, 2.1% for AGIs $50k-75k, 2.2% for AGIs $75k-100k, 2.8% for AGIs $100k-200k, 3.2% for AGIs over 200k)
Taxes paid: $7,134 (reported on 27.5% of returns)
90701:
$7,134
State:
$14,448
(% of AGI for various income ranges: 1.3% for AGIs below $25k, 2.6% for AGIs $25k-50k, 4.1% for AGIs $50k-75k, 5.7% for AGIs $75k-100k, 7.3% for AGIs $100k-200k, 8.2% for AGIs over 200k)
Earned income credit: $2,119 (reported on 23.1% of returns)
Here:
$2,119
State:
$2,286
(% of AGI for various income ranges: 6.1% for AGIs below $25k, 1.3% for AGIs $25k-50k)
Percentage of individuals using paid preparers for their 2012 taxes: 71.8%
Here:
72%
State:
64%
(% for various income ranges: 69.8% for AGIs below $25k, 72.3% for AGIs $25k-50k, 73.9% for AGIs $50k-75k, 74.5% for AGIs $75k-100k, 75.0% for AGIs $100k-200k, 75.0% for AGIs over 200k)
Averages for the 2004 tax year for zip code 90701, filed in 2005:
Average Adjusted Gross Income (AGI) in 2004: $39,656 (Individual Income Tax Returns)
Here:
$39,656
State:
$58,600
Salary/wage: $36,748 (reported on 84.7% of returns)
Here:
$36,748
State:
$49,455
(% of AGI for various income ranges: 114.4% for AGIs below $10k, 77.4% for AGIs $10k-25k, 87.5% for AGIs $25k-50k, 83.6% for AGIs $50k-75k, 83.8% for AGIs $75k-100k, 61.9% for AGIs over 100k)
Taxable interest for individuals: $1,533 (reported on 41.7% of returns)
This zip code:
$1,533
California:
$2,365
(% of AGI for various income ranges: 5.3% for AGIs below $10k, 2.2% for AGIs $10k-25k, 1.1% for AGIs $25k-50k, 1.3% for AGIs $50k-75k, 0.8% for AGIs $75k-100k, 2.2% for AGIs over 100k)
Taxable dividends: $2,222 (reported on 13.5% of returns)
Here:
$2,222
State:
$4,746
(% of AGI for various income ranges: 2.9% for AGIs below $10k, 0.8% for AGIs $10k-25k, 0.3% for AGIs $25k-50k, 0.7% for AGIs $50k-75k, 0.4% for AGIs $75k-100k, 1.3% for AGIs over 100k)
Net capital gain/loss: +$8,708 (reported on 11.6% of returns)
Here:
+$8,708
State:
+$23,418
(% of AGI for various income ranges: -2.6% for AGIs below $10k, -0.4% for AGIs $10k-25k, -0.3% for AGIs $25k-50k, 1.0% for AGIs $50k-75k, 1.2% for AGIs $75k-100k, 8.7% for AGIs over 100k)
Profit/loss from business: +$12,318 (reported on 15.9% of returns)
Here:
+$12,318
State:
+$16,826
(% of AGI for various income ranges: 17.7% for AGIs below $10k, 9.1% for AGIs $10k-25k, 4.0% for AGIs $25k-50k, 2.5% for AGIs $50k-75k, 3.5% for AGIs $75k-100k, 5.7% for AGIs over 100k)
IRA payment deduction: $3,375 (reported on 3.4% of returns)
90701:
$3,375
California:
$3,192
(% of AGI for various income ranges: 0.3% for AGIs $10k-25k, 0.3% for AGIs $25k-50k, 0.4% for AGIs $50k-75k, 0.3% for AGIs $75k-100k, 0.2% for AGIs over 100k)
Self-employed pension: $15,351 (reported on 0.5% of returns)
Here:
$15,351
California:
$17,688
Total itemized deductions: $22,311 (32% of AGI, reported on 34.3% of returns)
Here:
$22,311
State:
$28,113
Here:
31.6% of AGI
State:
25.3% of AGI
(% of AGI for various income ranges: 14.1% for AGIs below $10k, 10.8% for AGIs $10k-25k, 17.7% for AGIs $25k-50k, 20.6% for AGIs $50k-75k, 24.1% for AGIs $75k-100k, 22.0% for AGIs over 100k)
Charity contributions deductions: $3,441 (5% of AGI, reported on 30.5% of returns)
Here:
$3,441
State:
$3,923
Here:
4.6% of AGI
State:
3.3% of AGI
(% of AGI for various income ranges: 0.7% for AGIs below $10k, 1.0% for AGIs $10k-25k, 2.0% for AGIs $25k-50k, 2.8% for AGIs $50k-75k, 3.5% for AGIs $75k-100k, 3.7% for AGIs over 100k)
Total tax: $4,999 (reported on 71.6% of returns)
90701:
$4,999
State:
$10,761
(% of AGI for various income ranges: 4.7% for AGIs below $10k, 4.0% for AGIs $10k-25k, 5.6% for AGIs $25k-50k, 7.8% for AGIs $50k-75k, 9.1% for AGIs $75k-100k, 15.8% for AGIs over 100k)
Earned income credit: $1,694 (reported on 18.1% of returns)
Here:
$1,694
State:
$1,763
Percentage of individuals using paid preparers for their 2004 taxes: 73.8%
Here:
74%
State:
66%
(% for various income ranges: 65.1% for AGIs below $10k, 78.0% for AGIs $10k-25k, 73.8% for AGIs $25k-50k, 75.1% for AGIs $50k-75k, 74.4% for AGIs $75k-100k, 75.1% for AGIs over 100k)
Household received Food Stamps/SNAP in the past 12 months: 705 Household did not receive Food Stamps/SNAP in the past 12 months: 3,883
Women who had a birth in the past 12 months: 132 (78 now married, 54 unmarried) Women who did not have a birth in the past 12 months: 3,906 (1,442 now married, 2,469 unmarried)
Housing units in zip code 90701 with a mortgage: 1,572 (161 second mortgage, 100 both second mortgage and home equity loan) Median monthly owner costs for units with a mortgage: $2,690 Median monthly owner costs for units without a mortgage: $657
Residents with income below the poverty level in 2022:
This zip code:
7.5%
Whole state:
12.2%
Residents with income below 50% of the poverty level in 2022:
This zip code:
2.5%
Whole state:
6.2%
Median number of rooms in houses and condos:
Here:
5.9
State:
6.0
Median number of rooms in apartments:
Here:
4.6
State:
3.9
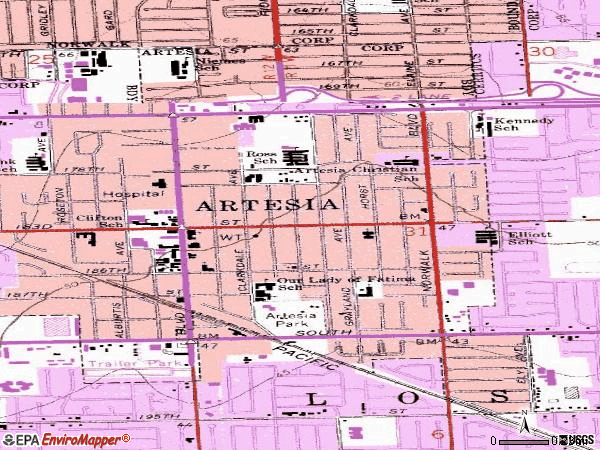
Notable locations in this zip code not listed on our city pages
Churches in zip code 90701 include: Artesia-Cerritos Methodist Church (A), Holy Family Catholic Church (B), Pentecostal Church of God (C), Trinity Christian Center (D), Trinity Christian Reformed Church (E). Display/hide their locations on the map
1,794 married couples with children.
336 single-parent households (52 men, 284 women).
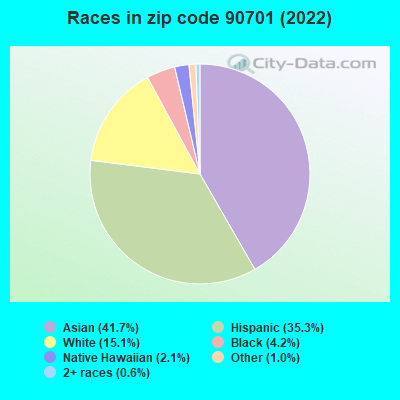
33.0% of residents of 90701 zip code speak English at home.
26.4% of residents speak Spanish at home (60% very well, 17% well, 14% not well, 10% not at all).
18.8% of residents speak other Indo-European language at home (65% very well, 23% well, 6% not well, 7% not at all).
22.7% of residents speak Asian or Pacific Island language at home (63% very well, 25% well, 11% not well, 1% not at all).
0.1% of residents speak other language at home (100% not well).
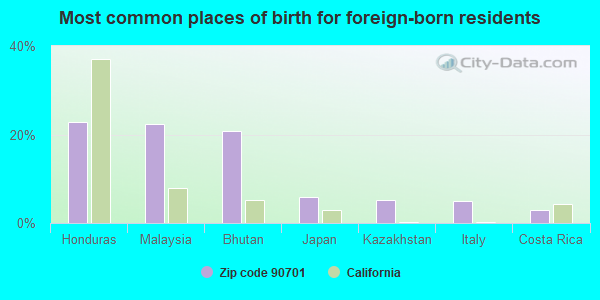
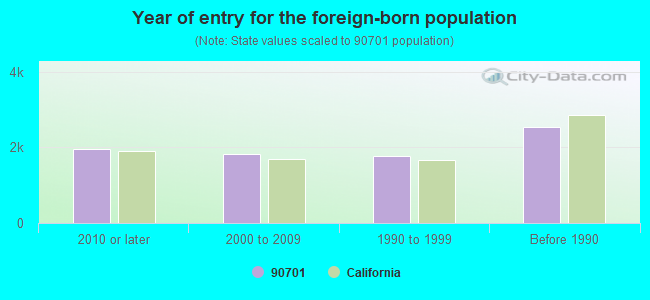
Foreign born population: 7,873 (48.9%) (61.1% of them are naturalized citizens)
This zip code:
48.9%
Whole state:
26.7%
23%Honduras
22%Malaysia
21%Bhutan
6%Japan
5%Kazakhstan
5%Italy
3%Costa Rica
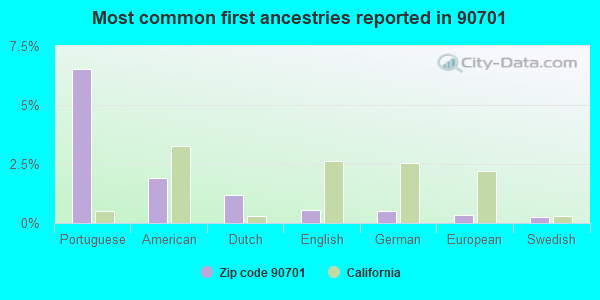
7%Portuguese
2%American
1%Dutch
1%English
1%German
0%European
0%Swedish
Year of entry for the foreign-born population
1,9682010 or later
1,8402000 to 2009
1,7661990 to 1999
2,545Before 1990
Major facilities with environmental interests located in this zip code:
JSJ PRINTING (16221 ARTHUR STREET in CERRITOS, CA)
AIR MAJOR (AIRS/AFS) STATE MASTER (California - Hazardous Waste Tracking) - HAZARDOU WASTE PROGRAM CRITERIA AND HAZARDOUS AIR POLLUTANT INVENTORY (Inventory of air pollution sources) HAZARDOUS WASTE BIENNIAL REPORTER (Resource Conservation and Recovery Act (tracking hazardous waste)) Large Quantity Generators, more that 1000 kg of hazardous waste/month (Resource Conservation and Recovery Act (tracking hazardous waste)) Large Quantity Generators, more that 1000 kg of hazardous waste/month (Resource Conservation and Recovery Act (tracking hazardous waste)) TRI REPORTER (Tracking of toxic chemicals releasing facilities) Business SIC classification: COMMERCIAL PRINTING, LITHOGRAPHIC Organizations: PENN LITHO AND FULFILLMENT (CONTACT/OPERATOR)
Alternative names: PENN LITHO AND FULFILLMENT, PENN LITHOGRAPHICS
FAYE ROSS MIDDLE SCHOOL (17707 S ELAINE in ARTESIA, CA)
(National Center for Education Statistics) - STATE ID-6057442 (Resource Conservation and Recovery Act (tracking hazardous waste)) Organizations: ABC UNIFIED SCHOOL DISTRICT (CONTACT/OWNER)
, ABC UNIFIED (SCHOOL DISTRICT)
FREDDYS RADIATOR SVC (11755 SOUTH ST in ARTESIA, CA)
STATE MASTER (California - Hazardous Waste Tracking) - HAZARDOU WASTE PROGRAM Small Quantity Generators, between 100 kg and 1000 kg of hazardous waste/month (Resource Conservation and Recovery Act (tracking hazardous waste)) - notification Business NAICS classification: OTHER AUTOMOTIVE MECHANICAL AND ELECTRICAL REPAIR AND MAINTENANCE. Organizations: RAYMOND ESPINOZA (CONTACT/OWNER)
LOTUS PREPARED BY CLAUDIUS INC (17411 STUDEBAKER RD UNIT A in CERRITOS, CA)
STATE MASTER (California - Hazardous Waste Tracking) - HAZARDOU WASTE PROGRAM Small Quantity Generators, between 100 kg and 1000 kg of hazardous waste/month (Resource Conservation and Recovery Act (tracking hazardous waste)) - notification Business NAICS classification: GENERAL AUTOMOTIVE REPAIR. Organizations: CLAUDIUS DETLEF (CONTACT/OWNER)
JERSEY STATION (17210 JERSEY in ARTESIA, CA)
FORMAL ENFORCEMENT ACTION (Integrated Compliance Information System) - ICIS-09-2005-0214, ENFORCEMENT/COMPLIANCE ACTIVITY COMPLIANCE ACTIVITY (Tracking inspections of insecticide, fungicide, and rodenticide, and toxic substances)
CAL PLATE (17110 JERSEY AVE in ARTESIA, CA)
STATE MASTER (California - Hazardous Waste Tracking) - HAZARDOU WASTE PROGRAM COMPLIANCE ACTIVITY (Tracking inspections of insecticide, fungicide, and rodenticide, and toxic substances) Small Quantity Generators, between 100 kg and 1000 kg of hazardous waste/month (Resource Conservation and Recovery Act (tracking hazardous waste)) - notification Business SIC classification: HAND AND EDGE TOOLS, EXCEPT MACHINE TOOLS AND HANDSAWS; PRINTING TRADES MACHINERY AND EQUIPMENT Business NAICS classification: HAND AND EDGE TOOL MANUFACTURING.; PRINTING MACHINERY AND EQUIPMENT MANUFACTURING. Organizations: THOMAS R KORZENECKI (CONTACT/OWNER)
EQUILON ENTERPRISES (13359 S CARMENITA in CERRITOS, CA) . Federal Facility
STATE MASTER (California - Hazardous Waste Tracking) - HAZARDOU WASTE PROGRAM Small Quantity Generators, between 100 kg and 1000 kg of hazardous waste/month (Resource Conservation and Recovery Act (tracking hazardous waste)) - notification Organizations: PAUL VANDERPOTTEN (CONTACT/OWNER)
Alternative names: PAULS SHELL SERVICE
NORM REEVES HONDA OF CERRITOS (18500 STUDEBAKER RD in CERRITOS, CA)
STATE MASTER (California - Hazardous Waste Tracking) - HAZARDOU WASTE PROGRAM Small Quantity Generators, between 100 kg and 1000 kg of hazardous waste/month (Resource Conservation and Recovery Act (tracking hazardous waste)) - notification Organizations: D L REEVES (CONTACT/OWNER)
Alternative names: NORM REEVES HONDA SUPERSTORE
FRANK BOUMAS AUTO CTR (11600 SOUTH ST in ARTESIA, CA)
STATE MASTER (California - Hazardous Waste Tracking) - HAZARDOU WASTE PROGRAM Small Quantity Generators, between 100 kg and 1000 kg of hazardous waste/month (Resource Conservation and Recovery Act (tracking hazardous waste)) - notification Business NAICS classification: ALL OTHER AUTOMOTIVE REPAIR AND MAINTENANCE.
KENNEDY (JOHN F.) ELEMENTARY (17500 BELSHIRE AVE. in ARTESIA, CA)
(National Center for Education Statistics) - STATE ID-6010938 Small Quantity Generators, between 100 kg and 1000 kg of hazardous waste/month (Resource Conservation and Recovery Act (tracking hazardous waste)) - notification Organizations: A B C UNIFIED SCHOOL DIST (CONTACT/OWNER)
, ABC UNIFIED (SCHOOL DISTRICT)
Alternative names: KENNEDY ELEM SCHOOL
CERRITOS ONE HR CLEANERS (13333 ARTESIA BLVD in CERRITOS, CA)
STATE MASTER (California - Hazardous Waste Tracking) - HAZARDOU WASTE PROGRAM Small Quantity Generators, between 100 kg and 1000 kg of hazardous waste/month (Resource Conservation and Recovery Act (tracking hazardous waste)) - notification Organizations: LARRY K KERBS (CONTACT/OWNER)
HOME DEPOT STORE THE #08 (10930 ALONDRA BLVD in CERRITOS, CA)
STATE MASTER (California - Hazardous Waste Tracking) - HAZARDOU WASTE PROGRAM Small Quantity Generators, between 100 kg and 1000 kg of hazardous waste/month (Resource Conservation and Recovery Act (tracking hazardous waste)) - notification Organizations: HOME DEPOT USA (CONTACT/OPERATOR)
Alternative names: THE HOME DEPOT #608
CERRITOS AUTO REPAIR (16649 PIONEER BLVD in ARTESIA, CA) . Federal Facility
STATE MASTER (California - Hazardous Waste Tracking) - HAZARDOU WASTE PROGRAM Small Quantity Generators, between 100 kg and 1000 kg of hazardous waste/month (Resource Conservation and Recovery Act (tracking hazardous waste)) - notification Business NAICS classification: GENERAL AUTOMOTIVE REPAIR. Organizations: TAI SIK HAHN (CONTACT/OWNER)
Alternative names: CERRITOS AUTO RPR
Housing units lacking complete plumbing facilities: 0.7% Housing units lacking complete kitchen facilities: 6.3%
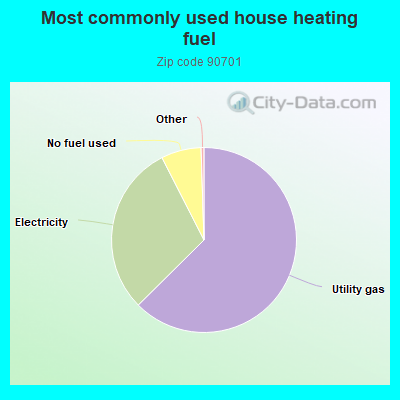
62.6%Utility gas
29.9%Electricity
7.0%No fuel used
Population in 1990: 69,130.
Place of birth for U.S.-born residents:
This state: 7,272
Northeast: 151
Midwest: 400
South: 156
West: 91
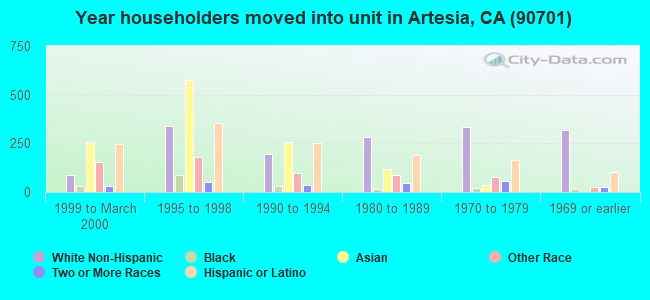
66% of the 90701 zip code residents lived in the same house 5 years ago. Out of people who lived in different houses, 77% lived in this county. Out of people who lived in different counties, 50% lived in California.
92% of the 90701 zip code residents lived in the same house 1 year ago. Out of people who lived in different houses, 57% moved from this county. Out of people who lived in different houses, 37% moved from different county within same state. Out of people who lived in different houses, 5% moved from different state. Out of people who lived in different houses, 2% moved from abroad.
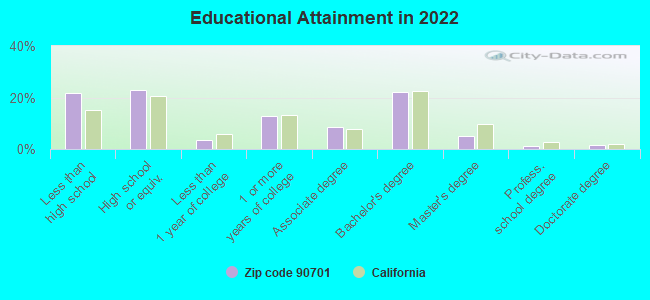
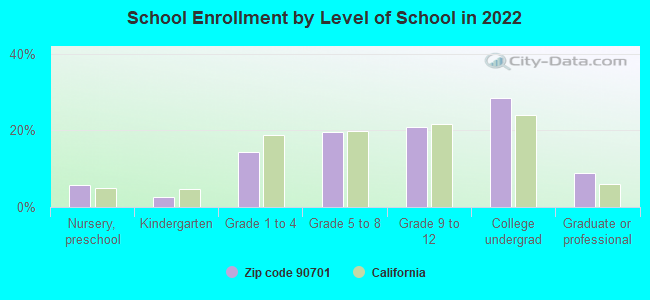
Private vs. public school enrollment:
Students in private schools in grades 1 to 8 (elementary and middle school): 71
Here:
5.3%
California:
10.5%
Students in private schools in grades 9 to 12 (high school): 20
Here:
2.5%
California:
8.5%
Students in private undergraduate colleges: 127
Here:
11.1%
California:
15.9%
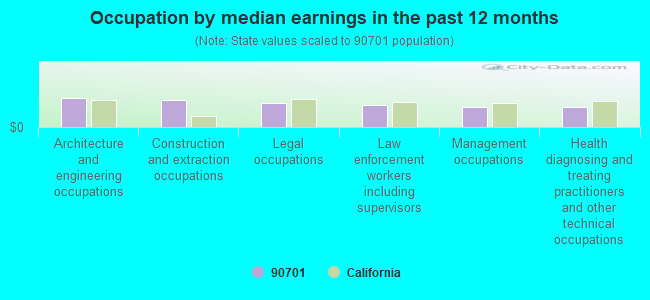
Occupation by median earnings in the past 12 months ($)
110,530Architecture and engineering occupations
101,277Construction and extraction occupations
91,696Legal occupations
81,441Law enforcement workers including supervisors
75,498Management occupations
74,622Health diagnosing and treating practitioners and other technical occupations
Companies with federal contracts located in this zip code:
SPIEKER PROPERTIES, L.P. (2400 E CSTLLA AVE FL 7 in ARTESIA, CA; small business) : $392,895 in 10 contractsfrom 2002 to 2003
Contracts for Lease or Rental of Facilities -- Office Buildings by Public Buildings Service Signed by year:2000: $0; 2001: $0; 2002: $168,124; 2003: $224,771; 2004: $0; 2005: $0; 2006: $0.
Biggest contracts:
$42,282 with Public Buildings Service for Lease or Rental of Facilities -- Office Buildings. Signed on 2003-06-15. Completion date: 2003-06-15.
$42,282, same as above.Signed on 2003-09-15. Completion date: 2003-09-15.
$42,062, same as above.Signed on 2003-09-15. Completion date: 2003-09-15.
$42,062, same as above.Signed on 2003-03-15. Completion date: 2003-03-15.
SHIM-IT CORPORATION (17115 ALBURTIS AVE in ARTESIA, CA; small business) : $16,762 in 2 contractsin 2004
$8,454 with Defense Logistics Agency for Bushings, Rings, Shims, and Spacers. Signed on 2004-12-24. Completion date: 2005-03-25.
$8,308, same as above.Signed on 2004-12-10. Completion date: 2005-01-09.
vandenberg mfg inc., (17306 Roseton ave. in Artesia, CA; small business)
$8,889 with Bureau of Prisoners/Federal Prison System for Gasoline Rotary Engines and Components. Signed on 2005-08-24. Completion date: 2005-09-01.
Top industries in this zip code by the number of employees in 2005:


 Nearest zip codes: 90703, 90715, 90716, 90713, 90650, 90623.