Estimated zip code population in 2022: 34,011 Zip code population in 2010: 31,066 Zip code population in 2000: 30,186
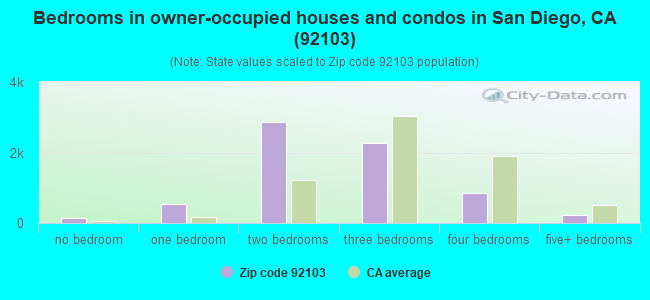
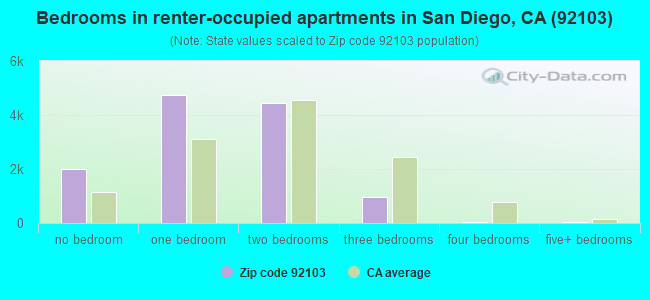
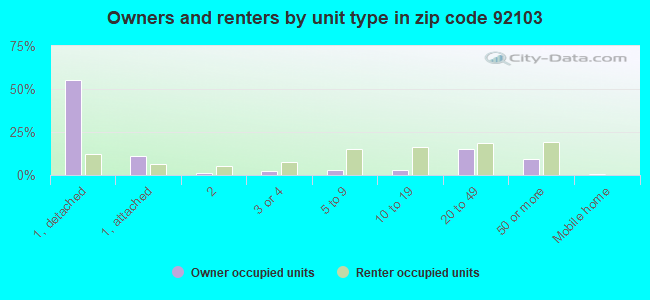
Houses and condos: 20,880 Renter-occupied apartments: 12,193
% of renters here:
64%
State:
44%
March 2022 cost of living index in zip code 92103: 125.5 (high, U.S. average is 100)
Land area: 3.8 sq. mi. Water area: 0.0 sq. mi.
Population density: 9,030 people per square mile
(high).
OSM Map
General Map
Google Map
MSN Map
OSM Map
General Map
Google Map
MSN Map
OSM Map
General Map
Google Map
MSN Map
OSM Map
General Map
Google Map
MSN Map
Please wait while loading the map...
Real estate property taxes paid for housing units in 2022:
This zip code:
0.7% ($6,630)
California:
0.7% ($4,831)
Median real estate property taxes paid for housing units with mortgages in 2022: $7,113 (0.7%) Median real estate property taxes paid for housing units with no mortgage in 2022: $5,132 (0.5%)
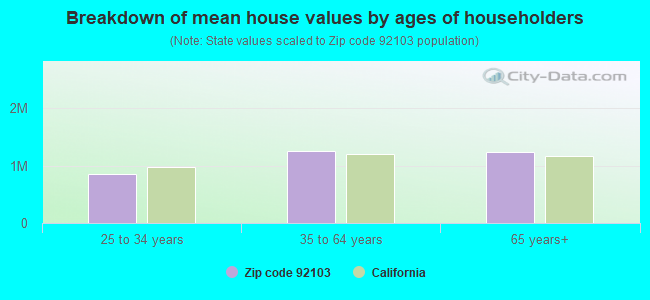
Estimated median house/condo value in 2022: $991,271
92103:
$991,271
California:
$715,900
According to our research of California and other state lists, there were 28 registered sex offenders living in 92103 zip code as of April 27, 2024. The ratio of all residents to sex offenders in zip code 92103 is 1,227 to 1. The ratio of registered sex offenders to all residents in this zip code is lower than the state average.
Median resident age:
This zip code:
42.8 years
California median age:
37.9 years
Average household size:
This zip code:
1.7 people
California:
2.8 people
Averages for the 2020 tax year for zip code 92103, filed in 2021:
Average Adjusted Gross Income (AGI) in 2020: $113,691 (Individual Income Tax Returns)
Here:
$113,691
State:
$95,910
Salary/wage: $89,355 (reported on 77.9% of returns)
Here:
$89,355
State:
$77,331
(% of AGI for various income ranges: 1116.8% for AGIs below $25k, 3964.2% for AGIs $25k-50k, 7096.9% for AGIs $50k-75k, 10688.0% for AGIs $75k-100k, 19098.3% for AGIs $100k-200k, 109361.1% for AGIs over 200k)
Taxable interest for individuals: $2,850 (reported on 41.2% of returns)
This zip code:
$2,850
California:
$2,294
(% of AGI for various income ranges: 33.3% for AGIs below $25k, 38.0% for AGIs $25k-50k, 52.2% for AGIs $50k-75k, 99.3% for AGIs $75k-100k, 250.5% for AGIs $100k-200k, 2679.8% for AGIs over 200k)
Ordinary dividends: $10,878 (reported on 33.2% of returns)
Here:
$10,878
State:
$10,949
(% of AGI for various income ranges: 90.3% for AGIs below $25k, 80.5% for AGIs $25k-50k, 156.9% for AGIs $50k-75k, 269.4% for AGIs $75k-100k, 737.2% for AGIs $100k-200k, 8728.1% for AGIs over 200k)
Net capital gain/loss in AGI: +$32,988 (reported on 31.5% of returns)
Here:
+$32,988
State:
+$49,306
(% of AGI for various income ranges: 30.1% for AGIs below $25k, 67.6% for AGIs $25k-50k, 112.6% for AGIs $50k-75k, 248.8% for AGIs $75k-100k, 1069.0% for AGIs $100k-200k, 33686.2% for AGIs over 200k)
Profit/loss from business: +$17,978 (reported on 19.5% of returns)
Here:
+$17,978
State:
+$15,671
(% of AGI for various income ranges: 181.6% for AGIs below $25k, 233.1% for AGIs $25k-50k, 253.9% for AGIs $50k-75k, 379.4% for AGIs $75k-100k, 784.7% for AGIs $100k-200k, 6202.6% for AGIs over 200k)
Taxable individual retirement arrangement distribution: $29,248 (reported on 9.3% of returns)
92103:
$29,248
California:
$23,505
(% of AGI for various income ranges: 76.3% for AGIs below $25k, 103.9% for AGIs $25k-50k, 191.9% for AGIs $50k-75k, 344.6% for AGIs $75k-100k, 884.6% for AGIs $100k-200k, 4501.3% for AGIs over 200k)
Self-employed (Keogh) retirement plans: $32,526 (reported on 2.0% of returns)
92103:
$32,526
California:
$30,163
(% of AGI for various income ranges: 10.2% for AGIs $25k-50k, 9.6% for AGIs $50k-75k, 25.0% for AGIs $75k-100k, 69.8% for AGIs $100k-200k, 1986.8% for AGIs over 200k)
Total itemized deductions: $40,085 (reported on 18.0% of returns)
Here:
$40,085
State:
$39,517
(% of AGI for various income ranges: 169.3% for AGIs below $25k, 211.9% for AGIs $25k-50k, 333.3% for AGIs $50k-75k, 682.0% for AGIs $75k-100k, 1894.1% for AGIs $100k-200k, 15244.5% for AGIs over 200k)
Charity contributions: $14,060 (reported on 14.8% of returns)
Here:
$14,060
State:
$12,598
(% of AGI for various income ranges: 7.8% for AGIs below $25k, 14.4% for AGIs $25k-50k, 41.8% for AGIs $50k-75k, 81.8% for AGIs $75k-100k, 298.5% for AGIs $100k-200k, 6240.2% for AGIs over 200k)
Taxes paid: $8,955 (reported on 17.9% of returns)
92103:
$8,955
State:
$8,807
(% of AGI for various income ranges: 32.7% for AGIs below $25k, 40.6% for AGIs $25k-50k, 91.9% for AGIs $50k-75k, 220.7% for AGIs $75k-100k, 590.3% for AGIs $100k-200k, 2587.7% for AGIs over 200k)
Earned income credit: $980 (reported on 6.3% of returns)
Here:
$980
State:
$2,074
(% of AGI for various income ranges: 32.7% for AGIs below $25k, 14.4% for AGIs $25k-50k)
Percentage of individuals using paid preparers for their 2020 taxes: 94.2%
Here:
94%
State:
92%
(% for various income ranges: 90.9% for AGIs below $25k, 94.2% for AGIs $25k-50k, 94.8% for AGIs $50k-75k, 94.8% for AGIs $75k-100k, 95.7% for AGIs $100k-200k, 96.2% for AGIs over 200k)
Averages for the 2012 tax year for zip code 92103, filed in 2013:
Average Adjusted Gross Income (AGI) in 2012: $84,695 (Individual Income Tax Returns)
Here:
$84,695
State:
$72,726
Salary/wage: $67,069 (reported on 79.5% of returns)
Here:
$67,069
State:
$59,079
(% of AGI for various income ranges: 70.1% for AGIs below $25k, 80.6% for AGIs $25k-50k, 80.3% for AGIs $50k-75k, 76.8% for AGIs $75k-100k, 69.0% for AGIs $100k-200k, 45.8% for AGIs over 200k)
Taxable interest for individuals: $2,463 (reported on 41.2% of returns)
This zip code:
$2,463
California:
$2,146
(% of AGI for various income ranges: 1.7% for AGIs below $25k, 0.8% for AGIs $25k-50k, 0.7% for AGIs $50k-75k, 1.0% for AGIs $75k-100k, 0.9% for AGIs $100k-200k, 1.6% for AGIs over 200k)
Ordinary dividends: $10,341 (reported on 27.8% of returns)
Here:
$10,341
State:
$9,308
(% of AGI for various income ranges: 3.5% for AGIs below $25k, 1.5% for AGIs $25k-50k, 1.6% for AGIs $50k-75k, 2.0% for AGIs $75k-100k, 2.6% for AGIs $100k-200k, 5.2% for AGIs over 200k)
Net capital gain/loss in AGI: +$24,825 (reported on 24.8% of returns)
Here:
+$24,825
State:
+$30,460
(% of AGI for various income ranges: 0.4% for AGIs $25k-50k, 0.7% for AGIs $50k-75k, 1.0% for AGIs $75k-100k, 2.6% for AGIs $100k-200k, 15.8% for AGIs over 200k)
Profit/loss from business: +$21,659 (reported on 19.0% of returns)
Here:
+$21,659
State:
+$17,064
(% of AGI for various income ranges: 12.5% for AGIs below $25k, 5.3% for AGIs $25k-50k, 3.4% for AGIs $50k-75k, 3.1% for AGIs $75k-100k, 4.6% for AGIs $100k-200k, 4.9% for AGIs over 200k)
Taxable individual retirement arrangement distribution: $22,538 (reported on 9.3% of returns)
92103:
$22,538
California:
$19,557
(% of AGI for various income ranges: 2.8% for AGIs below $25k, 1.8% for AGIs $25k-50k, 2.3% for AGIs $50k-75k, 2.4% for AGIs $75k-100k, 3.8% for AGIs $100k-200k, 2.0% for AGIs over 200k)
Self-employment retirement plans: $26,341 (reported on 1.9% of returns)
92103:
$26,341
California:
$24,530
(% of AGI for various income ranges: 0.2% for AGIs $25k-50k, 0.2% for AGIs $50k-75k, 0.3% for AGIs $75k-100k, 0.5% for AGIs $100k-200k, 1.0% for AGIs over 200k)
Total itemized deductions: $38,320 (23% of AGI, reported on 37.6% of returns)
Here:
$38,320
State:
$34,004
Here:
23.4% of AGI
State:
22.7% of AGI
(% of AGI for various income ranges: 13.4% for AGIs below $25k, 8.3% for AGIs $25k-50k, 10.9% for AGIs $50k-75k, 19.3% for AGIs $75k-100k, 18.1% for AGIs $100k-200k, 20.4% for AGIs over 200k)
Charity contributions: $5,778 (reported on 30.8% of returns)
Here:
$5,778
State:
$4,659
(% of AGI for various income ranges: 0.7% for AGIs below $25k, 0.7% for AGIs $25k-50k, 1.1% for AGIs $50k-75k, 1.4% for AGIs $75k-100k, 1.7% for AGIs $100k-200k, 3.3% for AGIs over 200k)
Taxes paid: $15,614 (reported on 37.4% of returns)
92103:
$15,614
State:
$14,448
(% of AGI for various income ranges: 2.3% for AGIs below $25k, 1.8% for AGIs $25k-50k, 3.1% for AGIs $50k-75k, 6.6% for AGIs $75k-100k, 7.7% for AGIs $100k-200k, 9.5% for AGIs over 200k)
Earned income credit: $903 (reported on 7.8% of returns)
Here:
$903
State:
$2,286
(% of AGI for various income ranges: 1.6% for AGIs below $25k, 0.1% for AGIs $25k-50k)
Percentage of individuals using paid preparers for their 2012 taxes: 50.9%
Here:
51%
State:
64%
(% for various income ranges: 45.0% for AGIs below $25k, 43.5% for AGIs $25k-50k, 47.3% for AGIs $50k-75k, 55.5% for AGIs $75k-100k, 63.9% for AGIs $100k-200k, 79.1% for AGIs over 200k)
Averages for the 2004 tax year for zip code 92103, filed in 2005:
Average Adjusted Gross Income (AGI) in 2004: $72,148 (Individual Income Tax Returns)
Here:
$72,148
State:
$58,600
Salary/wage: $51,993 (reported on 79.7% of returns)
Here:
$51,993
State:
$49,455
(% of AGI for various income ranges: 77.0% for AGIs $10k-25k, 83.2% for AGIs $25k-50k, 79.6% for AGIs $50k-75k, 74.7% for AGIs $75k-100k, 40.6% for AGIs over 100k)
Taxable interest for individuals: $3,095 (reported on 49.1% of returns)
This zip code:
$3,095
California:
$2,365
(% of AGI for various income ranges: 2.7% for AGIs $10k-25k, 1.5% for AGIs $25k-50k, 1.6% for AGIs $50k-75k, 1.9% for AGIs $75k-100k, 2.2% for AGIs over 100k)
Taxable dividends: $6,991 (reported on 30.5% of returns)
Here:
$6,991
State:
$4,746
(% of AGI for various income ranges: 2.3% for AGIs $10k-25k, 1.4% for AGIs $25k-50k, 1.9% for AGIs $50k-75k, 2.1% for AGIs $75k-100k, 3.6% for AGIs over 100k)
Net capital gain/loss: +$31,597 (reported on 27.6% of returns)
Here:
+$31,597
State:
+$23,418
(% of AGI for various income ranges: 0.2% for AGIs $10k-25k, 0.8% for AGIs $25k-50k, 1.7% for AGIs $50k-75k, 2.3% for AGIs $75k-100k, 19.5% for AGIs over 100k)
Profit/loss from business: +$19,847 (reported on 17.9% of returns)
Here:
+$19,847
State:
+$16,826
(% of AGI for various income ranges: 7.3% for AGIs $10k-25k, 4.4% for AGIs $25k-50k, 3.7% for AGIs $50k-75k, 5.3% for AGIs $75k-100k, 5.0% for AGIs over 100k)
IRA payment deduction: $2,813 (reported on 3.2% of returns)
92103:
$2,813
California:
$3,192
(% of AGI for various income ranges: 0.4% for AGIs $10k-25k, 0.3% for AGIs $25k-50k, 0.1% for AGIs $50k-75k, 0.1% for AGIs $75k-100k, 0.1% for AGIs over 100k)
Self-employed pension: $21,253 (reported on 2.6% of returns)
Here:
$21,253
California:
$17,688
(% of AGI for various income ranges: 0.2% for AGIs $10k-25k, 0.2% for AGIs $25k-50k, 0.3% for AGIs $50k-75k, 0.7% for AGIs $75k-100k, 1.0% for AGIs over 100k)
Total itemized deductions: $35,297 (24% of AGI, reported on 36.2% of returns)
Here:
$35,297
State:
$28,113
Here:
23.7% of AGI
State:
25.3% of AGI
(% of AGI for various income ranges: 10.6% for AGIs $10k-25k, 10.1% for AGIs $25k-50k, 15.1% for AGIs $50k-75k, 20.2% for AGIs $75k-100k, 20.0% for AGIs over 100k)
Charity contributions deductions: $5,888 (4% of AGI, reported on 31.4% of returns)
Here:
$5,888
State:
$3,923
Here:
3.8% of AGI
State:
3.3% of AGI
(% of AGI for various income ranges: 0.9% for AGIs $10k-25k, 1.0% for AGIs $25k-50k, 1.6% for AGIs $50k-75k, 2.1% for AGIs $75k-100k, 3.4% for AGIs over 100k)
Total tax: $13,423 (reported on 86.8% of returns)
92103:
$13,423
State:
$10,761
(% of AGI for various income ranges: 5.9% for AGIs $10k-25k, 9.9% for AGIs $25k-50k, 12.7% for AGIs $50k-75k, 13.5% for AGIs $75k-100k, 19.6% for AGIs over 100k)
Earned income credit: $708 (reported on 6.5% of returns)
Here:
$708
State:
$1,763
Percentage of individuals using paid preparers for their 2004 taxes: 52.8%
Here:
53%
State:
66%
(% for various income ranges: 51.8% for AGIs below $10k, 47.2% for AGIs $10k-25k, 43.6% for AGIs $25k-50k, 54.4% for AGIs $50k-75k, 65.8% for AGIs $75k-100k, 74.5% for AGIs over 100k)
Likely homosexual households (counted as self-reported same-sex unmarried-partner households)
Lesbian couples: 0.8% of all households
Gay men: 3.1% of all households
Household received Food Stamps/SNAP in the past 12 months: 1,308 Household did not receive Food Stamps/SNAP in the past 12 months: 17,616
Women who had a birth in the past 12 months: 251 (210 now married, 40 unmarried) Women who did not have a birth in the past 12 months: 8,312 (2,702 now married, 5,635 unmarried)
Housing units in zip code 92103 with a mortgage: 4,623 (562 second mortgage, 28 home equity loan, 490 both second mortgage and home equity loan) Houses without a mortgage: 84
Median monthly owner costs for units with a mortgage: $3,277 Median monthly owner costs for units without a mortgage: $941
Residents with income below the poverty level in 2022:
This zip code:
8.0%
Whole state:
12.2%
Residents with income below 50% of the poverty level in 2022:
This zip code:
3.8%
Whole state:
6.2%
Median number of rooms in houses and condos:
Here:
5.3
State:
6.0
Median number of rooms in apartments:
Here:
3.4
State:
3.9
Notable locations in this zip code not listed on our city pages
Notable locations in zip code 92103: Cypress Grove Picnic Area (A), Hillcrest Receiving Home (B), Juniper Serra Museum (C), Mission Hills Branch San Diego Public Library (D), University Heights Branch San Diego Public Library (E), Jean Farb Memorial Medical Library (F), San Diego Fire - Rescue Department Station 08 (G), San Diego Fire - Rescue Department Station 05 (H). Display/hide their locations on the map
Churches in zip code 92103 include: First Unitarian Church (A), Mission Hills First Congregational Church (B), Mission Hills United Church (C), Saint Vincent de Paul Church (D), First Alliance Church (E), First Christian Fellowship Church (F), First Southern Baptist Church (G), Maranatha Ethiopia Church (H), Saint Johns Catholic Church (I). Display/hide their locations on the map
Parks in zip code 92103 include: Olive Park (1), San Diego Presidio (2), Mission Hills Park (3), Presidio Park (4), Heritage County Park (5), Bowling Green (6), Sefton Plaza (7), Beth Israel Park (8). Display/hide their locations on the map
1,908 married couples with children.
807 single-parent households (225 men, 582 women).
76.4% of residents of 92103 zip code speak English at home.
12.6% of residents speak Spanish at home (78% very well, 12% well, 9% not well, 1% not at all).
5.7% of residents speak other Indo-European language at home (62% very well, 13% well, 20% not well, 5% not at all).
4.0% of residents speak Asian or Pacific Island language at home (72% very well, 12% well, 9% not well, 7% not at all).
1.1% of residents speak other language at home (86% very well, 14% not well).
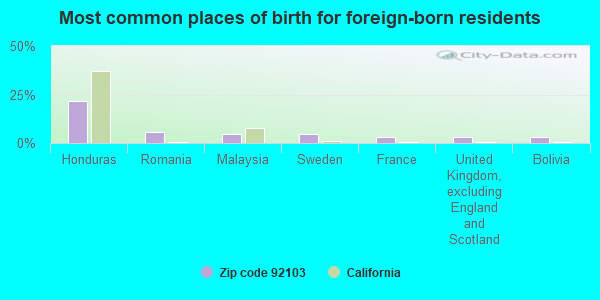
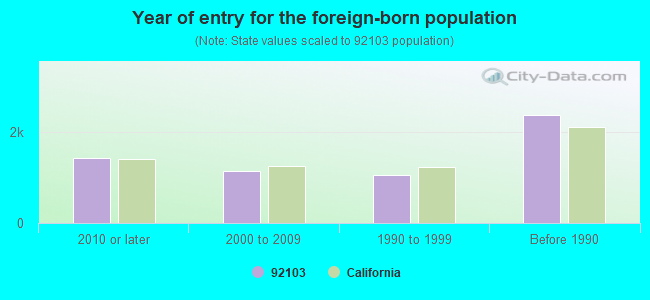
Foreign born population: 5,183 (15.2%) (62.0% of them are naturalized citizens)
Major facilities with environmental interests located in this zip code:
MISSION HILL FABRIC CARE CENTE (1604 WEST LEWIS STREET in SAN DIEGO, CA)
STATE MASTER (California - Hazardous Waste Tracking) - HAZARDOU WASTE PROGRAM CRITERIA AND HAZARDOUS AIR POLLUTANT INVENTORY (Inventory of air pollution sources) Small Quantity Generators, between 100 kg and 1000 kg of hazardous waste/month (Resource Conservation and Recovery Act (tracking hazardous waste)) - notification Business SIC classification: DRYCLEANING PLANTS, EXCEPT RUG CLEANING Organizations: W H CAPERTON (CONTACT/OWNER)
Alternative names: MISSION HILLS FABRIC CARE CENTER
CHEVRON / W WASHINGTON ST (1832 WEST WASHINGTON STREET in SAN DIEGO, CA)
STATE MASTER (California - Hazardous Waste Tracking) - HAZARDOU WASTE PROGRAM CRITERIA AND HAZARDOUS AIR POLLUTANT INVENTORY (Inventory of air pollution sources) Small Quantity Generators, between 100 kg and 1000 kg of hazardous waste/month (Resource Conservation and Recovery Act (tracking hazardous waste)) - notification Business SIC classification: GASOLINE SERVICE STATIONS Organizations: CHEVRON U S A PRODUCTS CO (CONTACT/OWNER)
Alternative names: CHEVRON 90519, CHEVRON STATION 9 0519, CHEVRON STATION 90519
ALT. LEARN FOR BEHAV. & ATT. (COMM. DAY) (3760 4TH AVE. in SAN DIEGO, CA)
(National Center for Education Statistics) - STATE ID-3731130 Organizations: SAN DIEGO UNIFIED (SCHOOL DISTRICT)
FLORENCE ELEMENTARY (3914 FIRST AVE. in SAN DIEGO, CA)
(National Center for Education Statistics) - STATE ID-6039572 Organizations: SAN DIEGO UNIFIED (SCHOOL DISTRICT)
GRANT ELEMENTARY (1425 WASHINGTON PL. in SAN DIEGO, CA)
(National Center for Education Statistics) - STATE ID-6039671 Organizations: SAN DIEGO UNIFIED (SCHOOL DISTRICT)
LANCE DICKSON INDEPENDENT VOLVO (3211 INDIA ST in SAN DIEGO, CA)
CRITERIA AND HAZARDOUS AIR POLLUTANT INVENTORY (Inventory of air pollution sources) Small Quantity Generators, between 100 kg and 1000 kg of hazardous waste/month (Resource Conservation and Recovery Act (tracking hazardous waste)) Business SIC classification: DRYCLEANING PLANTS, EXCEPT RUG CLEANING Organizations: FIRST UNITED AMERICIAN INVESTMENT CORP (CONTACT/OWNER)
ABRAXAS SCHOOL (540 THORN ST in SAN DIEGO, CA)
COMPLIANCE ACTIVITY (Tracking inspections of insecticide, fungicide, and rodenticide, and toxic substances)
INTERNAL MEDICINE ASSOCIATION (4094 FOURTH AVE in SAN DIEGO, CA)
Small Quantity Generators, between 100 kg and 1000 kg of hazardous waste/month (Resource Conservation and Recovery Act (tracking hazardous waste))
CHEVRON STATION 93509 (3535 INDIA ST in SAN DIEGO, CA)
CRITERIA AND HAZARDOUS AIR POLLUTANT INVENTORY (Inventory of air pollution sources) Small Quantity Generators, between 100 kg and 1000 kg of hazardous waste/month (Resource Conservation and Recovery Act (tracking hazardous waste)) - notification Business SIC classification: GASOLINE SERVICE STATIONS Organizations: CHEVRON PRODUCTS CO (CONTACT/OWNER)
Alternative names: CHEVRON STATION 9 3509
A T S (3617 INDIA ST in SAN DIEGO, CA)
Small Quantity Generators, between 100 kg and 1000 kg of hazardous waste/month (Resource Conservation and Recovery Act (tracking hazardous waste))
EXCLUSIVE CLEANERS (3740 PARK BLVD in SAN DIEGO, CA)
Small Quantity Generators, between 100 kg and 1000 kg of hazardous waste/month (Resource Conservation and Recovery Act (tracking hazardous waste))
HARBOR BLUEPRINT (3241 FIFTH AVE in SAN DIEGO, CA)
Small Quantity Generators, between 100 kg and 1000 kg of hazardous waste/month (Resource Conservation and Recovery Act (tracking hazardous waste)) - notification Business NAICS classification: OTHER BUSINESS SERVICE CENTERS (INCLUDING COPY SHOPS). Organizations: MICHAEL G O BRYAN (CONTACT/OWNER)
Housing units lacking complete plumbing facilities: 0.2% Housing units lacking complete kitchen facilities: 1.1%
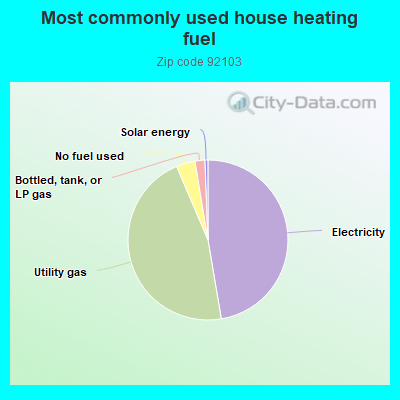
47.3%Electricity
46.2%Utility gas
3.8%No fuel used
2.0%Bottled, tank, or LP gas
0.6%Solar energy
Population in 1990: 31,123.
Place of birth for U.S.-born residents:
This state: 14,538
Northeast: 4,140
Midwest: 4,105
South: 3,113
West: 1,788
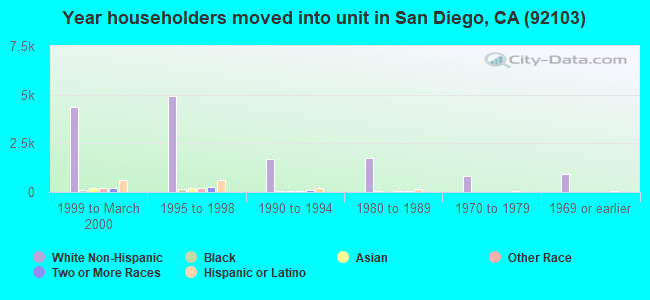
39% of the 92103 zip code residents lived in the same house 5 years ago. Out of people who lived in different houses, 62% lived in this county. Out of people who lived in different counties, 50% lived in California.
84% of the 92103 zip code residents lived in the same house 1 year ago. Out of people who lived in different houses, 50% moved from this county. Out of people who lived in different houses, 25% moved from different county within same state. Out of people who lived in different houses, 17% moved from different state. Out of people who lived in different houses, 8% moved from abroad.
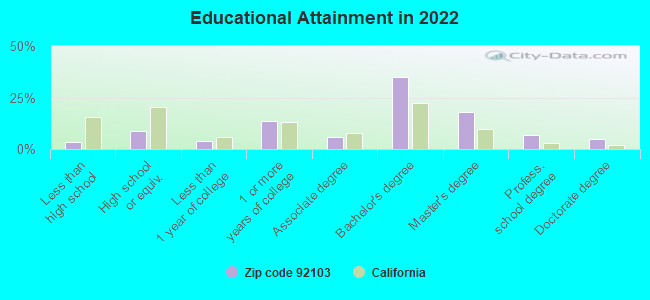
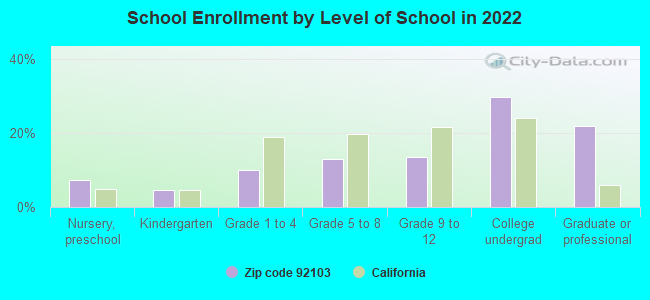
Private vs. public school enrollment:
Students in private schools in grades 1 to 8 (elementary and middle school): 155
Here:
15.2%
California:
10.5%
Students in private schools in grades 9 to 12 (high school): 104
Here:
17.9%
California:
8.5%
Students in private undergraduate colleges: 210
Here:
16.3%
California:
15.9%
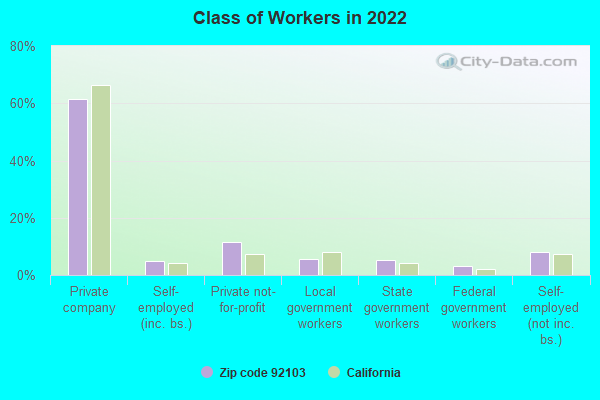
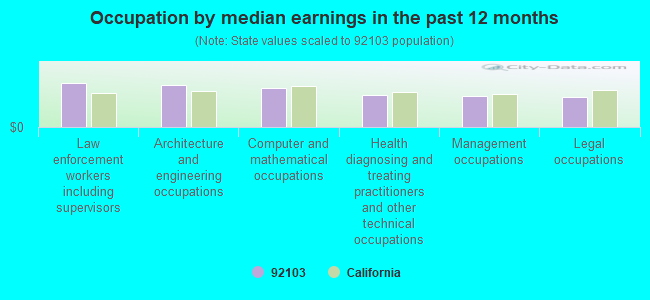
Occupation by median earnings in the past 12 months ($)
125,077Law enforcement workers including supervisors
118,215Architecture and engineering occupations
109,990Computer and mathematical occupations
91,753Health diagnosing and treating practitioners and other technical occupations
89,418Management occupations
84,300Legal occupations
Companies with biggest federal contracts located in this zip code (SAN DIEGO, CA):
ENVIRONMENTAL RESOURCES CORPOR (3753 RICHMOND ST; small business) : $11,271,007 in 29 contractsfrom 1999 to 2005
Contracts for Operation of Government-Owned Facilities -- Heating and Cooling Plants, Maintenance, Repair or Alteration of Real Property -- Heating and Cooling Plants, Maintenance, Repair or Alteration of Real Property -- Office Buildings, Manpower Studies, and moreby Air Force Signed by year:2000: $583,128; 2001: $3,458,181; 2002: $2,570,473; 2003: $2,016,255; 2004: $1,893,186; 2005: $180,648; 2006: $0.
Biggest contracts:
$1,222,742 with Air Force for Operation of Government-Owned Facilities -- Heating and Cooling Plants. Taking place in MD. Signed on 2003-10-01. Completion date: 2004-09-30.
$1,204,740, same as above.Signed on 2004-10-01. Completion date: 2005-10-31.
$1,180,740, same as above.Signed on 2002-10-07. Completion date: 2003-09-30.
$1,158,000 with Air Force for Maintenance, Repair or Alteration of Real Property -- Heating and Cooling Plants. Taking place in MD. Signed on 2001-10-10. Completion date: 2002-09-30.
KTU+A (3916 NORMAL STREET; small business) : $6,090,370 in 101 contractsfrom 1999 to 2006
Contracts for Other Architect and Engineering Services, Architect - Engineer Services (including landscaping, interior layout, and designing), Administrative and Service Buildings, A&E Management Engineering Services, and moreby Navy, U.S. Army Corps of Engineers - civil program financing only Signed by year:2000: $649,157; 2001: $1,602,462; 2002: $991,494; 2003: $713,598; 2004: $1,331,230; 2005: $452,942; 2006: $301,436.
Biggest contracts:
$568,725 with Navy for Other Architect and Engineering Services. Taking place in IL. Signed on 2001-06-29. Completion date: 2002-06-28.
$546,675 with Navy for Architect - Engineer Services (including landscaping, interior layout, and designing). Taking place in SC. Signed on 2004-04-12. Completion date: 2004-05-12.
$375,744 with Navy for Other Architect and Engineering Services. Taking place in FL. Signed on 2001-08-30. Completion date: 2002-09-30.
$335,000 with Navy for Other Architect and Engineering Services. Taking place in SC. Signed on 2003-07-07. Completion date: 2004-07-06.
ACCORD SOLUTIONS, INC (3533 ALBATROSS STREET; small business) : $1,699,896 in 8 contractsfrom 2002 to 2005
Contracts for Defense Electronics and Communication Equipment -- Applied Research and Exploratory Development (R&D), Defense Electronics and Communication Equipment -- Basic Research (R&D), Defense Electronics and Communication Equipment -- Management and Support (R&D) by Air Force, Navy Signed by year:2000: $0; 2001: $0; 2002: $69,994; 2003: $279,932; 2004: $725,000; 2005: $624,970; 2006: $0.
Biggest contracts:
$375,000 with Air Force for Defense Electronics and Communication Equipment -- Applied Research and Exploratory Development (R&D). Signed on 2004-06-29. Completion date: 2006-10-31.
$374,970, same as above.Signed on 2005-06-30. Completion date: 2006-10-31.
$350,000 with Navy for Defense Electronics and Communication Equipment -- Basic Research (R&D). Signed on 2004-01-08. Completion date: 2005-10-21.
$250,000 with Navy for Defense Electronics and Communication Equipment -- Applied Research and Exploratory Development (R&D). Signed on 2005-01-13. Completion date: 2005-10-21.
LA CRESTA COMMUNICATIONS, INC (4257 3RD AVE; small business) : $1,462,641 in 20 contractsfrom 2003 to 2005
Contracts for Torque Converters and Speed Changers, Miscellaneous Items, Radio and Television Communication Equipment, Airborne, Miscellaneous Communication Equipment, and moreby Army, Air Force, Department of Veterans Affairs, Federal Bureau of Investigation, and others Signed by year:2000: $0; 2001: $0; 2002: $0; 2003: $368,361; 2004: $1,049,324; 2005: $44,956; 2006: $0.
Biggest contracts:
$499,950 with Army for Torque Converters and Speed Changers. Signed on 2004-12-15. Completion date: 2005-09-15.
$499,950, same as above.Signed on 2004-12-09. Completion date: 2005-09-15.
$180,600 with Army for Miscellaneous Items. Signed on 2003-08-29. Completion date: 2003-10-23.
$58,694 with Army for Radio and Television Communication Equipment, Airborne. Signed on 2003-09-02. Completion date: 2003-10-28.
DANE R LACEY, MD, PC (3669 VERMONT ST; small business) : $1,424,404 in 4 contractsfrom 2003 to 2005
$399,998 with Navy for Radiology Services. Signed on 2005-10-19. Completion date: 2005-09-30.
$399,998, same as above.Signed on 2004-10-14. Completion date: 2005-09-30.
$399,980, same as above.Signed on 2003-10-01. Completion date: 2004-09-30.
$224,428, same as above.Signed on 2003-02-21. Completion date: 2003-09-30.
EPSYSTEMS, INC (1010 UNIVERSITY AVE; small business) : $920,478 in 14 contractsfrom 2000 to 2006
Contracts for Other Professional Services by U.S. Special Operations Command, Department of Defense Signed by year:2000: $132,500; 2001: $110,550; 2002: $45,000; 2003: $144,278; 2004: $219,589; 2005: $242,306; 2006: $26,255.
Biggest contracts:
$157,462 with U.S. Special Operations Command for Other Professional Services. Taking place in NC. Signed on 2005-12-22. Completion date: 2006-09-30.
$149,965 with Department of Defense for Other Professional Services. Taking place in NC. Signed on 2004-11-01. Completion date: 2005-09-30.
$132,500, same as above.Signed on 2000-10-01. Completion date: 2001-09-30.
$110,550, same as above.Signed on 2001-11-08. Completion date: 2002-09-30.
VAN DYKE LLP (2970 FIFTH AVENUE, SUITE 2; small business) : $656,870 in 60 contractsfrom 2000 to 2005
Contracts for Architect - Engineer Services (including landscaping, interior layout, and designing) by Navy, Department of Veterans Affairs Signed by year:2000: $107,139; 2001: $175,711; 2002: $323,940; 2003: $29,612; 2004: $16,058; 2005: $4,410; 2006: $0.
Biggest contracts:
$138,055 with Navy for Architect - Engineer Services (including landscaping, interior layout, and designing). Signed on 2002-02-27. Completion date: 2002-05-29.
$102,378, same as above.Signed on 2001-04-09. Completion date: 2001-06-22.
$82,201, same as above.Signed on 2000-07-13. Completion date: 2001-01-13.
$65,243, same as above.Signed on 2003-02-06. Completion date: 2003-06-24.
ECOLOGICAL RESTORATION SERVICE (3762 BRANT ST; small business) : $525,625 in 8 contractsfrom 2000 to 2005
Contracts for Natural Resource Studies, Other Environmental Services, Studies, and Analytical Support by Navy Signed by year:2000: $64,000; 2001: $0; 2002: $14,000; 2003: $0; 2004: $236,225; 2005: $211,400; 2006: $0.
Biggest contracts:
$171,600 with Navy for Natural Resource Studies. Signed on 2004-09-16. Completion date: 2006-09-15.
$132,950, same as above.Signed on 2005-06-15. Completion date: 2006-06-15.
$64,625, same as above.Signed on 2004-09-23. Completion date: 2006-09-22.
$64,000 with Navy for Other Environmental Services, Studies, and Analytical Support. Signed on 2000-03-01. Completion date: 2001-02-28.
SUSAN HOROWITZ MD (4245 WITHERBYST; small business) : $519,198 in 8 contractsfrom 1999 to 2005
Contracts for Pediatric Services, General Health Care Services by Navy Signed by year:2000: $83,520; 2001: $85,190; 2002: $86,892; 2003: $88,625; 2004: $91,292; 2005: $1,727; 2006: $0.
Biggest contracts:
$90,400 with Navy for Pediatric Services. Signed on 2004-10-14. Completion date: 2005-09-30.
$88,625, same as above.Signed on 2003-10-01. Completion date: 2004-09-30.
$86,892, same as above.Signed on 2002-10-01. Completion date: 2003-09-30.
$85,190, same as above.Signed on 2001-10-01. Completion date: 2001-09-30.
SCRIPPS MERCY HOSPITAL (4077 FIFTH AVENUE) : $446,073 in 8 contractsfrom 2000 to 2005
Contracts for Other Medical Services, Education Services, General Health Care Services by Navy, Bureau of Prisoners/Federal Prison System Signed by year:2000: $60,000; 2001: $60,000; 2002: $67,500; 2003: $70,500; 2004: $108,873; 2005: $79,200; 2006: $0.
Biggest contracts:
$95,500 with Navy for Other Medical Services. Signed on 2004-09-19. Completion date: 2005-09-30.
$79,200, same as above.Signed on 2005-11-02. Completion date: 2006-09-30.
$70,500 with Navy for Education Services. Signed on 2003-10-21. Completion date: 2004-09-30.
$67,500, same as above.Signed on 2002-12-16. Completion date: 2003-09-30.
Top industries in this zip code by the number of employees in 2005:
Health Care and Social Assistance: General Medical and Surgical Hospitals (over 1000 employees: 2 establishments)
Health Care and Social Assistance: Specialty (except Psychiatric and Substance Abuse) Hospitals (over 1000: 1, 100-249: 1)
2005 - 2018 National Fire Incident Reporting System (NFIRS) incidents
Based on the data from the years 2005 - 2018 the average number of fire incidents per year is 46. The highest number of fire incidents - 96 took place in 2010, and the least - 0 in 2008. The data has a rising trend.
When looking into fire subcategories, the most reports belonged to: Structure Fires (47.5%), and Outside Fires (30.5%).
Fire incident types reported to NFIRS in Zip Code 92103

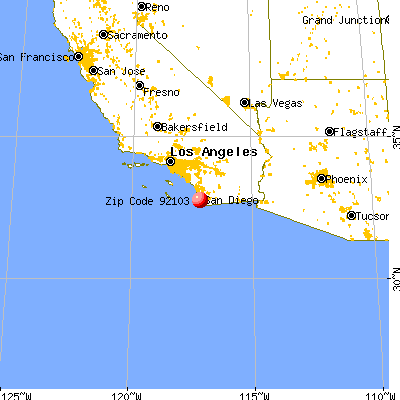


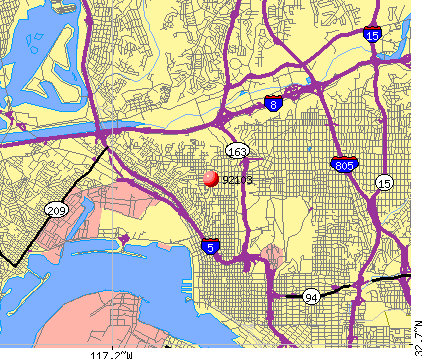 Nearest zip codes: 92101, 92134, 92140, 92132, 92108, 92110.


 Based on the data from the years 2005 - 2018 the average number of fire incidents per year is 46. The highest number of fire incidents - 96 took place in 2010, and the least - 0 in 2008. The data has a rising trend.
 When looking into fire subcategories, the most reports belonged to: Structure Fires (47.5%), and Outside Fires (30.5%).