Estimated zip code population in 2022: 27,142 Zip code population in 2010: 23,911 Zip code population in 2000: 17,169
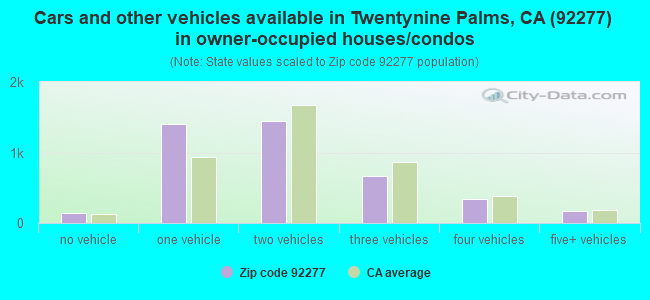
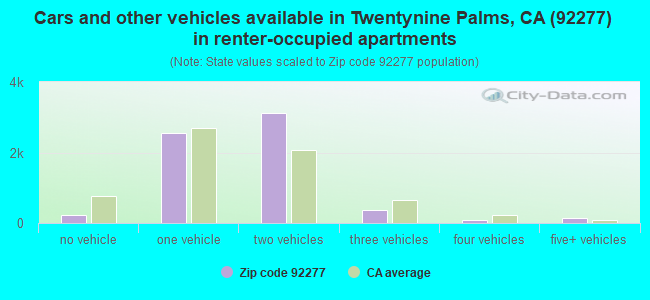
Houses and condos: 13,363 Renter-occupied apartments: 6,531
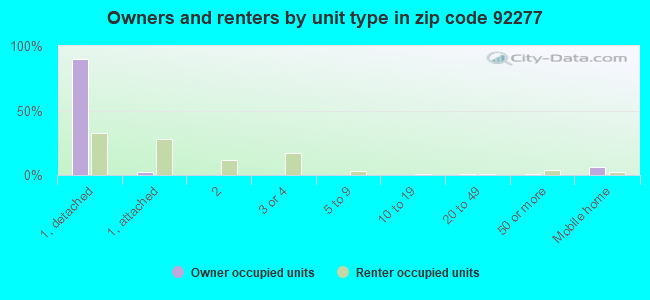
% of renters here:
61%
State:
44%
March 2022 cost of living index in zip code 92277: 80.7 (low, U.S. average is 100)
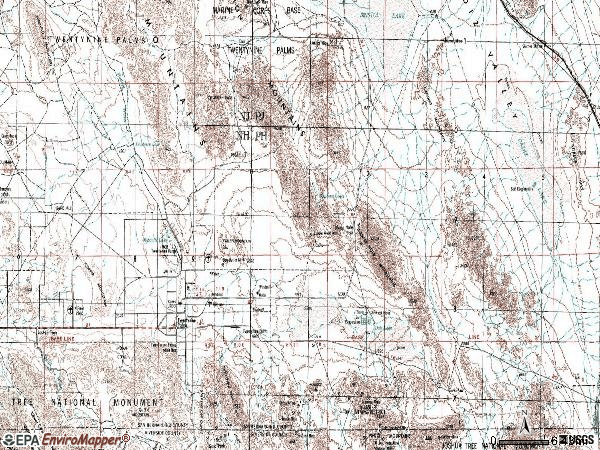
Land area: 1395.0 sq. mi. Water area: 0.0 sq. mi.
Population density: 19 people per square mile
(very low).
OSM Map
General Map
Google Map
MSN Map
OSM Map
General Map
Google Map
MSN Map
OSM Map
General Map
Google Map
MSN Map
OSM Map
General Map
Google Map
MSN Map
Please wait while loading the map...
Real estate property taxes paid for housing units in 2022:
This zip code:
0.7% ($1,465)
California:
0.7% ($4,831)
Median real estate property taxes paid for housing units with mortgages in 2022: $1,706 (0.7%) Median real estate property taxes paid for housing units with no mortgage in 2022: $1,342 (0.8%)
Averages for the 2020 tax year for zip code 92277, filed in 2021:
Average Adjusted Gross Income (AGI) in 2020: $46,857 (Individual Income Tax Returns)
Here:
$46,857
State:
$95,910
Salary/wage: $43,467 (reported on 83.0% of returns)
Here:
$43,467
State:
$77,331
(% of AGI for various income ranges: 1146.4% for AGIs below $25k, 3547.1% for AGIs $25k-50k, 6187.1% for AGIs $50k-75k, 9319.6% for AGIs $75k-100k, 15837.2% for AGIs $100k-200k, 80005.0% for AGIs over 200k)
Taxable interest for individuals: $482 (reported on 24.2% of returns)
This zip code:
$482
California:
$2,294
(% of AGI for various income ranges: 6.8% for AGIs below $25k, 6.9% for AGIs $25k-50k, 13.2% for AGIs $50k-75k, 30.4% for AGIs $75k-100k, 65.2% for AGIs $100k-200k, 515.0% for AGIs over 200k)
Ordinary dividends: $1,939 (reported on 8.9% of returns)
Here:
$1,939
State:
$10,949
(% of AGI for various income ranges: 7.5% for AGIs below $25k, 8.0% for AGIs $25k-50k, 13.4% for AGIs $50k-75k, 15.7% for AGIs $75k-100k, 136.3% for AGIs $100k-200k, 1520.0% for AGIs over 200k)
Net capital gain/loss in AGI: +$7,314 (reported on 10.0% of returns)
Here:
+$7,314
State:
+$49,306
(% of AGI for various income ranges: 5.8% for AGIs below $25k, 17.6% for AGIs $25k-50k, 52.5% for AGIs $50k-75k, 113.5% for AGIs $75k-100k, 442.4% for AGIs $100k-200k, 13920.0% for AGIs over 200k)
Profit/loss from business: +$7,828 (reported on 13.3% of returns)
Here:
+$7,828
State:
+$15,671
(% of AGI for various income ranges: 77.4% for AGIs below $25k, 81.6% for AGIs $25k-50k, 115.2% for AGIs $50k-75k, 210.8% for AGIs $75k-100k, 662.0% for AGIs $100k-200k)
Taxable individual retirement arrangement distribution: $11,362 (reported on 3.2% of returns)
92277:
$11,362
California:
$23,505
(% of AGI for various income ranges: 16.4% for AGIs below $25k, 18.6% for AGIs $25k-50k, 49.4% for AGIs $50k-75k, 82.2% for AGIs $75k-100k, 313.3% for AGIs $100k-200k)
Total itemized deductions: $29,862 (reported on 3.8% of returns)
Here:
$29,862
State:
$39,517
(% of AGI for various income ranges: 17.9% for AGIs below $25k, 32.5% for AGIs $25k-50k, 139.6% for AGIs $50k-75k, 360.4% for AGIs $75k-100k, 782.8% for AGIs $100k-200k, 9335.0% for AGIs over 200k)
Charity contributions: $8,383 (reported on 2.7% of returns)
Here:
$8,383
State:
$12,598
(% of AGI for various income ranges: 6.5% for AGIs $25k-50k, 23.4% for AGIs $50k-75k, 52.7% for AGIs $75k-100k, 197.4% for AGIs $100k-200k, 2025.0% for AGIs over 200k)
Taxes paid: $6,432 (reported on 3.8% of returns)
92277:
$6,432
State:
$8,807
(% of AGI for various income ranges: 2.6% for AGIs below $25k, 5.8% for AGIs $25k-50k, 27.5% for AGIs $50k-75k, 88.4% for AGIs $75k-100k, 198.9% for AGIs $100k-200k, 1500.0% for AGIs over 200k)
Earned income credit: $2,370 (reported on 23.6% of returns)
Here:
$2,370
State:
$2,074
(% of AGI for various income ranges: 114.7% for AGIs below $25k, 86.3% for AGIs $25k-50k, 2.3% for AGIs $50k-75k)
Percentage of individuals using paid preparers for their 2020 taxes: 95.7%
Here:
96%
State:
92%
(% for various income ranges: 94.8% for AGIs below $25k, 95.9% for AGIs $25k-50k, 96.4% for AGIs $50k-75k, 95.8% for AGIs $75k-100k, 96.1% for AGIs $100k-200k, 100.0% for AGIs over 200k)
Averages for the 2012 tax year for zip code 92277, filed in 2013:
Average Adjusted Gross Income (AGI) in 2012: $39,209 (Individual Income Tax Returns)
Here:
$39,209
State:
$72,726
Salary/wage: $36,170 (reported on 88.8% of returns)
Here:
$36,170
State:
$59,079
(% of AGI for various income ranges: 86.5% for AGIs below $25k, 88.6% for AGIs $25k-50k, 81.1% for AGIs $50k-75k, 79.7% for AGIs $75k-100k, 75.9% for AGIs $100k-200k, 50.1% for AGIs over 200k)
Taxable interest for individuals: $469 (reported on 26.4% of returns)
This zip code:
$469
California:
$2,146
(% of AGI for various income ranges: 0.4% for AGIs below $25k, 0.3% for AGIs $25k-50k, 0.3% for AGIs $50k-75k, 0.4% for AGIs $75k-100k, 0.3% for AGIs $100k-200k, 0.7% for AGIs over 200k)
Ordinary dividends: $1,720 (reported on 8.4% of returns)
Here:
$1,720
State:
$9,308
(% of AGI for various income ranges: 0.4% for AGIs below $25k, 0.3% for AGIs $25k-50k, 0.3% for AGIs $50k-75k, 0.6% for AGIs $75k-100k, 0.4% for AGIs $100k-200k)
Net capital gain/loss in AGI: +$992 (reported on 6.0% of returns)
Here:
+$992
State:
+$30,460
(% of AGI for various income ranges: 0.2% for AGIs $25k-50k, 0.2% for AGIs $75k-100k, 0.4% for AGIs $100k-200k)
Profit/loss from business: +$6,913 (reported on 9.0% of returns)
Here:
+$6,913
State:
+$17,064
(% of AGI for various income ranges: 4.0% for AGIs below $25k, 1.2% for AGIs $25k-50k, 0.7% for AGIs $50k-75k, 0.9% for AGIs $75k-100k, 1.6% for AGIs $100k-200k)
Taxable individual retirement arrangement distribution: $9,825 (reported on 3.3% of returns)
92277:
$9,825
California:
$19,557
(% of AGI for various income ranges: 0.7% for AGIs below $25k, 0.5% for AGIs $25k-50k, 0.8% for AGIs $50k-75k, 0.7% for AGIs $75k-100k, 1.7% for AGIs $100k-200k)
Total itemized deductions: $19,305 (24% of AGI, reported on 17.8% of returns)
Here:
$19,305
State:
$34,004
Here:
24.2% of AGI
State:
22.7% of AGI
(% of AGI for various income ranges: 3.9% for AGIs below $25k, 5.5% for AGIs $25k-50k, 9.0% for AGIs $50k-75k, 10.9% for AGIs $75k-100k, 14.6% for AGIs $100k-200k, 15.8% for AGIs over 200k)
Charity contributions: $3,336 (reported on 12.1% of returns)
Here:
$3,336
State:
$4,659
(% of AGI for various income ranges: 0.3% for AGIs below $25k, 0.5% for AGIs $25k-50k, 1.2% for AGIs $50k-75k, 1.5% for AGIs $75k-100k, 1.9% for AGIs $100k-200k, 0.6% for AGIs over 200k)
Taxes paid: $5,823 (reported on 17.6% of returns)
92277:
$5,823
State:
$14,448
(% of AGI for various income ranges: 0.7% for AGIs below $25k, 1.3% for AGIs $25k-50k, 2.3% for AGIs $50k-75k, 3.3% for AGIs $75k-100k, 5.2% for AGIs $100k-200k, 6.6% for AGIs over 200k)
Earned income credit: $2,587 (reported on 30.2% of returns)
Here:
$2,587
State:
$2,286
(% of AGI for various income ranges: 8.6% for AGIs below $25k, 2.2% for AGIs $25k-50k)
Percentage of individuals using paid preparers for their 2012 taxes: 38.0%
Here:
38%
State:
64%
(% for various income ranges: 35.9% for AGIs below $25k, 35.4% for AGIs $25k-50k, 42.3% for AGIs $50k-75k, 45.5% for AGIs $75k-100k, 46.0% for AGIs $100k-200k, 100.0% for AGIs over 200k)
Averages for the 2004 tax year for zip code 92277, filed in 2005:
Average Adjusted Gross Income (AGI) in 2004: $31,827 (Individual Income Tax Returns)
Here:
$31,827
State:
$58,600
Salary/wage: $28,720 (reported on 88.3% of returns)
Here:
$28,720
State:
$49,455
(% of AGI for various income ranges: 115.4% for AGIs below $10k, 85.7% for AGIs $10k-25k, 86.5% for AGIs $25k-50k, 80.2% for AGIs $50k-75k, 74.4% for AGIs $75k-100k, 57.7% for AGIs over 100k)
Taxable interest for individuals: $772 (reported on 32.5% of returns)
This zip code:
$772
California:
$2,365
(% of AGI for various income ranges: 1.8% for AGIs below $10k, 0.9% for AGIs $10k-25k, 0.7% for AGIs $25k-50k, 0.8% for AGIs $50k-75k, 0.8% for AGIs $75k-100k, 0.7% for AGIs over 100k)
Taxable dividends: $1,277 (reported on 11.0% of returns)
Here:
$1,277
State:
$4,746
(% of AGI for various income ranges: 0.6% for AGIs below $10k, 0.3% for AGIs $10k-25k, 0.3% for AGIs $25k-50k, 0.4% for AGIs $50k-75k, 0.8% for AGIs $75k-100k, 0.6% for AGIs over 100k)
Net capital gain/loss: +$9,822 (reported on 8.7% of returns)
Here:
+$9,822
State:
+$23,418
(% of AGI for various income ranges: -1.2% for AGIs below $10k, 0.3% for AGIs $10k-25k, 0.6% for AGIs $25k-50k, 1.1% for AGIs $50k-75k, 1.9% for AGIs $75k-100k, 12.7% for AGIs over 100k)
Profit/loss from business: +$6,640 (reported on 10.0% of returns)
Here:
+$6,640
State:
+$16,826
(% of AGI for various income ranges: 4.7% for AGIs below $10k, 2.5% for AGIs $10k-25k, 0.7% for AGIs $25k-50k, 1.6% for AGIs $50k-75k, 0.5% for AGIs $75k-100k, 5.5% for AGIs over 100k)
IRA payment deduction: $2,508 (reported on 1.7% of returns)
92277:
$2,508
California:
$3,192
(% of AGI for various income ranges: 0.1% for AGIs $10k-25k, 0.1% for AGIs $25k-50k, 0.2% for AGIs $50k-75k, 0.2% for AGIs $75k-100k)
Self-employed pension: $11,143 (reported on 0.2% of returns)
Here:
$11,143
California:
$17,688
Total itemized deductions: $16,090 (23% of AGI, reported on 15.5% of returns)
Here:
$16,090
State:
$28,113
Here:
23.3% of AGI
State:
25.3% of AGI
(% of AGI for various income ranges: 3.3% for AGIs below $10k, 3.4% for AGIs $10k-25k, 5.0% for AGIs $25k-50k, 10.4% for AGIs $50k-75k, 11.3% for AGIs $75k-100k, 12.7% for AGIs over 100k)
Charity contributions deductions: $3,025 (4% of AGI, reported on 13.1% of returns)
Here:
$3,025
State:
$3,923
Here:
4.2% of AGI
State:
3.3% of AGI
(% of AGI for various income ranges: 0.3% for AGIs below $10k, 0.5% for AGIs $10k-25k, 0.7% for AGIs $25k-50k, 1.7% for AGIs $50k-75k, 1.9% for AGIs $75k-100k, 2.2% for AGIs over 100k)
Total tax: $4,042 (reported on 60.6% of returns)
92277:
$4,042
State:
$10,761
(% of AGI for various income ranges: 2.2% for AGIs below $10k, 2.8% for AGIs $10k-25k, 4.9% for AGIs $25k-50k, 8.3% for AGIs $50k-75k, 10.6% for AGIs $75k-100k, 16.4% for AGIs over 100k)
Earned income credit: $1,909 (reported on 29.3% of returns)
Here:
$1,909
State:
$1,763
Percentage of individuals using paid preparers for their 2004 taxes: 62.5%
Here:
62%
State:
66%
(% for various income ranges: 62.0% for AGIs below $10k, 63.9% for AGIs $10k-25k, 62.0% for AGIs $25k-50k, 60.9% for AGIs $50k-75k, 59.3% for AGIs $75k-100k, 64.1% for AGIs over 100k)
Household received Food Stamps/SNAP in the past 12 months: 1,860 Household did not receive Food Stamps/SNAP in the past 12 months: 8,941
Women who had a birth in the past 12 months: 892 (781 now married, 107 unmarried) Women who did not have a birth in the past 12 months: 6,196 (3,495 now married, 2,657 unmarried)
Housing units in zip code 92277 with a mortgage: 2,219 (121 second mortgage, 32 both second mortgage and home equity loan) Houses without a mortgage: 46
Median monthly owner costs for units with a mortgage: $1,367 Median monthly owner costs for units without a mortgage: $340
Residents with income below the poverty level in 2022:
This zip code:
17.9%
Whole state:
12.2%
Residents with income below 50% of the poverty level in 2022:
This zip code:
9.6%
Whole state:
6.2%
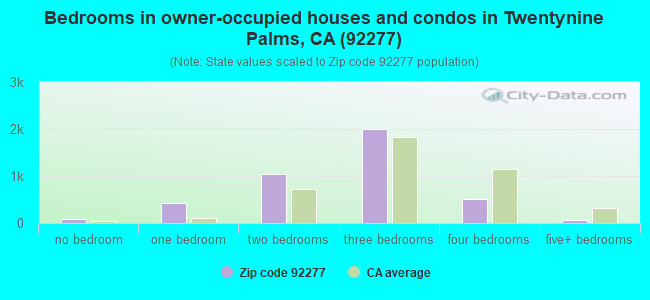
Median number of rooms in houses and condos:
Here:
5.2
State:
6.0
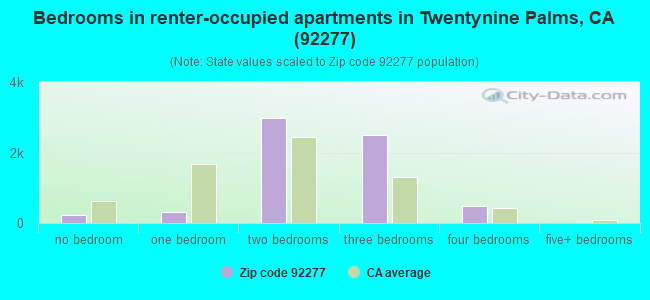
Median number of rooms in apartments:
Here:
4.3
State:
3.9
Notable locations in this zip code not listed on our city pages
In group quarters: 29 (-1 institutionalized population)
Size of family households: 2,611 2-persons, 1,726 3-persons, 1,285 4-persons, 629 5-persons, 413 6-persons, 46 7-or-more-persons
Size of nonfamily households: 3,378 1-person, 538 2-persons, 87 3-persons
5,390 married couples with children.
1,990 single-parent households (393 men, 1,597 women).
82.1% of residents of 92277 zip code speak English at home.
11.1% of residents speak Spanish at home (76% very well, 10% well, 9% not well, 4% not at all).
1.3% of residents speak other Indo-European language at home (94% very well, 2% well, 4% not well).
3.7% of residents speak Asian or Pacific Island language at home (54% very well, 17% well, 26% not well, 3% not at all).
0.8% of residents speak other language at home (88% very well, 12% not well).
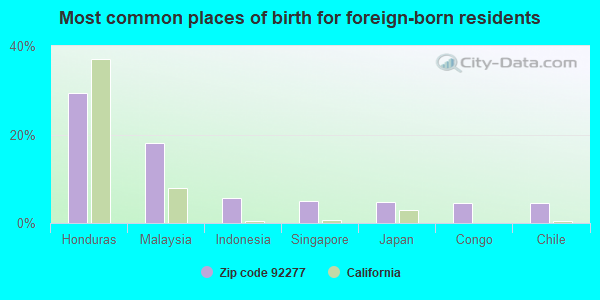
Foreign born population: 2,038 (7.5%) (61.2% of them are naturalized citizens)
This zip code:
7.5%
Whole state:
26.7%
29%Honduras
18%Malaysia
6%Indonesia
5%Singapore
5%Japan
5%Congo
4%Chile
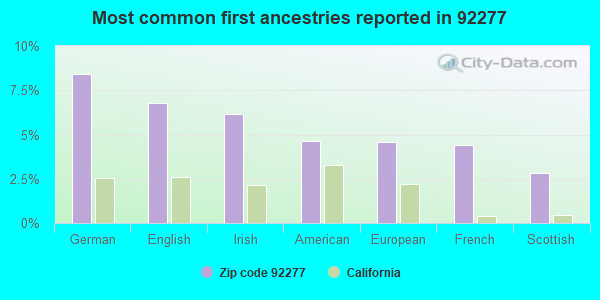
8%German
7%English
6%Irish
5%American
5%European
4%French
3%Scottish
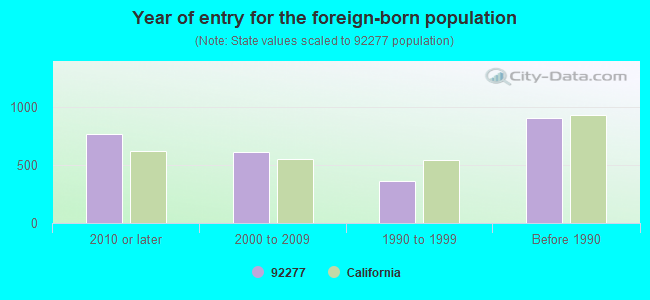
Year of entry for the foreign-born population
7652010 or later
6152000 to 2009
3571990 to 1999
902Before 1990
Facilities with environmental interests located in this zip code:
JOSHUA TREE ELEMENTARY (6051 SUNBURST DR. in TWENTYNINE PALMS, CA)
(National Center for Education Statistics) - STATE ID-6035984 Organizations: MORONGO UNIFIED (SCHOOL DISTRICT)
MONUMENT ALTERNATIVE/CONTINUAT (74748 MICHAELS ROAD in TWENTYNINE PALMS, CA)
(National Center for Education Statistics) - STATE ID-3630209 Organizations: MORONGO UNIFIED (SCHOOL DISTRICT)
CHEVRON STATION 9 1701 (72065 29 PALMS HWY in 29 PALMS, CA)
Small Quantity Generators, between 100 kg and 1000 kg of hazardous waste/month (Resource Conservation and Recovery Act (tracking hazardous waste)) - notification Organizations: CHEVRON USA INC (CONTACT/OWNER)
EQUITY RESOURCES CORP (76161 BASELINE RD in TWENTY NINE PALMS, CA)
Small Quantity Generators, between 100 kg and 1000 kg of hazardous waste/month (Resource Conservation and Recovery Act (tracking hazardous waste)) - notification
FOUR CORNERS PIPELINE CO TWENTYNINE PALMS (174514 INDIAN TRAIL in TWENTYNINE PALMS, CA)
Small Quantity Generators, between 100 kg and 1000 kg of hazardous waste/month (Resource Conservation and Recovery Act (tracking hazardous waste)) Alternative names: FOUR COR PIPELINE CO TWENTY-NINE PALMS
MORONGO UNIFIED SCHOOL DISTRICT (5715 UTAH TRAIL in TWENTYNINE PALMS, CA)
COMPLIANCE ACTIVITY (Tracking inspections of insecticide, fungicide, and rodenticide, and toxic substances) Alternative names: MORONGO USD
GRANITE CONSTRUCTION CO. (7541 MOJAVE ROAD in TWENTY-NINE PALMS, CA)
CRITERIA AND HAZARDOUS AIR POLLUTANT INVENTORY (Inventory of air pollution sources) Business SIC classification: CONSTRUCTION SAND AND GRAVEL
MC GEEZ AUTO BODY (6476 MESQUITE AVENUE in TWENTYNINE PALMS, CA)
CRITERIA AND HAZARDOUS AIR POLLUTANT INVENTORY (Inventory of air pollution sources) Business SIC classification: TOP, BODY, AND UPHOLSTERY REPAIR SHOPS AND PAINT SHOPS
Housing units lacking complete plumbing facilities: 7.2% Housing units lacking complete kitchen facilities: 7.0%
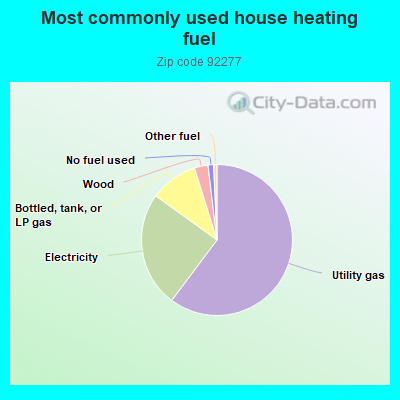
60.0%Utility gas
24.6%Electricity
10.2%Bottled, tank, or LP gas
2.9%Wood
1.2%No fuel used
0.7%Other fuel
Population in 1990: 13,371. Population change in the 1990s: +3,798 (+28.4%).
Place of birth for U.S.-born residents:
This state: 14,122
Northeast: 1,170
Midwest: 2,535
South: 4,590
West: 1,830
42% of the 92277 zip code residents lived in the same house 5 years ago. Out of people who lived in different houses, 38% lived in this county. Out of people who lived in different counties, 50% lived in California.
75% of the 92277 zip code residents lived in the same house 1 year ago. Out of people who lived in different houses, 39% moved from this county. Out of people who lived in different houses, 14% moved from different county within same state. Out of people who lived in different houses, 42% moved from different state. Out of people who lived in different houses, 6% moved from abroad.
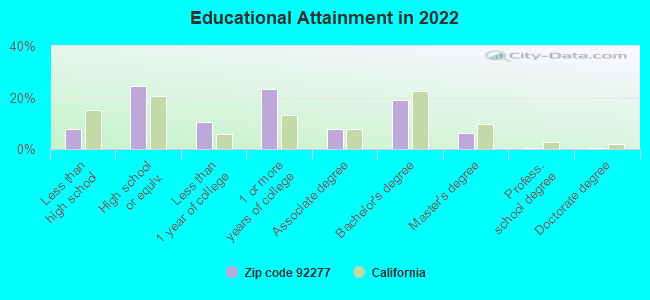
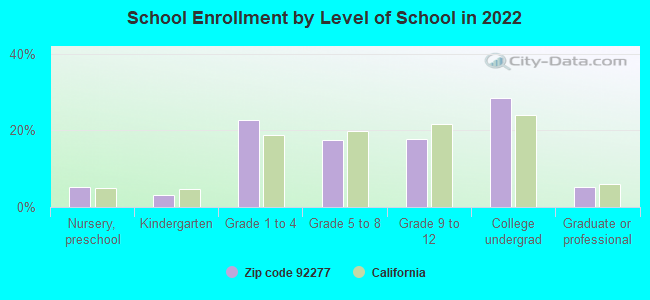
Private vs. public school enrollment:
Students in private schools in grades 1 to 8 (elementary and middle school): 516
Here:
19.6%
California:
10.5%
Students in private schools in grades 9 to 12 (high school): 122
Here:
10.6%
California:
8.5%
Students in private undergraduate colleges: 349
Here:
18.9%
California:
15.9%
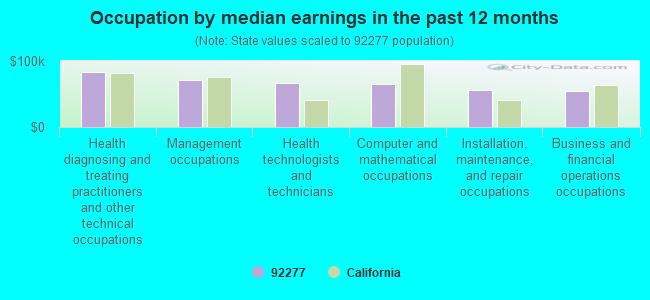
Occupation by median earnings in the past 12 months ($)
83,347Health diagnosing and treating practitioners and other technical occupations
71,066Management occupations
66,682Health technologists and technicians
65,404Computer and mathematical occupations
56,732Installation, maintenance, and repair occupations
54,823Business and financial operations occupations
Companies with biggest federal contracts located in this zip code:
COMMERCIAL DIVERSIFIED, INC (72033 TWENTYNINE PALMS HIG in TWENTYNINE PAL, CA; small business) : $6,953,288 in 56 contractsfrom 1999 to 2003
Contracts for Maintenance, Repair or Alteration of Real Property -- Other Administrative Facilities and Service Buildings, Maintenance, Repair or Alteration of Real Property -- Electronic and Communications Facilities, Maintenance, Repair or Alteration of Real Property -- Water Supply Facilities, Maintenance, Repair or Alteration of Real Property -- Miscellaneous Buildings, and moreby Navy, Public Health Service Signed by year:2000: $5,307,551; 2001: $564,986; 2002: $356,333; 2003: $66,043; 2004: $0; 2005: $0; 2006: $0.
Biggest contracts:
$2,220,000 with Navy for Maintenance, Repair or Alteration of Real Property -- Other Administrative Facilities and Service Buildings. Signed on 2000-12-06. Completion date: 2001-12-21.
$725,000 with Navy for Maintenance, Repair or Alteration of Real Property -- Electronic and Communications Facilities. Signed on 2000-06-09. Completion date: 2001-01-20.
$700,000 with Navy for Maintenance, Repair or Alteration of Real Property -- Water Supply Facilities. Signed on 2000-07-13. Completion date: 2001-07-24.
$650,000 with Navy for Maintenance, Repair or Alteration of Real Property -- Other Administrative Facilities and Service Buildings. Signed on 2000-04-12. Completion date: 2001-04-22.
PROCAL ELECTRIC, INC (1816 SUNRISE AVENUE in 29 PALMS, CA; small business) : $1,370,481 in 60 contractsfrom 1999 to 2006
Contracts for Facilities Operations Support Services, Maintenance, Repair or Alteration of Real Property -- Other Non-Building Facilities by Navy Signed by year:2000: $206,025; 2001: $82,100; 2002: $175,447; 2003: $140,363; 2004: $87,265; 2005: $624,450; 2006: $22,894.
Biggest contracts:
$170,140 with Navy for Facilities Operations Support Services. Signed on 2005-06-24. Completion date: 2005-09-23.
$151,414, same as above.Signed on 2005-09-28. Completion date: 2005-11-15.
$108,998 with Navy for Maintenance, Repair or Alteration of Real Property -- Other Non-Building Facilities. Signed on 2000-04-21. Completion date: 2000-08-29.
$99,600 with Navy for Facilities Operations Support Services. Signed on 2003-01-10. Completion date: 2004-01-13.
J & J ENTERPRISES OWNER JUDY B (72212 TWO MILE RD in TWENTYNINE PAL, CA; small business) : $1,140,587 in 40 contractsfrom 2001 to 2005
Contracts for Lease or Rental of Equipment -- Toiletries, Lease or Rental of Equipment -- Miscellaneous, Toiletry Paper Products, Trash/Garbage Collection Services - Including Portable Sanitation Services, and moreby Navy Signed by year:2000: $0; 2001: $132,904; 2002: $187,476; 2003: $0; 2004: $151,137; 2005: $669,070; 2006: $0.
Biggest contracts:
$318,500 with Navy for Lease or Rental of Equipment -- Toiletries. Signed on 2005-08-04. Completion date: 2005-09-30.
$99,600, same as above.Signed on 2005-05-05. Completion date: 2005-09-30.
$89,363 with Navy for Lease or Rental of Equipment -- Miscellaneous. Signed on 2002-04-16. Completion date: 2002-05-10.
$61,606 with Navy for Toiletry Paper Products. Signed on 2004-12-17. Completion date: 2004-12-17.
MC CONNELL MOTOR PARTS INC (6177 ADOBE RD in TWENTYNINE PAL, CA; small business) : $1,013,905 in 13 contractsfrom 2001 to 2003
Contracts for Miscellaneous Vehicular Components, Maintenance, Repair and Rebuilding of Equipment -- Ground Effect Vehicles, Motor Vehicles, Trailers, and Cycles by Navy Signed by year:2000: $0; 2001: $425,000; 2002: $515,784; 2003: $73,121; 2004: $0; 2005: $0; 2006: $0.
Biggest contracts:
$175,000 with Navy for Miscellaneous Vehicular Components. Signed on 2002-10-16. Completion date: 2003-03-31.
$175,000, same as above.Signed on 2001-10-10. Completion date: 2001-09-30.
$175,000 with Navy for Maintenance, Repair and Rebuilding of Equipment -- Ground Effect Vehicles, Motor Vehicles, Trailers, and Cycles. Signed on 2001-04-01. Completion date: 2001-09-30.
$100,000 with Navy for Miscellaneous Vehicular Components. Signed on 2002-04-12. Completion date: 2003-06-30.
ECO AIR CONTROL, INC (7677 BEDOUIN AVE> in TWENTYNINE PAL, CA; small business) : $969,739 in 6 contractsfrom 1999 to 2000
Contracts for Facilities Operations Support Services, Maintenance, Repair or Alteration of Real Property -- Office Buildings by Navy Signed by year:2000: $396,414; 2001: $0; 2002: $0; 2003: $0; 2004: $0; 2005: $0; 2006: $0.
Biggest contracts:
$573,325 with Navy for Facilities Operations Support Services. Signed on 1999-11-01. Completion date: 2002-01-24.
$218,400 with Navy for Maintenance, Repair or Alteration of Real Property -- Office Buildings. Signed on 2000-09-11. Completion date: 2001-07-23.
$97,930 with Navy for Facilities Operations Support Services. Signed on 2000-11-06. Completion date: 2001-02-24.
$48,741, same as above.Signed on 2000-01-20. Completion date: 2000-09-30.
THE VAN DYKE CORPORATION (6797 ADOBE ROAD in TWENTYNINE PAL, CA; small business) : $463,423 in 5 contractsfrom 2000 to 2001
Contracts for Maintenance, Repair or Alteration of Real Property -- Water Supply Facilities, Maintenance, Repair or Alteration of Real Property -- Tank Automotive Facilities, Maintenance, Repair or Alteration of Real Property -- Other Educational Buildings, Maintenance, Repair or Alteration of Real Property -- Maintenance Buildings by Navy Signed by year:2000: $369,295; 2001: $94,128; 2002: $0; 2003: $0; 2004: $0; 2005: $0; 2006: $0.
Biggest contracts:
$177,925 with Navy for Maintenance, Repair or Alteration of Real Property -- Water Supply Facilities. Signed on 2000-08-28. Completion date: 2001-02-09.
$119,000 with Navy for Maintenance, Repair or Alteration of Real Property -- Tank Automotive Facilities. Signed on 2000-09-07. Completion date: 2001-03-21.
$94,128 with Navy for Maintenance, Repair or Alteration of Real Property -- Other Educational Buildings. Signed on 2001-03-28. Completion date: 2001-10-09.
$68,760 with Navy for Maintenance, Repair or Alteration of Real Property -- Maintenance Buildings. Signed on 2000-06-29. Completion date: 2001-01-10.
WIEFELS & SON (6522 DESERT QUEEN AVE in TWENTYNINE PAL, CA; small business) : $333,624 in 4 contractsfrom 2000 to 2005
$86,948 with Navy for Care of Remains and/or Funeral Services. Signed on 2002-12-24. Completion date: 2003-09-30.
$84,530 with Navy for Lease or Rental of Equipment -- Ground Effect Vehicles, Motor Vehicles, Trailers, and Cycles. Signed on 2005-07-05. Completion date: 2005-08-05.
$82,978 with Navy for Care of Remains and/or Funeral Services. Signed on 2001-08-13. Completion date: 2002-09-30.
$79,168, same as above.Signed on 2000-09-27. Completion date: 2001-09-30.
SIERRA ENVIRONMENTAL SERVICES, (73877 AMBOY RD in TWENTYNINE PALMS, CA; small business) : $302,882 in 5 contractsfrom 1999 to 2002
Contracts for Trash/Garbage Collection Services - Including Portable Sanitation Services by Navy, National Park Service Signed by year:2000: $128,952; 2001: $23,000; 2002: $23,418; 2003: $0; 2004: $0; 2005: $0; 2006: $0.
Biggest contracts:
$128,952 with Navy for Trash/Garbage Collection Services - Including Portable Sanitation Services. Signed on 2000-11-13. Completion date: 2001-11-24.
$127,512, same as above.Signed on 1999-11-01. Completion date: 2000-11-24.
$23,418 with National Park Service for Trash/Garbage Collection Services - Including Portable Sanitation Services. Signed on 2002-11-15. Completion date: 2003-09-15.
$23,000, same as above.Signed on 2001-10-15. Completion date: 2001-09-15.
JOHN'S AIR CONDITIONING (72685 TWO MILE RD in TWENTYNINE PAL, CA; small business) : $126,854 in 3 contractsin 2003
$51,854 with Navy for Maintenance, Repair and Rebuilding of Equipment -- Food Preparation and Serving Equipment. Signed on 2003-10-28. Completion date: 2003-07-18.
$45,000, same as above.Signed on 2003-03-13. Completion date: 2003-07-18.
$30,000, same as above.Signed on 2003-07-31. Completion date: 2003-07-18.
BARR LUMBER CO INC (6854 ADOBE RD in TWENTYNINE PAL, CA; small business) : $80,645 in 2 contractsfrom 2003 to 2005
$64,804 with Navy for Lumber and Related Basic Wood Materials. Signed on 2003-01-23. Completion date: 2003-02-14.
$15,841 with Navy for Hardware, Commercial. Signed on 2005-09-30. Completion date: 2005-10-21.
Top industries in this zip code by the number of employees in 2005:
2005 - 2018 National Fire Incident Reporting System (NFIRS) incidents
Based on the data from the years 2005 - 2018 the average number of fires per year is 24. The highest number of fire incidents - 79 took place in 2006, and the least - 0 in 2011. The data has a growing trend.
When looking into fire subcategories, the most reports belonged to: Structure Fires (39.2%), and Outside Fires (34.8%).
Fire incident types reported to NFIRS in Zip Code 92277


 Nearest zip codes: 92304, 92239, 92278, 92252, 92254, 92236.
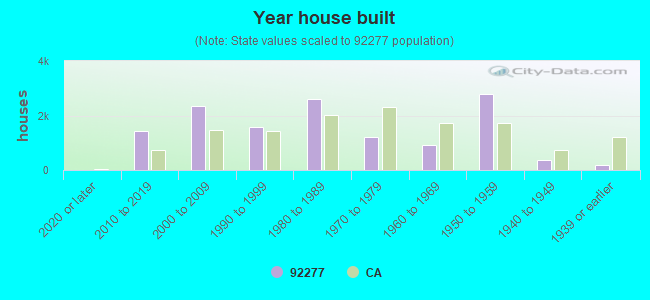


 Based on the data from the years 2005 - 2018 the average number of fires per year is 24. The highest number of fire incidents - 79 took place in 2006, and the least - 0 in 2011. The data has a growing trend.
 When looking into fire subcategories, the most reports belonged to: Structure Fires (39.2%), and Outside Fires (34.8%).