Estimated zip code population in 2022: 25,527 Zip code population in 2010: 25,095 Zip code population in 2000: 20,477
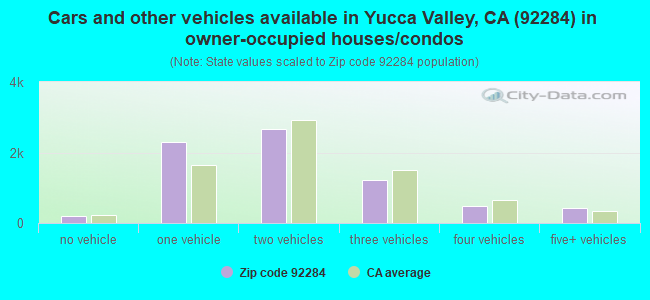
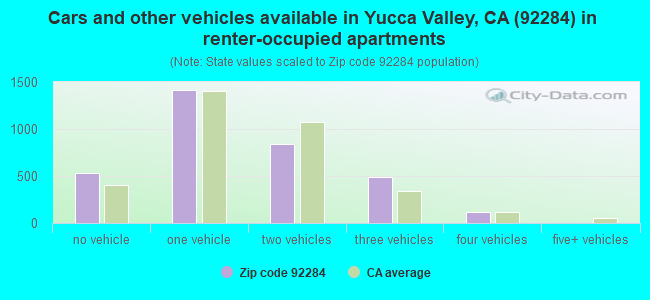
Houses and condos: 12,187 Renter-occupied apartments: 3,382
% of renters here:
32%
State:
44%
March 2022 cost of living index in zip code 92284: 81.5 (low, U.S. average is 100)
Land area: 110.2 sq. mi. Water area: 0.0 sq. mi.
Population density: 232 people per square mile
(very low).
OSM Map
General Map
Google Map
MSN Map
OSM Map
General Map
Google Map
MSN Map
OSM Map
General Map
Google Map
MSN Map
OSM Map
General Map
Google Map
MSN Map
Please wait while loading the map...
Real estate property taxes paid for housing units in 2022:
This zip code:
0.8% ($2,378)
California:
0.7% ($4,831)
Median real estate property taxes paid for housing units with mortgages in 2022: $2,697 (0.8%) Median real estate property taxes paid for housing units with no mortgage in 2022: $1,965 (0.8%)
Averages for the 2020 tax year for zip code 92284, filed in 2021:
Average Adjusted Gross Income (AGI) in 2020: $51,752 (Individual Income Tax Returns)
Here:
$51,752
State:
$95,910
Salary/wage: $46,917 (reported on 73.5% of returns)
Here:
$46,917
State:
$77,331
(% of AGI for various income ranges: 1037.6% for AGIs below $25k, 3310.4% for AGIs $25k-50k, 6771.9% for AGIs $50k-75k, 9858.8% for AGIs $75k-100k, 18743.0% for AGIs $100k-200k, 75636.7% for AGIs over 200k)
Taxable interest for individuals: $846 (reported on 31.3% of returns)
This zip code:
$846
California:
$2,294
(% of AGI for various income ranges: 13.1% for AGIs below $25k, 19.8% for AGIs $25k-50k, 33.1% for AGIs $50k-75k, 61.6% for AGIs $75k-100k, 135.3% for AGIs $100k-200k, 1025.0% for AGIs over 200k)
Ordinary dividends: $3,038 (reported on 10.9% of returns)
Here:
$3,038
State:
$10,949
(% of AGI for various income ranges: 21.0% for AGIs below $25k, 26.8% for AGIs $25k-50k, 37.9% for AGIs $50k-75k, 94.4% for AGIs $75k-100k, 140.0% for AGIs $100k-200k, 1156.7% for AGIs over 200k)
Net capital gain/loss in AGI: +$17,084 (reported on 11.9% of returns)
Here:
+$17,084
State:
+$49,306
(% of AGI for various income ranges: 6.4% for AGIs below $25k, 37.3% for AGIs $25k-50k, 70.6% for AGIs $50k-75k, 301.2% for AGIs $75k-100k, 902.8% for AGIs $100k-200k, 21583.3% for AGIs over 200k)
Profit/loss from business: +$13,161 (reported on 19.6% of returns)
Here:
+$13,161
State:
+$15,671
(% of AGI for various income ranges: 142.7% for AGIs below $25k, 239.4% for AGIs $25k-50k, 354.4% for AGIs $50k-75k, 499.3% for AGIs $75k-100k, 1046.0% for AGIs $100k-200k, 10645.0% for AGIs over 200k)
Taxable individual retirement arrangement distribution: $14,652 (reported on 6.5% of returns)
92284:
$14,652
California:
$23,505
(% of AGI for various income ranges: 47.0% for AGIs below $25k, 96.0% for AGIs $25k-50k, 155.9% for AGIs $50k-75k, 218.6% for AGIs $75k-100k, 627.5% for AGIs $100k-200k, 1025.0% for AGIs over 200k)
Total itemized deductions: $27,716 (reported on 7.4% of returns)
Here:
$27,716
State:
$39,517
(% of AGI for various income ranges: 50.6% for AGIs below $25k, 109.5% for AGIs $25k-50k, 357.4% for AGIs $50k-75k, 639.1% for AGIs $75k-100k, 1296.8% for AGIs $100k-200k, 6683.3% for AGIs over 200k)
Charity contributions: $6,258 (reported on 5.5% of returns)
Here:
$6,258
State:
$12,598
(% of AGI for various income ranges: 2.1% for AGIs below $25k, 11.5% for AGIs $25k-50k, 66.7% for AGIs $50k-75k, 93.9% for AGIs $75k-100k, 284.3% for AGIs $100k-200k, 1058.3% for AGIs over 200k)
Taxes paid: $7,375 (reported on 7.4% of returns)
92284:
$7,375
State:
$8,807
(% of AGI for various income ranges: 9.7% for AGIs below $25k, 22.0% for AGIs $25k-50k, 100.6% for AGIs $50k-75k, 208.6% for AGIs $75k-100k, 385.5% for AGIs $100k-200k, 1385.0% for AGIs over 200k)
Earned income credit: $2,118 (reported on 21.0% of returns)
Here:
$2,118
State:
$2,074
(% of AGI for various income ranges: 103.9% for AGIs below $25k, 86.0% for AGIs $25k-50k, 2.1% for AGIs $50k-75k)
Percentage of individuals using paid preparers for their 2020 taxes: 93.1%
Here:
93%
State:
92%
(% for various income ranges: 91.8% for AGIs below $25k, 94.2% for AGIs $25k-50k, 93.4% for AGIs $50k-75k, 93.3% for AGIs $75k-100k, 94.3% for AGIs $100k-200k, 95.7% for AGIs over 200k)
Averages for the 2012 tax year for zip code 92284, filed in 2013:
Average Adjusted Gross Income (AGI) in 2012: $41,980 (Individual Income Tax Returns)
Here:
$41,980
State:
$72,726
Salary/wage: $38,627 (reported on 77.1% of returns)
Here:
$38,627
State:
$59,079
(% of AGI for various income ranges: 65.9% for AGIs below $25k, 73.0% for AGIs $25k-50k, 73.6% for AGIs $50k-75k, 74.8% for AGIs $75k-100k, 72.5% for AGIs $100k-200k, 50.4% for AGIs over 200k)
Taxable interest for individuals: $1,057 (reported on 33.9% of returns)
This zip code:
$1,057
California:
$2,146
(% of AGI for various income ranges: 1.4% for AGIs below $25k, 0.9% for AGIs $25k-50k, 0.7% for AGIs $50k-75k, 0.8% for AGIs $75k-100k, 0.7% for AGIs $100k-200k, 0.8% for AGIs over 200k)
Ordinary dividends: $2,227 (reported on 12.5% of returns)
Here:
$2,227
State:
$9,308
(% of AGI for various income ranges: 1.2% for AGIs below $25k, 0.5% for AGIs $25k-50k, 0.6% for AGIs $50k-75k, 0.6% for AGIs $75k-100k, 0.5% for AGIs $100k-200k, 0.8% for AGIs over 200k)
Net capital gain/loss in AGI: +$2,543 (reported on 10.6% of returns)
Here:
+$2,543
State:
+$30,460
(% of AGI for various income ranges: 0.3% for AGIs $50k-75k, 0.5% for AGIs $75k-100k, 0.9% for AGIs $100k-200k, 5.7% for AGIs over 200k)
Profit/loss from business: +$11,370 (reported on 17.6% of returns)
Here:
+$11,370
State:
+$17,064
(% of AGI for various income ranges: 10.4% for AGIs below $25k, 4.5% for AGIs $25k-50k, 3.0% for AGIs $50k-75k, 3.0% for AGIs $75k-100k, 5.6% for AGIs $100k-200k)
Taxable individual retirement arrangement distribution: $12,775 (reported on 7.9% of returns)
92284:
$12,775
California:
$19,557
(% of AGI for various income ranges: 2.6% for AGIs below $25k, 2.0% for AGIs $25k-50k, 2.4% for AGIs $50k-75k, 2.2% for AGIs $75k-100k, 3.3% for AGIs $100k-200k)
Self-employment retirement plans: $18,550 (reported on 0.2% of returns)
92284:
$18,550
California:
$24,530
Total itemized deductions: $20,328 (27% of AGI, reported on 29.1% of returns)
Here:
$20,328
State:
$34,004
Here:
26.7% of AGI
State:
22.7% of AGI
(% of AGI for various income ranges: 10.3% for AGIs below $25k, 11.7% for AGIs $25k-50k, 13.3% for AGIs $50k-75k, 16.2% for AGIs $75k-100k, 17.5% for AGIs $100k-200k, 14.2% for AGIs over 200k)
Charity contributions: $3,055 (reported on 21.4% of returns)
Here:
$3,055
State:
$4,659
(% of AGI for various income ranges: 0.7% for AGIs below $25k, 1.2% for AGIs $25k-50k, 1.4% for AGIs $50k-75k, 2.0% for AGIs $75k-100k, 2.1% for AGIs $100k-200k, 2.1% for AGIs over 200k)
Taxes paid: $5,888 (reported on 28.8% of returns)
92284:
$5,888
State:
$14,448
(% of AGI for various income ranges: 1.7% for AGIs below $25k, 2.3% for AGIs $25k-50k, 3.4% for AGIs $50k-75k, 4.7% for AGIs $75k-100k, 6.2% for AGIs $100k-200k, 7.5% for AGIs over 200k)
Earned income credit: $2,349 (reported on 26.9% of returns)
Here:
$2,349
State:
$2,286
(% of AGI for various income ranges: 8.7% for AGIs below $25k, 1.5% for AGIs $25k-50k)
Percentage of individuals using paid preparers for their 2012 taxes: 53.2%
Here:
53%
State:
64%
(% for various income ranges: 47.0% for AGIs below $25k, 54.0% for AGIs $25k-50k, 57.1% for AGIs $50k-75k, 60.6% for AGIs $75k-100k, 70.1% for AGIs $100k-200k, 85.7% for AGIs over 200k)
Averages for the 2004 tax year for zip code 92284, filed in 2005:
Average Adjusted Gross Income (AGI) in 2004: $38,341 (Individual Income Tax Returns)
Here:
$38,341
State:
$58,600
Salary/wage: $34,506 (reported on 76.1% of returns)
Here:
$34,506
State:
$49,455
(% of AGI for various income ranges: 104.0% for AGIs below $10k, 66.1% for AGIs $10k-25k, 73.7% for AGIs $25k-50k, 77.0% for AGIs $50k-75k, 77.0% for AGIs $75k-100k, 50.8% for AGIs over 100k)
Taxable interest for individuals: $1,642 (reported on 43.8% of returns)
This zip code:
$1,642
California:
$2,365
(% of AGI for various income ranges: 7.6% for AGIs below $10k, 3.1% for AGIs $10k-25k, 1.6% for AGIs $25k-50k, 1.3% for AGIs $50k-75k, 1.2% for AGIs $75k-100k, 1.9% for AGIs over 100k)
Taxable dividends: $2,357 (reported on 17.2% of returns)
Here:
$2,357
State:
$4,746
(% of AGI for various income ranges: 5.2% for AGIs below $10k, 1.2% for AGIs $10k-25k, 0.8% for AGIs $25k-50k, 0.6% for AGIs $50k-75k, 0.4% for AGIs $75k-100k, 1.7% for AGIs over 100k)
Net capital gain/loss: +$15,632 (reported on 17.0% of returns)
Here:
+$15,632
State:
+$23,418
(% of AGI for various income ranges: -3.2% for AGIs below $10k, 0.8% for AGIs $10k-25k, 1.2% for AGIs $25k-50k, 2.2% for AGIs $50k-75k, 4.4% for AGIs $75k-100k, 21.1% for AGIs over 100k)
Profit/loss from business: +$12,849 (reported on 17.5% of returns)
Here:
+$12,849
State:
+$16,826
(% of AGI for various income ranges: -15.1% for AGIs below $10k, 8.1% for AGIs $10k-25k, 4.5% for AGIs $25k-50k, 3.7% for AGIs $50k-75k, 4.5% for AGIs $75k-100k, 10.1% for AGIs over 100k)
IRA payment deduction: $3,087 (reported on 2.4% of returns)
92284:
$3,087
California:
$3,192
(% of AGI for various income ranges: 0.3% for AGIs $10k-25k, 0.3% for AGIs $25k-50k, 0.1% for AGIs $50k-75k, 0.2% for AGIs $75k-100k, 0.2% for AGIs over 100k)
Self-employed pension: $14,822 (reported on 0.6% of returns)
Here:
$14,822
California:
$17,688
Total itemized deductions: $18,051 (26% of AGI, reported on 33.4% of returns)
Here:
$18,051
State:
$28,113
Here:
26.4% of AGI
State:
25.3% of AGI
(% of AGI for various income ranges: 21.6% for AGIs below $10k, 11.6% for AGIs $10k-25k, 13.7% for AGIs $25k-50k, 17.0% for AGIs $50k-75k, 18.3% for AGIs $75k-100k, 16.6% for AGIs over 100k)
Charity contributions deductions: $2,667 (4% of AGI, reported on 27.9% of returns)
Here:
$2,667
State:
$3,923
Here:
3.7% of AGI
State:
3.3% of AGI
(% of AGI for various income ranges: 1.6% for AGIs below $10k, 1.0% for AGIs $10k-25k, 1.5% for AGIs $25k-50k, 2.1% for AGIs $50k-75k, 2.2% for AGIs $75k-100k, 2.6% for AGIs over 100k)
Total tax: $5,083 (reported on 72.6% of returns)
92284:
$5,083
State:
$10,761
(% of AGI for various income ranges: 4.0% for AGIs below $10k, 4.1% for AGIs $10k-25k, 6.5% for AGIs $25k-50k, 8.5% for AGIs $50k-75k, 10.1% for AGIs $75k-100k, 16.1% for AGIs over 100k)
Earned income credit: $1,675 (reported on 19.6% of returns)
Here:
$1,675
State:
$1,763
Percentage of individuals using paid preparers for their 2004 taxes: 67.9%
Here:
68%
State:
66%
(% for various income ranges: 63.7% for AGIs below $10k, 67.9% for AGIs $10k-25k, 68.2% for AGIs $25k-50k, 67.2% for AGIs $50k-75k, 71.7% for AGIs $75k-100k, 78.9% for AGIs over 100k)
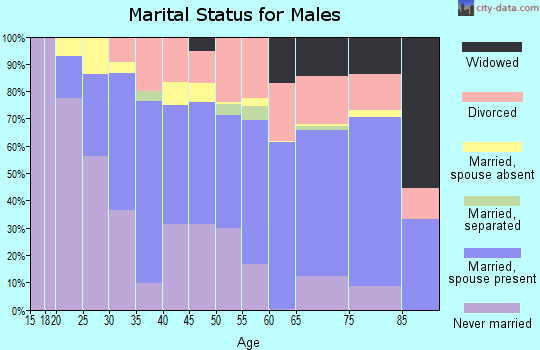
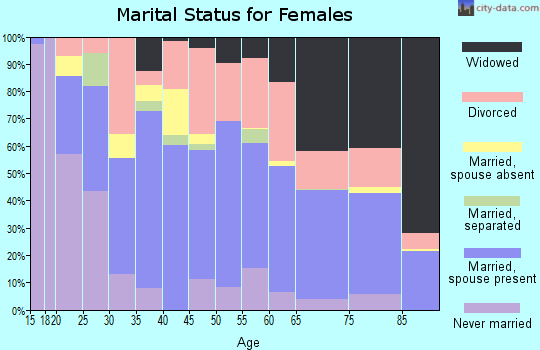
Likely homosexual households (counted as self-reported same-sex unmarried-partner households)
Lesbian couples: 0.1% of all households
Gay men: 0.2% of all households
Household received Food Stamps/SNAP in the past 12 months: 1,941 Household did not receive Food Stamps/SNAP in the past 12 months: 8,818
Women who had a birth in the past 12 months: 181 (79 now married, 103 unmarried) Women who did not have a birth in the past 12 months: 5,621 (2,003 now married, 3,627 unmarried)
Housing units in zip code 92284 with a mortgage: 4,328 (185 second mortgage, 33 home equity loan, 68 both second mortgage and home equity loan) Median monthly owner costs for units with a mortgage: $1,594 Median monthly owner costs for units without a mortgage: $563
Residents with income below the poverty level in 2022:
This zip code:
20.5%
Whole state:
12.2%
Residents with income below 50% of the poverty level in 2022:
This zip code:
12.1%
Whole state:
6.2%
Median number of rooms in houses and condos:
Here:
5.3
State:
6.0
Median number of rooms in apartments:
Here:
4.3
State:
3.9
Notable locations in this zip code not listed on our city pages
2,712 married couples with children.
2,433 single-parent households (1,049 men, 1,384 women).
82.1% of residents of 92284 zip code speak English at home.
13.9% of residents speak Spanish at home (74% very well, 11% well, 14% not well, 1% not at all).
2.0% of residents speak other Indo-European language at home (63% very well, 3% well, 35% not well).
1.4% of residents speak Asian or Pacific Island language at home (49% very well, 37% well, 14% not well).
0.3% of residents speak other language at home (100% very well).
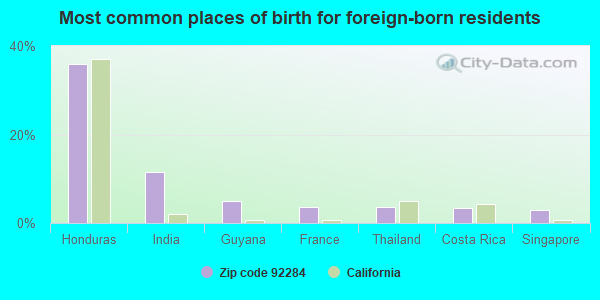
Foreign born population: 2,169 (8.5%) (65.4% of them are naturalized citizens)
Facilities with environmental interests located in this zip code:
NORGE VILLAGE CLEANERS (56438 29 PALM HWY 62 in YUCCA VALLEY, CA)
STATE MASTER (California - Hazardous Waste Tracking) - HAZARDOU WASTE PROGRAM Small Quantity Generators, between 100 kg and 1000 kg of hazardous waste/month (Resource Conservation and Recovery Act (tracking hazardous waste)) - notification Organizations: GYOO HWANG (CONTACT/OWNER)
HI DESERT DISPOSAL (4878 NEWTON LN in YUCCA VALLEY, CA)
STATE MASTER (California - Hazardous Waste Tracking) - HAZARDOU WASTE PROGRAM Small Quantity Generators, between 100 kg and 1000 kg of hazardous waste/month (Resource Conservation and Recovery Act (tracking hazardous waste)) - notification Organizations: WASTE MANAGEMENT (CONTACT/OWNER)
Alternative names: WASTE MANAGEMENT OF HI-DESERT
LAIDLAW TRANSIT (59267 SUNNY SLOPE in YUCCA VALLEY, CA)
STATE MASTER (California - Hazardous Waste Tracking) - HAZARDOU WASTE PROGRAM Small Quantity Generators, between 100 kg and 1000 kg of hazardous waste/month (Resource Conservation and Recovery Act (tracking hazardous waste)) - notification
CALTRANS DISTRICT 8 PARADISE VALLEY (6690 LA CONTENTA RD in YUCCA VALLEY, CA)
STATE MASTER (California - Hazardous Waste Tracking) - HAZARDOU WASTE PROGRAM Small Quantity Generators, between 100 kg and 1000 kg of hazardous waste/month (Resource Conservation and Recovery Act (tracking hazardous waste))
LA CONTENTA JUNIOR HIGH (7050 LA CONTENTA ROAD in YUCCA VALLEY, CA)
(National Center for Education Statistics) - STATE ID-6106579 Organizations: MORONGO UNIFIED (SCHOOL DISTRICT)
GEORGES RADIATOR SHOP (56448 29 PALMS HWY in YUCCA VALLEY, CA)
Small Quantity Generators, between 100 kg and 1000 kg of hazardous waste/month (Resource Conservation and Recovery Act (tracking hazardous waste)) - notification Organizations: KRIDELBAUCH KILE (CONTACT/OWNER)
HI DESERT DISPOSAL (7112 MIAMI TRAIL in YUCCA VALLEY, CA)
Small Quantity Generators, between 100 kg and 1000 kg of hazardous waste/month (Resource Conservation and Recovery Act (tracking hazardous waste)) - notification Organizations: WASTE MGT (CONTACT/OWNER)
HACKER WALL SYSTEMS (55666 A YUCCA TR in YUCCA VALLEY, CA)
CRITERIA AND HAZARDOUS AIR POLLUTANT INVENTORY (Inventory of air pollution sources) Business SIC classification: WOOD HOUSEHOLD FURNITURE, EXCEPT UPHOLSTERED
Housing units lacking complete plumbing facilities: 2.4% Housing units lacking complete kitchen facilities: 4.0%
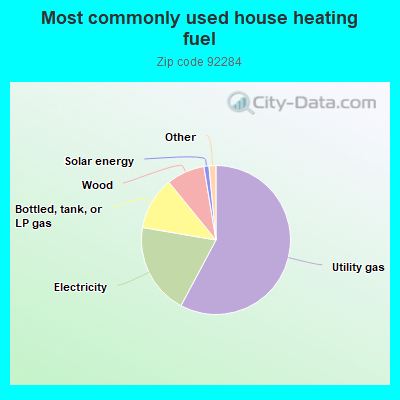
57.8%Utility gas
19.9%Electricity
11.4%Bottled, tank, or LP gas
8.3%Wood
1.1%Solar energy
0.9%No fuel used
0.6%Other fuel
Population in 1990: 22,131.
Place of birth for U.S.-born residents:
This state: 17,238
Northeast: 1,213
Midwest: 1,943
South: 1,484
West: 1,198
51% of the 92284 zip code residents lived in the same house 5 years ago. Out of people who lived in different houses, 60% lived in this county. Out of people who lived in different counties, 50% lived in California.
89% of the 92284 zip code residents lived in the same house 1 year ago. Out of people who lived in different houses, 43% moved from this county. Out of people who lived in different houses, 30% moved from different county within same state. Out of people who lived in different houses, 23% moved from different state. Out of people who lived in different houses, 4% moved from abroad.
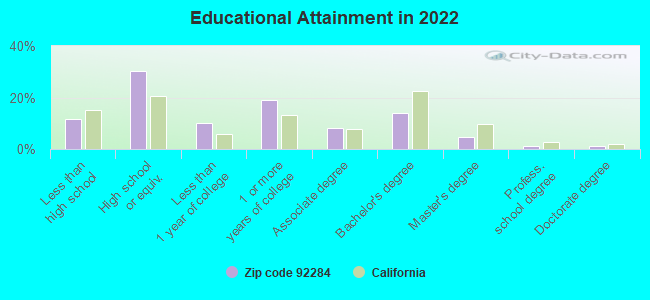
Private vs. public school enrollment:
Students in private schools in grades 1 to 8 (elementary and middle school): 440
Here:
15.9%
California:
10.5%
Students in private schools in grades 9 to 12 (high school): 269
Here:
18.5%
California:
8.5%
Students in private undergraduate colleges: 159
Here:
15.3%
California:
15.9%
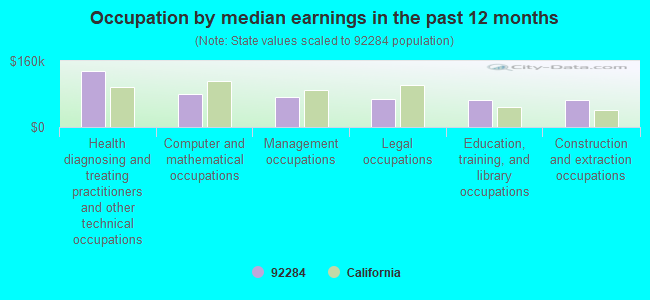
Occupation by median earnings in the past 12 months ($)
134,960Health diagnosing and treating practitioners and other technical occupations
80,335Computer and mathematical occupations
73,074Management occupations
67,645Legal occupations
66,451Education, training, and library occupations
66,262Construction and extraction occupations
Companies with biggest federal contracts located in this zip code (YUCCA VALLEY, CA):
NEWMAN ENTERPRISES INC (56435 BONANZA DRIVE; small business) : $331,221 in 16 contractsfrom 2003 to 2005
Contracts for Other Housekeeping Services by Navy Signed by year:2000: $0; 2001: $0; 2002: $0; 2003: $101,610; 2004: $65,939; 2005: $163,672; 2006: $0.
Biggest contracts:
$164,734 with Navy for Other Housekeeping Services. Signed on 2005-05-26. Completion date: 2005-05-27.
$80,580, same as above.Signed on 2003-05-13. Completion date: 2004-05-27.
$69,852, same as above.Signed on 2004-05-26. Completion date: 2004-05-27.
$13,910, same as above.Signed on 2003-01-24. Completion date: 2003-03-31.
JAMES A. SHIRLEY CONSTRUCTION (7565 VALLEY VISTA AVENUE; small business) : $234,380 in 4 contractsin 2000
$68,999 with Navy for Maintenance, Repair or Alteration of Real Property -- Water Supply Facilities. Signed on 2000-05-04. Completion date: 2000-08-13.
$65,273, same as above.Signed on 2000-02-24. Completion date: 2000-07-26.
$52,000, same as above.Signed on 2000-09-29. Completion date: 2000-08-13.
$48,108, same as above.Signed on 2000-08-18. Completion date: 2000-08-13.
FERRELLGAS INC (56976 29 PALMS HWY; small business) : $156,400 in 3 contractsfrom 1999 to 2001
$54,500 with Navy for Gases: Compressed and Liquefied. Signed on 2001-12-06. Completion date: 2002-11-30.
$54,500, same as above.Signed on 2000-11-08. Completion date: 2001-09-30.
$47,400, same as above.Signed on 1999-10-01. Completion date: 2000-09-30.
CARPET-N-THINGS YUCCA VALLEY (56546 29 PALMS HWY; small business)
$59,000 with Navy for Carpet Laying and Cleaning. Signed on 2000-07-18. Completion date: 2000-09-16.
JOHN P ZACCARIA (58945 BUSINESS CENTER DR S; small business) : $53,294 in 10 contractsfrom 2004 to 2005
Contracts for Lease or Rental of Equipment -- Office Machines, Text Processing Systems and Visible Record Equipment, Office Information System Equipment, Photographic Developing and Finishing Equipment by Navy Signed by year:2000: $0; 2001: $0; 2002: $0; 2003: $0; 2004: $10,208; 2005: $43,086; 2006: $0.
Biggest contracts:
$23,825 with Navy for Lease or Rental of Equipment -- Office Machines, Text Processing Systems and Visible Record Equipment. Signed on 2005-04-13. Completion date: 2005-04-14.
$15,757 with Navy for Office Information System Equipment. Signed on 2005-01-19. Completion date: 2004-12-31.
$8,303, same as above.Signed on 2004-10-20. Completion date: 2004-12-31.
$2,100 with Navy for Lease or Rental of Equipment -- Office Machines, Text Processing Systems and Visible Record Equipment. Signed on 2005-05-02. Completion date: 2005-04-14.
ROBERT & DIANNE HAYWARD ENTERP (2638 LONG VIEW RD; small business) : $49,800 in 2 contractsfrom 2004 to 2005
$27,000 with Army for Lectures For Training. Signed on 2004-09-09. Completion date: 2005-09-29.
$22,800 with Army for Communication Training Devices. Signed on 2005-12-02. Completion date: 2006-09-30.
VAGABOND WELDING SUPPLY (55870 YUCCA TRL; small business) : $40,065 in 5 contractsfrom 2003 to 2006
Contracts for Gases: Compressed and Liquefied by Navy Signed by year:2000: $0; 2001: $0; 2002: $0; 2003: $12,353; 2004: $12,933; 2005: $13,603; 2006: $1,176.
Biggest contracts:
$13,603 with Navy for Gases: Compressed and Liquefied. Signed on 2005-09-14. Completion date: 2004-09-30.
$12,933, same as above.Signed on 2004-06-03. Completion date: 2004-09-30.
$12,353, same as above.Signed on 2003-08-09. Completion date: 2004-09-30.
$1,176, same as above.Signed on 2006-02-14. Completion date: 2006-02-14.
ACE ALTERNATORS, GENERATORS & (7185 MOHAWK TRAIL)
$28,381 with Navy for Engine Electrical System Components, Nonaircraft. Signed on 2002-04-02. Completion date: 2002-04-02.
MOJAVE MECHANICAL (58945 BUSINESS CENTER DR; small business)
$18,720 with Navy for Maintenance, Repair or Alteration of Real Property -- Other Administrative Facilities and Service Buildings. Signed on 2001-04-24. Completion date: 2001-06-12.
AMY WILSON (56608 29 PALMS HWY; small business)
$7,317 with Army for Construction of Structures and Facilities -- Miscellaneous Buildings. Signed on 2005-09-23. Completion date: 2005-09-23.
Top industries in this zip code by the number of employees in 2005:
2005 - 2018 National Fire Incident Reporting System (NFIRS) incidents
Based on the data from the years 2005 - 2018 the average number of fires per year is 30. The highest number of fire incidents - 88 took place in 2018, and the least - 2 in 2011. The data has a growing trend.
When looking into fire subcategories, the most reports belonged to: Outside Fires (45.2%), and Structure Fires (29.8%).
Fire incident types reported to NFIRS in Zip Code 92284


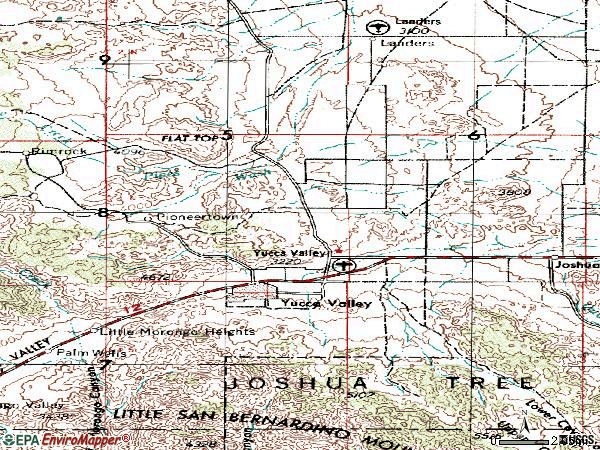
 Nearest zip codes: 92268, 92252, 92285, 92256, 92240, 92258.


 Based on the data from the years 2005 - 2018 the average number of fires per year is 30. The highest number of fire incidents - 88 took place in 2018, and the least - 2 in 2011. The data has a growing trend.
 When looking into fire subcategories, the most reports belonged to: Outside Fires (45.2%), and Structure Fires (29.8%).