Estimated zip code population in 2022: 38,244 Zip code population in 2010: 32,725 Zip code population in 2000: 18,973
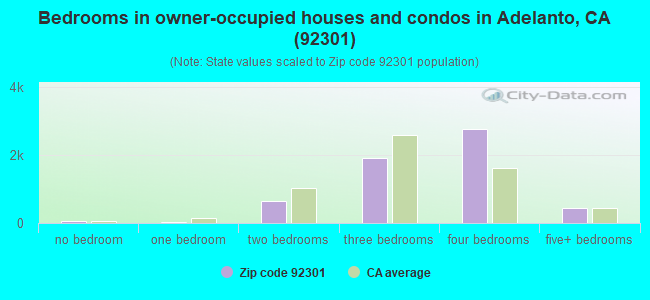
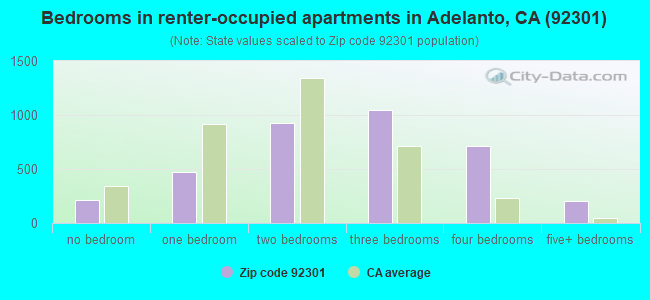
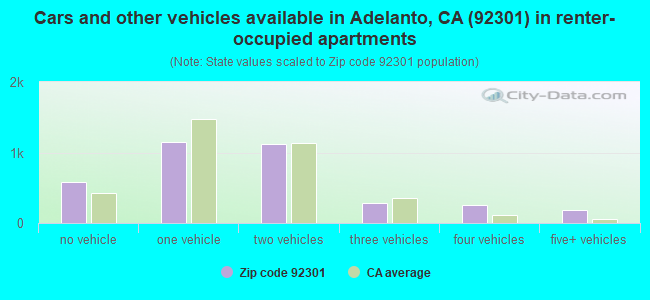
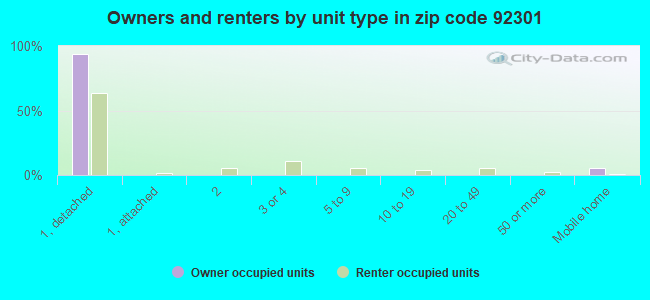
Houses and condos: 10,241 Renter-occupied apartments: 3,566
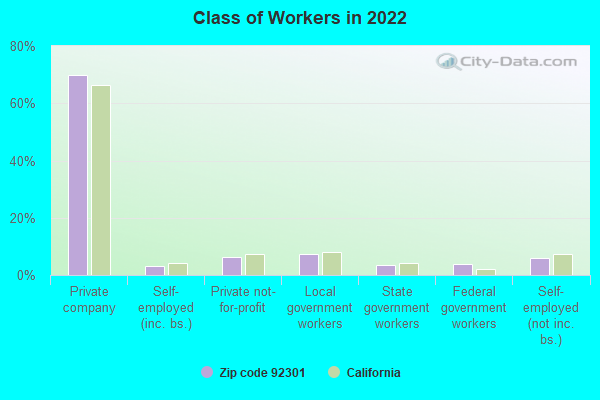
% of renters here:
38%
State:
44%
March 2022 cost of living index in zip code 92301: 81.1 (low, U.S. average is 100)
Land area: 170.5 sq. mi. Water area: 0.0 sq. mi.
Population density: 224 people per square mile
(very low).
OSM Map
General Map
Google Map
MSN Map
OSM Map
General Map
Google Map
MSN Map
OSM Map
General Map
Google Map
MSN Map
OSM Map
General Map
Google Map
MSN Map
Please wait while loading the map...
Real estate property taxes paid for housing units in 2022:
This zip code:
0.9% ($2,671)
California:
0.7% ($4,831)
Median real estate property taxes paid for housing units with mortgages in 2022: $2,741 (0.9%) Median real estate property taxes paid for housing units with no mortgage in 2022: $2,408 (0.8%)
Averages for the 2020 tax year for zip code 92301, filed in 2021:
Average Adjusted Gross Income (AGI) in 2020: $37,806 (Individual Income Tax Returns)
Here:
$37,806
State:
$95,910
Salary/wage: $37,183 (reported on 84.0% of returns)
Here:
$37,183
State:
$77,331
(% of AGI for various income ranges: 1060.4% for AGIs below $25k, 3527.1% for AGIs $25k-50k, 7298.4% for AGIs $50k-75k, 11475.2% for AGIs $75k-100k, 16636.6% for AGIs $100k-200k)
Taxable interest for individuals: $142 (reported on 18.7% of returns)
This zip code:
$142
California:
$2,294
(% of AGI for various income ranges: 2.4% for AGIs below $25k, 1.6% for AGIs $25k-50k, 4.8% for AGIs $50k-75k, 5.5% for AGIs $75k-100k, 18.8% for AGIs $100k-200k)
Ordinary dividends: $729 (reported on 1.9% of returns)
Here:
$729
State:
$10,949
(% of AGI for various income ranges: 0.4% for AGIs below $25k, 0.6% for AGIs $25k-50k, 1.4% for AGIs $50k-75k, 2.7% for AGIs $75k-100k, 30.0% for AGIs $100k-200k)
Net capital gain/loss in AGI: +$4,373 (reported on 3.0% of returns)
Here:
+$4,373
State:
+$49,306
(% of AGI for various income ranges: 0.5% for AGIs below $25k, 2.6% for AGIs $25k-50k, 9.5% for AGIs $50k-75k, 0.1% for AGIs $75k-100k, 400.0% for AGIs $100k-200k)
Profit/loss from business: +$7,557 (reported on 19.1% of returns)
Here:
+$7,557
State:
+$15,671
(% of AGI for various income ranges: 199.7% for AGIs below $25k, 172.6% for AGIs $25k-50k, 172.0% for AGIs $50k-75k, 63.1% for AGIs $75k-100k, 326.3% for AGIs $100k-200k)
Taxable individual retirement arrangement distribution: $11,312 (reported on 1.1% of returns)
92301:
$11,312
California:
$23,505
(% of AGI for various income ranges: 6.0% for AGIs below $25k, 6.8% for AGIs $25k-50k, 30.9% for AGIs $50k-75k, 109.1% for AGIs $75k-100k)
Total itemized deductions: $25,593 (reported on 6.0% of returns)
Here:
$25,593
State:
$39,517
(% of AGI for various income ranges: 22.1% for AGIs below $25k, 98.4% for AGIs $25k-50k, 422.9% for AGIs $50k-75k, 716.3% for AGIs $75k-100k, 1473.7% for AGIs $100k-200k)
Charity contributions: $6,115 (reported on 4.8% of returns)
Here:
$6,115
State:
$12,598
(% of AGI for various income ranges: 2.1% for AGIs below $25k, 13.8% for AGIs $25k-50k, 63.3% for AGIs $50k-75k, 134.9% for AGIs $75k-100k, 427.3% for AGIs $100k-200k)
Taxes paid: $7,470 (reported on 5.9% of returns)
92301:
$7,470
State:
$8,807
(% of AGI for various income ranges: 5.5% for AGIs below $25k, 25.6% for AGIs $25k-50k, 114.6% for AGIs $50k-75k, 242.5% for AGIs $75k-100k, 415.9% for AGIs $100k-200k)
Earned income credit: $2,816 (reported on 34.1% of returns)
Here:
$2,816
State:
$2,074
(% of AGI for various income ranges: 182.4% for AGIs below $25k, 128.8% for AGIs $25k-50k, 2.8% for AGIs $50k-75k)
Percentage of individuals using paid preparers for their 2020 taxes: 93.2%
Here:
93%
State:
92%
(% for various income ranges: 92.6% for AGIs below $25k, 94.0% for AGIs $25k-50k, 92.4% for AGIs $50k-75k, 93.0% for AGIs $75k-100k, 95.2% for AGIs $100k-200k, 100.0% for AGIs over 200k)
Averages for the 2012 tax year for zip code 92301, filed in 2013:
Average Adjusted Gross Income (AGI) in 2012: $29,943 (Individual Income Tax Returns)
Here:
$29,943
State:
$72,726
Salary/wage: $30,582 (reported on 81.6% of returns)
Here:
$30,582
State:
$59,079
(% of AGI for various income ranges: 67.6% for AGIs below $25k, 87.8% for AGIs $25k-50k, 89.1% for AGIs $50k-75k, 92.6% for AGIs $75k-100k, 102.9% for AGIs $100k-200k)
Taxable interest for individuals: $192 (reported on 17.2% of returns)
This zip code:
$192
California:
$2,146
(% of AGI for various income ranges: 0.2% for AGIs below $25k)
Ordinary dividends: $644 (reported on 2.6% of returns)
Here:
$644
State:
$9,308
(% of AGI for various income ranges: 0.2% for AGIs below $25k)
Net capital gain/loss in AGI: +$541 (reported on 2.1% of returns)
Here:
+$541
State:
+$30,460
(% of AGI for various income ranges: 0.4% for AGIs $100k-200k)
Profit/loss from business: +$9,523 (reported on 22.8% of returns)
Here:
+$9,523
State:
+$17,064
(% of AGI for various income ranges: 23.6% for AGIs below $25k, 3.1% for AGIs $25k-50k, 1.6% for AGIs $50k-75k, 0.4% for AGIs $75k-100k)
Taxable individual retirement arrangement distribution: $10,163 (reported on 1.8% of returns)
92301:
$10,163
California:
$19,557
(% of AGI for various income ranges: 0.4% for AGIs below $25k, 0.7% for AGIs $25k-50k, 0.7% for AGIs $50k-75k, 1.2% for AGIs $75k-100k)
Total itemized deductions: $18,699 (32% of AGI, reported on 21.6% of returns)
Here:
$18,699
State:
$34,004
Here:
32.5% of AGI
State:
22.7% of AGI
(% of AGI for various income ranges: 4.8% for AGIs below $25k, 13.2% for AGIs $25k-50k, 18.0% for AGIs $50k-75k, 19.0% for AGIs $75k-100k, 23.8% for AGIs $100k-200k)
Charity contributions: $2,513 (reported on 16.8% of returns)
Here:
$2,513
State:
$4,659
(% of AGI for various income ranges: 0.4% for AGIs below $25k, 1.3% for AGIs $25k-50k, 1.8% for AGIs $50k-75k, 2.3% for AGIs $75k-100k, 2.7% for AGIs $100k-200k)
Taxes paid: $4,406 (reported on 21.6% of returns)
92301:
$4,406
State:
$14,448
(% of AGI for various income ranges: 0.9% for AGIs below $25k, 2.6% for AGIs $25k-50k, 3.9% for AGIs $50k-75k, 5.0% for AGIs $75k-100k, 7.8% for AGIs $100k-200k)
Earned income credit: $3,141 (reported on 47.9% of returns)
Here:
$3,141
State:
$2,286
(% of AGI for various income ranges: 16.7% for AGIs below $25k, 2.6% for AGIs $25k-50k)
Percentage of individuals using paid preparers for their 2012 taxes: 64.4%
Here:
64%
State:
64%
(% for various income ranges: 59.8% for AGIs below $25k, 70.2% for AGIs $25k-50k, 72.7% for AGIs $50k-75k, 69.8% for AGIs $75k-100k, 69.6% for AGIs $100k-200k)
Averages for the 2004 tax year for zip code 92301, filed in 2005:
Average Adjusted Gross Income (AGI) in 2004: $30,847 (Individual Income Tax Returns)
Here:
$30,847
State:
$58,600
Salary/wage: $30,509 (reported on 91.2% of returns)
Here:
$30,509
State:
$49,455
(% of AGI for various income ranges: 98.3% for AGIs below $10k, 84.5% for AGIs $10k-25k, 92.8% for AGIs $25k-50k, 93.4% for AGIs $50k-75k, 90.2% for AGIs $75k-100k, 69.9% for AGIs over 100k)
Taxable interest for individuals: $345 (reported on 25.3% of returns)
This zip code:
$345
California:
$2,365
(% of AGI for various income ranges: 1.2% for AGIs below $10k, 0.5% for AGIs $10k-25k, 0.2% for AGIs $25k-50k, 0.3% for AGIs $50k-75k, 0.1% for AGIs $75k-100k, 0.4% for AGIs over 100k)
Taxable dividends: $455 (reported on 4.3% of returns)
Here:
$455
State:
$4,746
(% of AGI for various income ranges: 0.6% for AGIs below $10k, 0.1% for AGIs $10k-25k, 0.0% for AGIs $25k-50k, 0.0% for AGIs $50k-75k, 0.0% for AGIs $75k-100k, 0.0% for AGIs over 100k)
Net capital gain/loss: +$8,012 (reported on 3.4% of returns)
Here:
+$8,012
State:
+$23,418
(% of AGI for various income ranges: 0.0% for AGIs below $10k, 0.2% for AGIs $10k-25k, 0.1% for AGIs $25k-50k, 0.7% for AGIs $50k-75k, 0.9% for AGIs $75k-100k, 9.7% for AGIs over 100k)
Profit/loss from business: +$6,365 (reported on 13.0% of returns)
Here:
+$6,365
State:
+$16,826
(% of AGI for various income ranges: 10.3% for AGIs below $10k, 7.2% for AGIs $10k-25k, 1.6% for AGIs $25k-50k, 1.0% for AGIs $50k-75k, 2.0% for AGIs $75k-100k, 1.4% for AGIs over 100k)
IRA payment deduction: $1,926 (reported on 0.7% of returns)
92301:
$1,926
California:
$3,192
Total itemized deductions: $16,853 (33% of AGI, reported on 33.5% of returns)
Here:
$16,853
State:
$28,113
Here:
33.4% of AGI
State:
25.3% of AGI
(% of AGI for various income ranges: 9.2% for AGIs below $10k, 8.8% for AGIs $10k-25k, 19.6% for AGIs $25k-50k, 21.7% for AGIs $50k-75k, 21.8% for AGIs $75k-100k, 20.1% for AGIs over 100k)
Charity contributions deductions: $2,178 (4% of AGI, reported on 28.7% of returns)
Here:
$2,178
State:
$3,923
Here:
4.2% of AGI
State:
3.3% of AGI
(% of AGI for various income ranges: 0.7% for AGIs below $10k, 0.8% for AGIs $10k-25k, 1.8% for AGIs $25k-50k, 2.6% for AGIs $50k-75k, 2.7% for AGIs $75k-100k, 3.6% for AGIs over 100k)
Total tax: $2,764 (reported on 56.6% of returns)
92301:
$2,764
State:
$10,761
(% of AGI for various income ranges: 2.8% for AGIs below $10k, 2.8% for AGIs $10k-25k, 3.5% for AGIs $25k-50k, 5.8% for AGIs $50k-75k, 8.3% for AGIs $75k-100k, 13.2% for AGIs over 100k)
Earned income credit: $2,075 (reported on 33.1% of returns)
Here:
$2,075
State:
$1,763
Percentage of individuals using paid preparers for their 2004 taxes: 73.5%
Here:
74%
State:
66%
(% for various income ranges: 66.3% for AGIs below $10k, 75.5% for AGIs $10k-25k, 76.5% for AGIs $25k-50k, 73.6% for AGIs $50k-75k, 69.4% for AGIs $75k-100k, 79.6% for AGIs over 100k)
Likely homosexual households (counted as self-reported same-sex unmarried-partner households)
Lesbian couples: 0.1% of all households
Gay men: 0.0% of all households
Household received Food Stamps/SNAP in the past 12 months: 3,871 Household did not receive Food Stamps/SNAP in the past 12 months: 6,119
Women who had a birth in the past 12 months: 297 (155 now married, 143 unmarried) Women who did not have a birth in the past 12 months: 9,354 (3,457 now married, 5,907 unmarried)
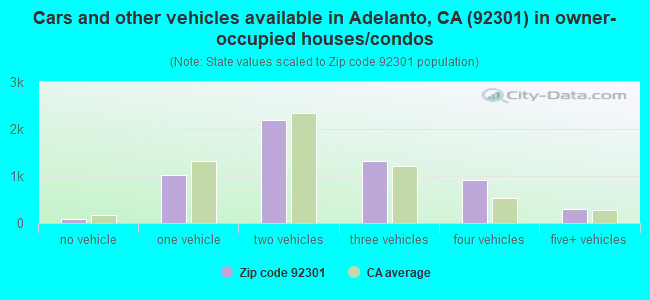
Housing units in zip code 92301 with a mortgage: 4,332 (157 second mortgage, 40 home equity loan, 86 both second mortgage and home equity loan) Median monthly owner costs for units with a mortgage: $1,496 Median monthly owner costs for units without a mortgage: $579
Residents with income below the poverty level in 2022:
This zip code:
18.2%
Whole state:
12.2%
Residents with income below 50% of the poverty level in 2022:
This zip code:
10.0%
Whole state:
6.2%
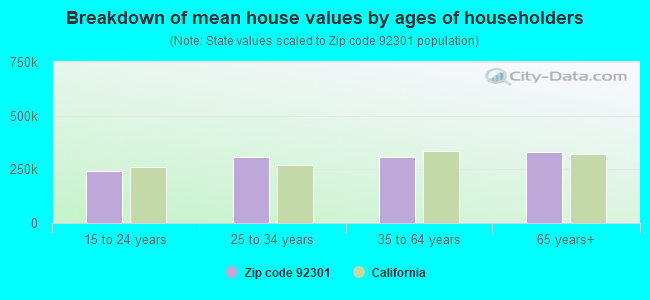
Median number of rooms in houses and condos:
Here:
6.3
State:
6.0
Median number of rooms in apartments:
Here:
5.0
State:
3.9
Notable locations in this zip code not listed on our city pages
Notable locations in zip code 92301: Martin Ranch (A), San Bernardino County Fire Department Station 11 El Mirage (B), San Bernardino County Fire Department Station 322 Adelanto (C), San Bernardino County Fire Department Station 321 Adelanto (D), Adelanto Correctional Facility (E), Adelanto Branch San Bernardino County Library (F). Display/hide their locations on the map
Parks in zip code 92301 include: Adelanto Park (1), Howard Loy Park (2), Maverick Baseball Stadium (3), Richardson Park (4), Sunrise Motorcycle Park (5), Westside Park (6). Display/hide their locations on the map
5,423 married couples with children.
4,163 single-parent households (1,516 men, 2,647 women).
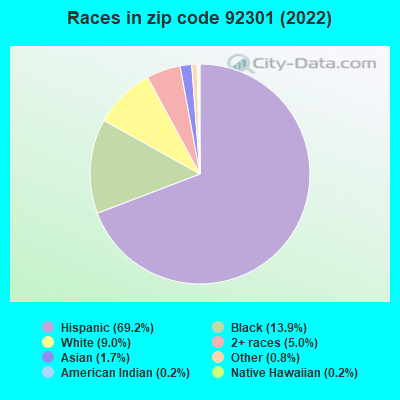
51.2% of residents of 92301 zip code speak English at home.
46.5% of residents speak Spanish at home (68% very well, 16% well, 11% not well, 5% not at all).
0.4% of residents speak other Indo-European language at home (73% very well, 16% well, 4% not well, 7% not at all).
0.9% of residents speak Asian or Pacific Island language at home (81% very well, 19% well).
0.3% of residents speak other language at home (60% very well, 40% well).
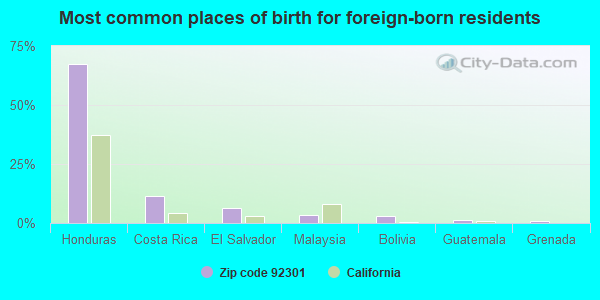
Foreign born population: 7,086 (18.5%) (50.4% of them are naturalized citizens)
This zip code:
18.5%
Whole state:
26.7%
67%Honduras
11%Costa Rica
6%El Salvador
4%Malaysia
3%Bolivia
1%Guatemala
1%Grenada
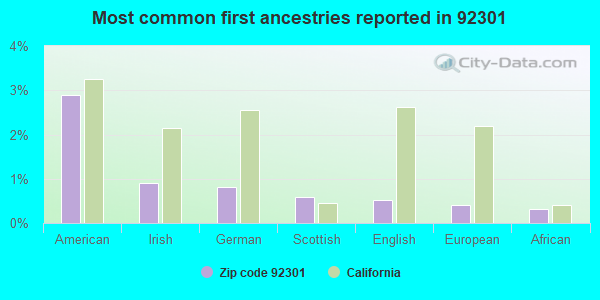
3%American
1%Irish
1%German
1%Scottish
1%English
0%European
0%African
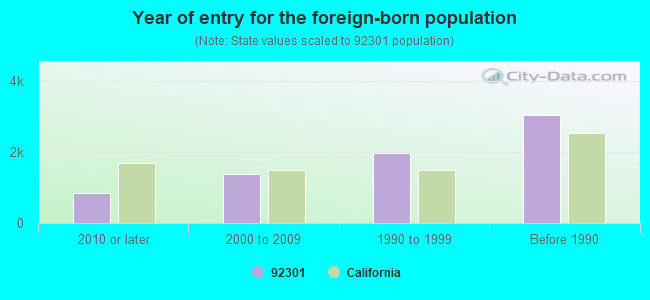
Year of entry for the foreign-born population
8472010 or later
1,3762000 to 2009
1,9661990 to 1999
3,044Before 1990
Major facilities with environmental interests located in this zip code:
GENERAL ATOMICS AERONAUTICAL SYSTEMS (73 EL MIRAGE AIRPORT ROAD SUITE B in ADELANTO, CA)
STATE MASTER (California - Hazardous Waste Tracking) - HAZARDOU WASTE PROGRAM Small Quantity Generators, between 100 kg and 1000 kg of hazardous waste/month (Resource Conservation and Recovery Act (tracking hazardous waste)) - notification Small Quantity Generators, between 100 kg and 1000 kg of hazardous waste/month (Resource Conservation and Recovery Act (tracking hazardous waste)) - notification Organizations: AERONAUTICAL HOLDING CORP (CONTACT/OWNER)
Alternative names: GENERAL ATOMICS AERO SYS
ENNIS PAINT (9925 YUCCA RD in ADELANTO, CA)
(Integrated Compliance Information System) - ICIS-09-2005-0274, ENFORCEMENT/COMPLIANCE ACTIVITY FORMAL ENFORCEMENT ACTION (Integrated Compliance Information System) - ICIS-09-2005-0274, ENFORCEMENT/COMPLIANCE ACTIVITY CRITERIA AND HAZARDOUS AIR POLLUTANT INVENTORY (Inventory of air pollution sources) TRI REPORTER (Tracking of toxic chemicals releasing facilities) Business SIC classification: PLASTICS MATERIALS, SYNTHETIC RESINS, AND NONVULCANIZABLE ELASTOMERS; PAINTS, VARNISHES, LACQUERS, ENAMELS, AND ALLIED PRODUCTS Alternative names: PAVE MARK CORP.
NORTHWEST PIPE COMPANY (12351 RANCHO RD. in ADELANTO, CA)
AIR MAJOR (AIRS/AFS) STATE MASTER (California - Hazardous Waste Tracking) - HAZARDOU WASTE PROGRAM CRITERIA AND HAZARDOUS AIR POLLUTANT INVENTORY (Inventory of air pollution sources) Small Quantity Generators, between 100 kg and 1000 kg of hazardous waste/month (Resource Conservation and Recovery Act (tracking hazardous waste)) - notification TRI REPORTER (Tracking of toxic chemicals releasing facilities) Business SIC classification: CONCRETE PRODUCTS, EXCEPT BLOCK AND BRICK; STEEL PIPE AND TUBES; FABRICATED PLATE WORK (BOILER SHOPS) Business NAICS classification: PLATE WORK MANUFACTURING. Organizations: FONTANA PIPE (CONTACT/OWNER)
Alternative names: NORTHWEST PIPE & CASING
MK MAGNETICS INCORPORATED (17030 MUSKRAT AVENUE in ADELANTO, CA)
STATE MASTER (California - Hazardous Waste Tracking) - HAZARDOU WASTE PROGRAM CRITERIA AND HAZARDOUS AIR POLLUTANT INVENTORY (Inventory of air pollution sources) Small Quantity Generators, between 100 kg and 1000 kg of hazardous waste/month (Resource Conservation and Recovery Act (tracking hazardous waste)) - notification TRI REPORTER (Tracking of toxic chemicals releasing facilities) Business SIC classification: COATING, ENGRAVING, AND ALLIED SERVICES; POWER, DISTRIBUTION, AND SPECIALTY TRANSFORMERS Business NAICS classification: OTHER ELECTRONIC COMPONENT MANUFACTURING. Alternative names: NATIONAL ARNOLD MAGNETICS
INDUCTION TECHNOLOGY CORP (9924 RANCHO RD in ADELANTO, CA)
STATE MASTER (California - Hazardous Waste Tracking) - HAZARDOU WASTE PROGRAM CRITERIA AND HAZARDOUS AIR POLLUTANT INVENTORY (Inventory of air pollution sources) Small Quantity Generators, between 100 kg and 1000 kg of hazardous waste/month (Resource Conservation and Recovery Act (tracking hazardous waste)) - notification Business SIC classification: COATING, ENGRAVING, AND ALLIED SERVICES Business NAICS classification: INDUSTRIAL PROCESS FURNACE AND OVEN MANUFACTURING. Organizations: MICHAEL T DICKEN (CONTACT/OWNER)
LA SUPPLY LABEL HOUSE (9331 COMMERCE WAY in ADELANTO, CA)
STATE MASTER (California - Hazardous Waste Tracking) - HAZARDOU WASTE PROGRAM CRITERIA AND HAZARDOUS AIR POLLUTANT INVENTORY (Inventory of air pollution sources) Small Quantity Generators, between 100 kg and 1000 kg of hazardous waste/month (Resource Conservation and Recovery Act (tracking hazardous waste)) - notification Business SIC classification: COMMERCIAL PRINTING Organizations: NICK BURNIIP (CONTACT/OWNER)
ADELANTO ELEMENTARY SCHOOL (17931 JONATHAN ST in ADELANTO, CA)
(Geographic Names Information System) (National Center for Education Statistics) - STATE ID-6035174
FIBER CARE BATHS INC (9832 YUCCA RD in ADELANTO, CA)
STATE MASTER (California - Hazardous Waste Tracking) - HAZARDOU WASTE PROGRAM Small Quantity Generators, between 100 kg and 1000 kg of hazardous waste/month (Resource Conservation and Recovery Act (tracking hazardous waste)) - notification Organizations: STEVE HESS (CONTACT/OWNER)
FIRST LOGISTEX INC (11930 AZTEC LN in ADELANTO, CA)
STATE MASTER (California - Hazardous Waste Tracking) - HAZARDOU WASTE PROGRAM TRANSPORTER (Resource Conservation and Recovery Act (tracking hazardous waste)) - notification Organizations: JASON BLAIR (CONTACT/OWNER)
MOCKETT ENTERPRISES (18000 MUSKRAT AVE in ADELANTO, CA)
STATE MASTER (California - Hazardous Waste Tracking) - HAZARDOU WASTE PROGRAM TRANSPORTER (Resource Conservation and Recovery Act (tracking hazardous waste)) - notification Organizations: WILLIAM MOCKETT (CONTACT/OWNER)
AMKO SERVICE COMPANY (17909 ADELANTO ROAD in ADELANTO, CA)
CRITERIA AND HAZARDOUS AIR POLLUTANT INVENTORY (Inventory of air pollution sources) Large Quantity Generators, more that 1000 kg of hazardous waste/month (Resource Conservation and Recovery Act (tracking hazardous waste)) Business SIC classification: TERMINAL AND JOINT TERMINAL MAINTENANCE FACILITIES FOR MOTOR FREIGHT TRANSPORTATION Organizations: JACK B KELLEY (CONTACT/OWNER)
Alternative names: IRON HORSE EQUIP
ADELANTO ALUMINUM COMPANY INCORPORATED (10774 PRIMROSE RD in ADELANTO, CA)
HAZARDOUS WASTE BIENNIAL REPORTER (Resource Conservation and Recovery Act (tracking hazardous waste)) Large Quantity Generators, more that 1000 kg of hazardous waste/month (Resource Conservation and Recovery Act (tracking hazardous waste)) - notification Organizations: ADELANTO ALUMINUM CO INC (CONTACT/OWNER)
ALRAYCO, LLC (10774 PRIMROSE RD in ADELANTO, CA)
AIR MINOR (AIRS/AFS) CRITERIA AND HAZARDOUS AIR POLLUTANT INVENTORY (Inventory of air pollution sources) Business SIC classification: PRIMARY PRODUCTION OF ALUMINUM; ALUMINUM FOUNDRIES
Housing units lacking complete plumbing facilities: 1.7% Housing units lacking complete kitchen facilities: 3.5%
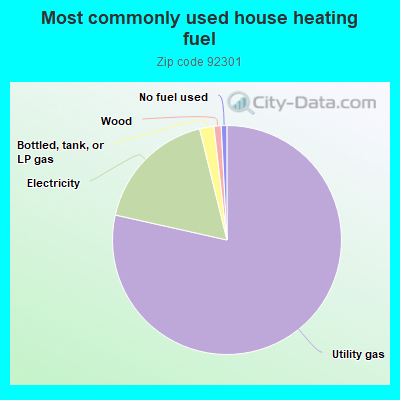
77.8%Utility gas
17.5%Electricity
2.0%Bottled, tank, or LP gas
1.0%Wood
0.8%No fuel used
Population in 1990: 7,176. Population change in the 1990s: +11,797 (+164.4%).
Place of birth for U.S.-born residents:
This state: 27,883
Northeast: 480
Midwest: 409
South: 1,489
West: 678
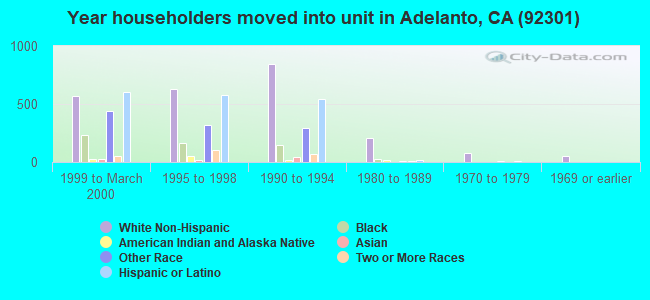
50% of the 92301 zip code residents lived in the same house 5 years ago. Out of people who lived in different houses, 63% lived in this county. Out of people who lived in different counties, 50% lived in California.
88% of the 92301 zip code residents lived in the same house 1 year ago. Out of people who lived in different houses, 58% moved from this county. Out of people who lived in different houses, 31% moved from different county within same state. Out of people who lived in different houses, 9% moved from different state. Out of people who lived in different houses, 1% moved from abroad.
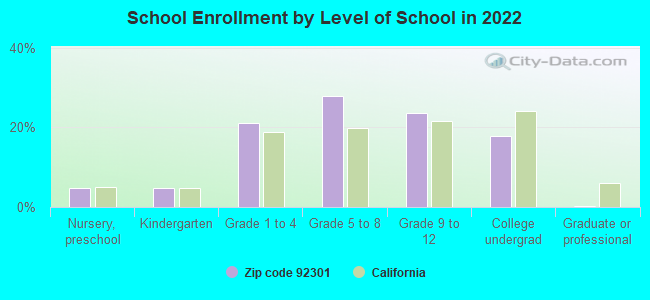
Private vs. public school enrollment:
Students in private schools in grades 1 to 8 (elementary and middle school): 517
Here:
8.5%
California:
10.5%
Students in private schools in grades 9 to 12 (high school): 138
Here:
4.7%
California:
8.5%
Students in private undergraduate colleges: 410
Here:
18.5%
California:
15.9%
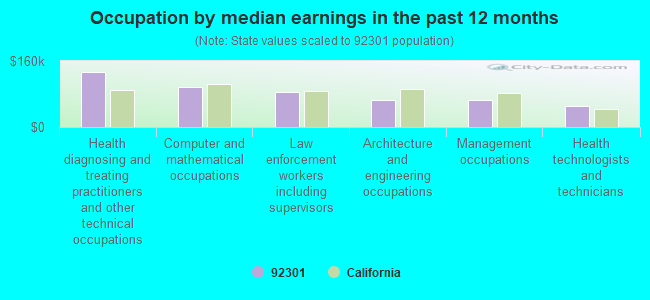
Occupation by median earnings in the past 12 months ($)
133,298Health diagnosing and treating practitioners and other technical occupations
97,275Computer and mathematical occupations
84,191Law enforcement workers including supervisors
65,022Architecture and engineering occupations
64,608Management occupations
51,951Health technologists and technicians
Companies with federal contracts located in this zip code (ADELANTO, CA):
EXQUADRUM, INC (12130 RANCHO RD; small business) : $3,449,773 in 13 contractsfrom 2003 to 2005
Contracts for Other Defense -- Operational Systems Development (R&D), Defense Missile and Space Systems -- Basic Research (R&D), Defense Aircraft -- Basic Research (R&D), Other Defense -- Advanced Development (R&D), and moreby Air Force, Defense Advanced Research Projects Agency, Missile Defense Agency, NASA, and others Signed by year:2000: $0; 2001: $0; 2002: $0; 2003: $808,964; 2004: $844,421; 2005: $1,796,388; 2006: $0.
Biggest contracts:
$749,988 with Air Force for Other Defense -- Operational Systems Development (R&D). Signed on 2005-09-21. Completion date: 2007-09-29.
$746,446 with Air Force for Defense Missile and Space Systems -- Basic Research (R&D). Signed on 2005-01-27. Completion date: 2007-04-27.
$550,000 with Air Force for Defense Aircraft -- Basic Research (R&D). Signed on 2004-08-12. Completion date: 2006-11-16.
$539,675 with Defense Advanced Research Projects Agency for Other Defense -- Advanced Development (R&D). Signed on 2003-11-13. Completion date: 2004-05-12.
AGENTAI INC (12130 RANCHO RD; small business) : $1,519,548 in 7 contractsfrom 2002 to 2005
Contracts for Other Defense -- Basic Research (R&D), Services -- Advanced Development (R&D), Other Defense -- Applied Research and Exploratory Development (R&D), Ammunition -- Basic Research (R&D) by Department of Defense, Navy Signed by year:2000: $0; 2001: $0; 2002: $169,703; 2003: $0; 2004: $1,132,704; 2005: $217,141; 2006: $0.
Biggest contracts:
$375,000 with Department of Defense for Other Defense -- Basic Research (R&D). Signed on 2004-11-19. Completion date: 2006-03-31.
$300,000 with Navy for Services -- Advanced Development (R&D). Signed on 2004-01-20. Completion date: 2006-01-19.
$299,892, same as above.Signed on 2004-09-14. Completion date: 2006-01-25.
$217,141 with Department of Defense for Other Defense -- Basic Research (R&D). Signed on 2005-04-07. Completion date: 2006-03-31.
SPEDE TOOL MFG CO (10042 RANCHO RD; small business) : $120,946 in 5 contractsfrom 2002 to 2006
Contracts for Machine Tool Accessories by Defense Logistics Agency Signed by year:2000: $0; 2001: $0; 2002: $105,691; 2003: $0; 2004: $0; 2005: $8,280; 2006: $6,975.
Biggest contracts:
$76,260 with Defense Logistics Agency for Machine Tool Accessories. Signed on 2002-09-30. Completion date: 2002-10-30.
$29,431, same as above.Signed on 2002-01-09. Completion date: 2002-02-08.
$8,280, same as above.Signed on 2005-04-12. Completion date: 2005-05-13.
$4,065, same as above.Signed on 2006-05-16. Completion date: 2006-06-16.
RAINBOW FIBERGLASS INC (9444 CASSIA RD; small business) : $68,260 in 3 contractsfrom 2002 to 2003
$37,905 with Army for Combat, Assault, and Tactical Vehicles, Tracked. Signed on 2003-09-12. Completion date: 2003-12-15.
$34,825, same as above.Signed on 2002-07-26. Completion date: 2002-07-29.
-$4,470, same as above.Signed on 2003-09-12. Completion date: 2003-12-15.
SAFEWAY SIGN COMPANY (9875 YUCCA RD; small business)
$5,577 with Air Force for Signs, Advertising Displays, and Identification Plates. Signed on 2006-03-14. Completion date: 2006-04-14.
Top industries in this zip code by the number of employees in 2005:
Administrative and Support and Waste Management and Remediation Services: Security Guards and Patrol Services (100-249 employees: 1 establishment)
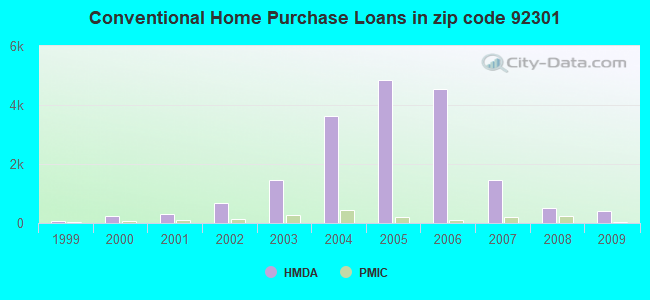
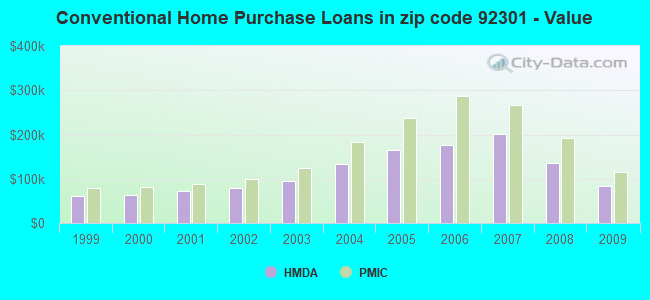
Detailed PMIC statistics for the following Tracts:0091.04
2005 - 2018 National Fire Incident Reporting System (NFIRS) incidents
According to the data from the years 2005 - 2018 the average number of fires per year is 38. The highest number of reported fire incidents - 141 took place in 2008, and the least - 0 in 2012. The data has a growing trend.
When looking into fire subcategories, the most reports belonged to: Structure Fires (38.5%), and Outside Fires (38.5%).
Fire incident types reported to NFIRS in Zip Code 92301


 Nearest zip codes: 92394, 92392, 92368, 92371, 92395, 92344.


 According to the data from the years 2005 - 2018 the average number of fires per year is 38. The highest number of reported fire incidents - 141 took place in 2008, and the least - 0 in 2012. The data has a growing trend.
 When looking into fire subcategories, the most reports belonged to: Structure Fires (38.5%), and Outside Fires (38.5%).