Estimated zip code population in 2022: 39,607 Zip code population in 2010: 33,237 Zip code population in 2000: 12,073
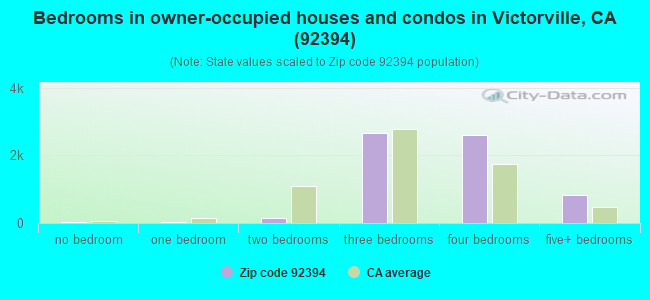
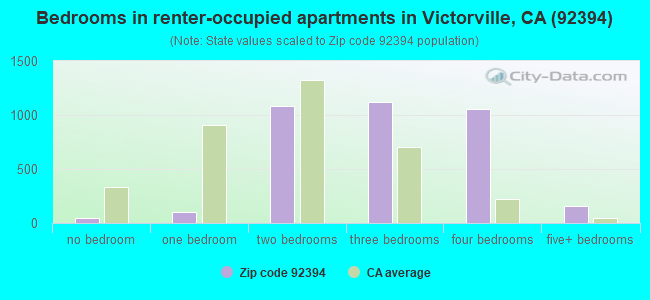
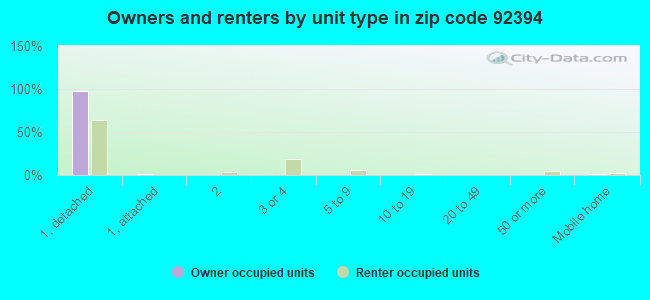
Houses and condos: 10,111 Renter-occupied apartments: 3,545
% of renters here:
36%
State:
44%
March 2022 cost of living index in zip code 92394: 81.1 (low, U.S. average is 100)
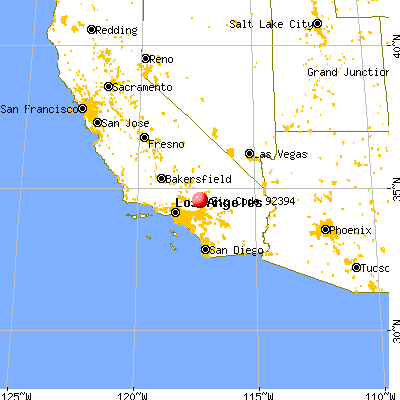
Land area: 27.3 sq. mi. Water area: 0.2 sq. mi.
Population density: 1,452 people per square mile
(low).
OSM Map
General Map
Google Map
MSN Map
OSM Map
General Map
Google Map
MSN Map
OSM Map
General Map
Google Map
MSN Map
OSM Map
General Map
Google Map
MSN Map
Please wait while loading the map...
Real estate property taxes paid for housing units in 2022:
This zip code:
0.8% ($2,761)
California:
0.7% ($4,831)
Median real estate property taxes paid for housing units with mortgages in 2022: $2,890 (0.8%) Median real estate property taxes paid for housing units with no mortgage in 2022: $2,103 (0.8%)
Averages for the 2020 tax year for zip code 92394, filed in 2021:
Average Adjusted Gross Income (AGI) in 2020: $43,125 (Individual Income Tax Returns)
Here:
$43,125
State:
$95,910
Salary/wage: $41,911 (reported on 84.6% of returns)
Here:
$41,911
State:
$77,331
(% of AGI for various income ranges: 1100.7% for AGIs below $25k, 3553.7% for AGIs $25k-50k, 7193.7% for AGIs $50k-75k, 10888.2% for AGIs $75k-100k, 18755.4% for AGIs $100k-200k, 81485.0% for AGIs over 200k)
Taxable interest for individuals: $211 (reported on 22.9% of returns)
This zip code:
$211
California:
$2,294
(% of AGI for various income ranges: 2.4% for AGIs below $25k, 3.0% for AGIs $25k-50k, 8.1% for AGIs $50k-75k, 9.3% for AGIs $75k-100k, 38.5% for AGIs $100k-200k, 165.0% for AGIs over 200k)
Ordinary dividends: $869 (reported on 3.3% of returns)
Here:
$869
State:
$10,949
(% of AGI for various income ranges: 0.5% for AGIs below $25k, 2.5% for AGIs $25k-50k, 9.1% for AGIs $50k-75k, 2.4% for AGIs $75k-100k, 23.0% for AGIs $100k-200k)
Net capital gain/loss in AGI: +$3,373 (reported on 4.1% of returns)
Here:
+$3,373
State:
+$49,306
(% of AGI for various income ranges: 1.0% for AGIs below $25k, 3.7% for AGIs $25k-50k, 10.2% for AGIs $50k-75k, 40.0% for AGIs $75k-100k, 205.8% for AGIs $100k-200k)
Profit/loss from business: +$6,596 (reported on 18.8% of returns)
Here:
+$6,596
State:
+$15,671
(% of AGI for various income ranges: 162.9% for AGIs below $25k, 151.5% for AGIs $25k-50k, 156.0% for AGIs $50k-75k, 202.8% for AGIs $75k-100k, 171.6% for AGIs $100k-200k)
Taxable individual retirement arrangement distribution: $12,132 (reported on 1.8% of returns)
92394:
$12,132
California:
$23,505
(% of AGI for various income ranges: 10.5% for AGIs below $25k, 13.5% for AGIs $25k-50k, 57.1% for AGIs $50k-75k, 58.8% for AGIs $75k-100k, 136.1% for AGIs $100k-200k)
Total itemized deductions: $26,360 (reported on 8.5% of returns)
Here:
$26,360
State:
$39,517
(% of AGI for various income ranges: 29.7% for AGIs below $25k, 139.1% for AGIs $25k-50k, 524.8% for AGIs $50k-75k, 793.8% for AGIs $75k-100k, 1548.1% for AGIs $100k-200k, 7460.0% for AGIs over 200k)
Charity contributions: $6,226 (reported on 6.8% of returns)
Here:
$6,226
State:
$12,598
(% of AGI for various income ranges: 2.0% for AGIs below $25k, 19.1% for AGIs $25k-50k, 81.2% for AGIs $50k-75k, 148.1% for AGIs $75k-100k, 379.7% for AGIs $100k-200k, 2260.0% for AGIs over 200k)
Taxes paid: $7,745 (reported on 8.5% of returns)
92394:
$7,745
State:
$8,807
(% of AGI for various income ranges: 6.8% for AGIs below $25k, 33.8% for AGIs $25k-50k, 159.4% for AGIs $50k-75k, 253.6% for AGIs $75k-100k, 483.0% for AGIs $100k-200k, 1655.0% for AGIs over 200k)
Earned income credit: $2,708 (reported on 29.9% of returns)
Here:
$2,708
State:
$2,074
(% of AGI for various income ranges: 159.9% for AGIs below $25k, 125.8% for AGIs $25k-50k, 2.7% for AGIs $50k-75k)
Percentage of individuals using paid preparers for their 2020 taxes: 93.7%
Here:
94%
State:
92%
(% for various income ranges: 92.8% for AGIs below $25k, 94.7% for AGIs $25k-50k, 93.9% for AGIs $50k-75k, 93.1% for AGIs $75k-100k, 93.9% for AGIs $100k-200k, 100.0% for AGIs over 200k)
Averages for the 2012 tax year for zip code 92394, filed in 2013:
Average Adjusted Gross Income (AGI) in 2012: $36,726 (Individual Income Tax Returns)
Here:
$36,726
State:
$72,726
Salary/wage: $36,474 (reported on 83.9% of returns)
Here:
$36,474
State:
$59,079
(% of AGI for various income ranges: 70.0% for AGIs below $25k, 84.7% for AGIs $25k-50k, 88.5% for AGIs $50k-75k, 87.5% for AGIs $75k-100k, 87.7% for AGIs $100k-200k, 58.9% for AGIs over 200k)
Taxable interest for individuals: $214 (reported on 23.5% of returns)
This zip code:
$214
California:
$2,146
(% of AGI for various income ranges: 0.2% for AGIs below $25k, 0.1% for AGIs $25k-50k, 0.1% for AGIs $50k-75k, 0.2% for AGIs $75k-100k, 0.5% for AGIs over 200k)
Ordinary dividends: $812 (reported on 3.8% of returns)
Here:
$812
State:
$9,308
(% of AGI for various income ranges: 0.2% for AGIs below $25k, 0.1% for AGIs $50k-75k)
Net capital gain/loss in AGI: +$830 (reported on 2.4% of returns)
Here:
+$830
State:
+$30,460
(% of AGI for various income ranges: 0.4% for AGIs $75k-100k)
Profit/loss from business: +$8,226 (reported on 20.4% of returns)
Here:
+$8,226
State:
+$17,064
(% of AGI for various income ranges: 19.8% for AGIs below $25k, 2.8% for AGIs $25k-50k, 0.6% for AGIs $50k-75k, 0.4% for AGIs $75k-100k, 1.1% for AGIs $100k-200k)
Taxable individual retirement arrangement distribution: $12,117 (reported on 2.6% of returns)
92394:
$12,117
California:
$19,557
(% of AGI for various income ranges: 0.6% for AGIs below $25k, 0.7% for AGIs $25k-50k, 0.9% for AGIs $50k-75k, 0.8% for AGIs $75k-100k, 1.4% for AGIs $100k-200k)
Total itemized deductions: $20,212 (31% of AGI, reported on 29.3% of returns)
Here:
$20,212
State:
$34,004
Here:
30.6% of AGI
State:
22.7% of AGI
(% of AGI for various income ranges: 6.7% for AGIs below $25k, 14.5% for AGIs $25k-50k, 19.1% for AGIs $50k-75k, 19.9% for AGIs $75k-100k, 19.9% for AGIs $100k-200k, 22.7% for AGIs over 200k)
Charity contributions: $2,814 (reported on 23.1% of returns)
Here:
$2,814
State:
$4,659
(% of AGI for various income ranges: 0.5% for AGIs below $25k, 1.4% for AGIs $25k-50k, 1.9% for AGIs $50k-75k, 2.5% for AGIs $75k-100k, 2.7% for AGIs $100k-200k, 2.1% for AGIs over 200k)
Taxes paid: $5,273 (reported on 29.2% of returns)
92394:
$5,273
State:
$14,448
(% of AGI for various income ranges: 1.1% for AGIs below $25k, 3.0% for AGIs $25k-50k, 4.8% for AGIs $50k-75k, 5.8% for AGIs $75k-100k, 6.4% for AGIs $100k-200k, 7.6% for AGIs over 200k)
Earned income credit: $2,965 (reported on 40.3% of returns)
Here:
$2,965
State:
$2,286
(% of AGI for various income ranges: 15.3% for AGIs below $25k, 2.3% for AGIs $25k-50k)
Percentage of individuals using paid preparers for their 2012 taxes: 63.5%
Here:
63%
State:
64%
(% for various income ranges: 58.5% for AGIs below $25k, 67.2% for AGIs $25k-50k, 70.2% for AGIs $50k-75k, 67.1% for AGIs $75k-100k, 68.5% for AGIs $100k-200k, 100.0% for AGIs over 200k)
Averages for the 2004 tax year for zip code 92394, filed in 2005:
Average Adjusted Gross Income (AGI) in 2004: $36,964 (Individual Income Tax Returns)
Here:
$36,964
State:
$58,600
Salary/wage: $35,765 (reported on 89.6% of returns)
Here:
$35,765
State:
$49,455
(% of AGI for various income ranges: 109.4% for AGIs below $10k, 80.8% for AGIs $10k-25k, 86.5% for AGIs $25k-50k, 91.3% for AGIs $50k-75k, 90.0% for AGIs $75k-100k, 75.5% for AGIs over 100k)
Taxable interest for individuals: $356 (reported on 33.0% of returns)
This zip code:
$356
California:
$2,365
(% of AGI for various income ranges: 1.4% for AGIs below $10k, 0.5% for AGIs $10k-25k, 0.4% for AGIs $25k-50k, 0.2% for AGIs $50k-75k, 0.3% for AGIs $75k-100k, 0.2% for AGIs over 100k)
Taxable dividends: $608 (reported on 6.7% of returns)
Here:
$608
State:
$4,746
(% of AGI for various income ranges: 0.6% for AGIs below $10k, 0.1% for AGIs $10k-25k, 0.1% for AGIs $25k-50k, 0.0% for AGIs $50k-75k, 0.0% for AGIs $75k-100k, 0.2% for AGIs over 100k)
Net capital gain/loss: +$8,213 (reported on 6.6% of returns)
Here:
+$8,213
State:
+$23,418
(% of AGI for various income ranges: -0.4% for AGIs below $10k, -0.1% for AGIs $10k-25k, 0.4% for AGIs $25k-50k, 0.9% for AGIs $50k-75k, 0.9% for AGIs $75k-100k, 7.1% for AGIs over 100k)
Profit/loss from business: +$5,864 (reported on 14.7% of returns)
Here:
+$5,864
State:
+$16,826
(% of AGI for various income ranges: 13.0% for AGIs below $10k, 8.0% for AGIs $10k-25k, 2.5% for AGIs $25k-50k, 0.7% for AGIs $50k-75k, 1.5% for AGIs $75k-100k, -0.2% for AGIs over 100k)
IRA payment deduction: $2,448 (reported on 1.2% of returns)
92394:
$2,448
California:
$3,192
Total itemized deductions: $19,691 (34% of AGI, reported on 43.1% of returns)
Here:
$19,691
State:
$28,113
Here:
34.0% of AGI
State:
25.3% of AGI
(% of AGI for various income ranges: 16.3% for AGIs below $10k, 11.9% for AGIs $10k-25k, 24.0% for AGIs $25k-50k, 26.5% for AGIs $50k-75k, 24.5% for AGIs $75k-100k, 22.2% for AGIs over 100k)
Charity contributions deductions: $2,472 (4% of AGI, reported on 37.0% of returns)
Here:
$2,472
State:
$3,923
Here:
4.1% of AGI
State:
3.3% of AGI
(% of AGI for various income ranges: 1.0% for AGIs below $10k, 0.9% for AGIs $10k-25k, 2.3% for AGIs $25k-50k, 2.9% for AGIs $50k-75k, 3.1% for AGIs $75k-100k, 2.8% for AGIs over 100k)
Total tax: $3,591 (reported on 64.9% of returns)
92394:
$3,591
State:
$10,761
(% of AGI for various income ranges: 3.7% for AGIs below $10k, 3.3% for AGIs $10k-25k, 4.4% for AGIs $25k-50k, 5.6% for AGIs $50k-75k, 8.1% for AGIs $75k-100k, 12.5% for AGIs over 100k)
Earned income credit: $2,043 (reported on 26.7% of returns)
Here:
$2,043
State:
$1,763
Percentage of individuals using paid preparers for their 2004 taxes: 72.4%
Here:
72%
State:
66%
(% for various income ranges: 67.3% for AGIs below $10k, 71.7% for AGIs $10k-25k, 75.1% for AGIs $25k-50k, 73.8% for AGIs $50k-75k, 72.7% for AGIs $75k-100k, 73.2% for AGIs over 100k)
Household received Food Stamps/SNAP in the past 12 months: 2,697 Household did not receive Food Stamps/SNAP in the past 12 months: 7,437
Women who had a birth in the past 12 months: 626 (399 now married, 227 unmarried) Women who did not have a birth in the past 12 months: 8,447 (3,330 now married, 5,117 unmarried)
Housing units in zip code 92394 with a mortgage: 4,808 (141 second mortgage, 114 both second mortgage and home equity loan) Houses without a mortgage: 137
Median monthly owner costs for units with a mortgage: $1,806 Median monthly owner costs for units without a mortgage: $543
Residents with income below the poverty level in 2022:
This zip code:
18.1%
Whole state:
12.2%
Residents with income below 50% of the poverty level in 2022:
This zip code:
6.0%
Whole state:
6.2%
Median number of rooms in houses and condos:
Here:
6.7
State:
6.0
Median number of rooms in apartments:
Here:
5.7
State:
3.9
Notable locations in this zip code not listed on our city pages
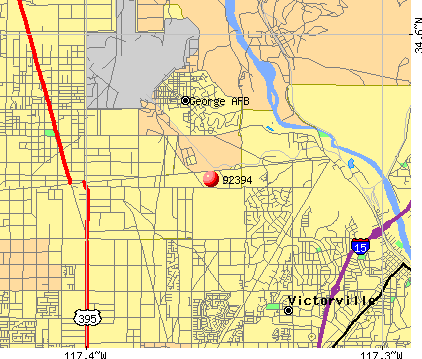
Notable locations in zip code 92394: West Wind Golf Course (A), Victor Valley Country Club (B), San Bernardino County Fire Department Station 319 Southern California Logistics Airport (C), San Bernardino County Fire Department Station 312 - Victorville (D), Roy Rogers-Dale Evans Museum (E). Display/hide their locations on the map
5,618 married couples with children.
2,694 single-parent households (697 men, 1,997 women).
60.6% of residents of 92394 zip code speak English at home.
35.2% of residents speak Spanish at home (65% very well, 16% well, 15% not well, 4% not at all).
1.0% of residents speak other Indo-European language at home (93% very well, 4% well, 2% not well).
2.1% of residents speak Asian or Pacific Island language at home (47% very well, 35% well, 15% not well, 3% not at all).
0.7% of residents speak other language at home (85% very well, 13% well, 2% not well).
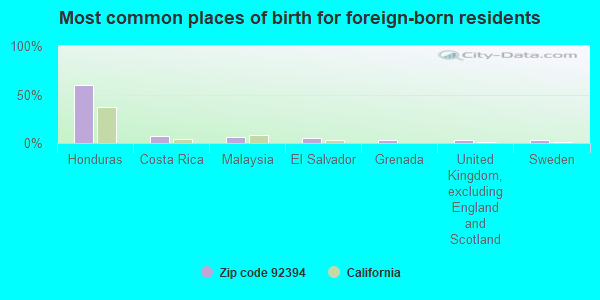
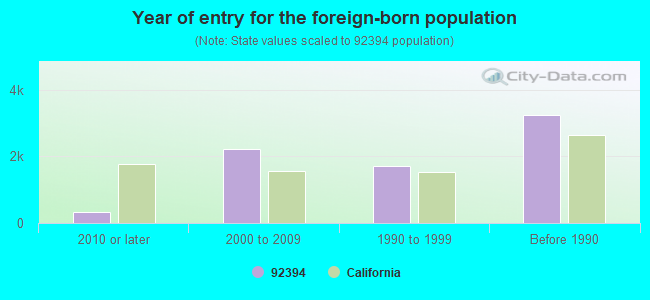
Foreign born population: 7,270 (18.4%) (51.9% of them are naturalized citizens)
This zip code:
18.4%
Whole state:
26.7%
60%Honduras
8%Costa Rica
6%Malaysia
5%El Salvador
3%Grenada
3%United Kingdom, excluding England and Scotland
3%Sweden
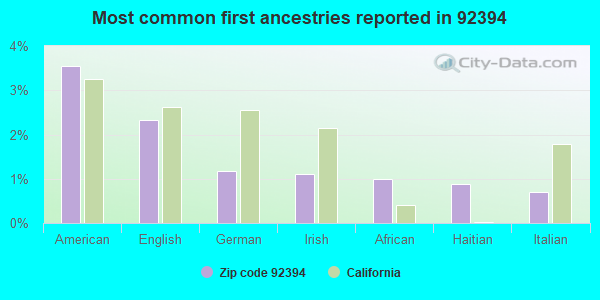
4%American
2%English
1%German
1%Irish
1%African
1%Haitian
1%Italian
Year of entry for the foreign-born population
3412010 or later
2,2162000 to 2009
1,6981990 to 1999
3,240Before 1990
Facilities with environmental interests located in this zip code:
HIGH DESERT POWER PROJECT LLC (19000 PERIMETER ROAD in VICTORVILLE, CA)
AIR MAJOR (AIRS/AFS) AIR PROGRAM (Clean Air Markets Division Business System) STATE MASTER (California - Hazardous Waste Tracking) - HAZARDOU WASTE PROGRAM ENFORCEMENT/COMPLIANCE ACTIVITY (Integrated Compliance Information System) Large Quantity Generators, more that 1000 kg of hazardous waste/month (Resource Conservation and Recovery Act (tracking hazardous waste)) Business SIC classification: ELECTRIC SERVICES Organizations: HIGH DESERT POWER PROJECT, LLC (CONTACT/OPERATOR)
Alternative names: HIGH DESERT POWER PLANT
GENERAL ELECTRIC FLIGHT TEST OPERATION (18000 PHANTOM WEST DRIVE in VICTORVILLE, CA)
STATE MASTER (California - Hazardous Waste Tracking) - HAZARDOU WASTE PROGRAM Small Quantity Generators, between 100 kg and 1000 kg of hazardous waste/month (Resource Conservation and Recovery Act (tracking hazardous waste)) Organizations: GENERAL ELECTRIC CO (CONTACT/OWNER)
Alternative names: GENERAL ELECTRIC COMPANY
GEORGE (HAROLD H.) VISUAL & PERF. ARTS(ELEM) (17738 NEVADA AVE. in VICTORVILLE, CA)
(National Center for Education Statistics) - STATE ID-6035182 Organizations: ADELANTO ELEMENTARY (SCHOOL DISTRICT)
FCI VICTORVILLE UNICOR PRISON INDUSTRIES (13777 AIR EXPRESSWAY BLVD in VICTORVILLE, CA) . Federal Facility
HAZARDOUS WASTE BIENNIAL REPORTER (Resource Conservation and Recovery Act (tracking hazardous waste)) Large Quantity Generators, more that 1000 kg of hazardous waste/month (Resource Conservation and Recovery Act (tracking hazardous waste)) - notification Organizations: FEDERAL BUREAU OF PRISONS (CONTACT/OPERATOR)
Alternative names: F C I VICTORVILLE UNICOR
LEADING EDGE AVIATION SERVICES INC (13516 PHANTOM in VICTORVILLE, CA)
Large Quantity Generators, more that 1000 kg of hazardous waste/month (Resource Conservation and Recovery Act (tracking hazardous waste)) Business NAICS classification: METAL COATING, ENGRAVING (EXCEPT JEWELRY AND SILVERWARE), AND ALLIED SERVICES TO MANUFACTURERS.
LEADING EDGE AVIATION SERVICES INC (13010 AEROSPACE DRIVE LEAS in VICTORVILLE, CA)
Large Quantity Generators, more that 1000 kg of hazardous waste/month (Resource Conservation and Recovery Act (tracking hazardous waste))
FRONTIER VICTORVILLE OPERATIONS B685 AEB (18310 READINESS ST in VICTORVILLE, CA) . Federal Facility. U.S. AIR FORCE
Small Quantity Generators, between 100 kg and 1000 kg of hazardous waste/month (Resource Conservation and Recovery Act (tracking hazardous waste)) Organizations: FRONTIER SYSTEMS A SUBS OF THE BOEING CO (CONTACT/OPERATOR)
, UNITED STATES AIR FORCE (CONTACT/OWNER)
GEORGE AFB (L / 11) DISPOSAL SITE (W SIDE OF BASE OFF EXTENSION O - GEORGE AIR FORCE in VICTORVILLE, CA)
CRITERIA AND HAZARDOUS AIR POLLUTANT INVENTORY (Inventory of air pollution sources) Business SIC classification: REFUSE SYSTEMS Business NAICS classification: SOLID WASTE LANDFILL.
GEORGE AFB DISPOSAL AREA B / 1 (EXTREME SW CORNER OF BASE in VICTORVILLE, CA)
CRITERIA AND HAZARDOUS AIR POLLUTANT INVENTORY (Inventory of air pollution sources) Business SIC classification: REFUSE SYSTEMS Business NAICS classification: SOLID WASTE LANDFILL.
GEORGE AFB DUMP AREAS B / 3,7,9,10 (AIR BASE ROAD in VICTORVILLE, CA)
CRITERIA AND HAZARDOUS AIR POLLUTANT INVENTORY (Inventory of air pollution sources) Business SIC classification: REFUSE SYSTEMS Business NAICS classification: SOLID WASTE LANDFILL.
LEACH LAKE RANGE DISPOSAL SITE (SEC 2 OF T17N, R1E, AND SEC 1 in GEORGE AIR FORCE BASE, CA)
CRITERIA AND HAZARDOUS AIR POLLUTANT INVENTORY (Inventory of air pollution sources) Business SIC classification: REFUSE SYSTEMS Business NAICS classification: SOLID WASTE LANDFILL.
Housing units lacking complete plumbing facilities: 1.0% Housing units lacking complete kitchen facilities: 1.0%
80.5%Utility gas
12.9%Electricity
3.2%Solar energy
1.9%Bottled, tank, or LP gas
1.0%Wood
0.6%No fuel used
Population in 1990: 6,815. Population change in the 1990s: +5,258 (+77.2%).
Place of birth for U.S.-born residents:
This state: 26,721
Northeast: 523
Midwest: 1,447
South: 2,014
West: 1,143
49% of the 92394 zip code residents lived in the same house 5 years ago. Out of people who lived in different houses, 66% lived in this county. Out of people who lived in different counties, 50% lived in California.
86% of the 92394 zip code residents lived in the same house 1 year ago. Out of people who lived in different houses, 40% moved from this county. Out of people who lived in different houses, 50% moved from different county within same state. Out of people who lived in different houses, 8% moved from different state. Out of people who lived in different houses, 1% moved from abroad.
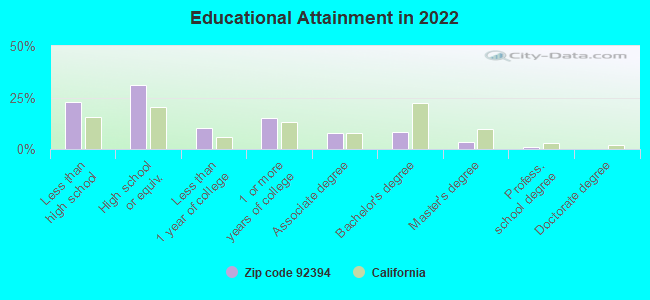
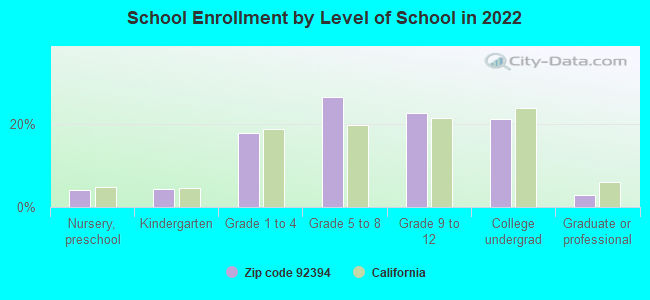
Private vs. public school enrollment:
Students in private schools in grades 1 to 8 (elementary and middle school): 116
Here:
2.2%
California:
10.5%
Students in private schools in grades 9 to 12 (high school): 108
Here:
4.0%
California:
8.5%
Students in private undergraduate colleges: 519
Here:
20.1%
California:
15.9%
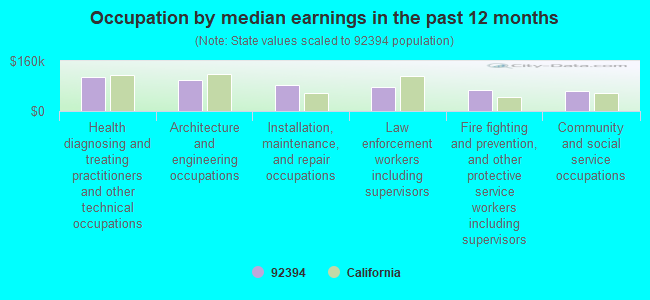
Occupation by median earnings in the past 12 months ($)
110,241Health diagnosing and treating practitioners and other technical occupations
100,129Architecture and engineering occupations
84,632Installation, maintenance, and repair occupations
76,376Law enforcement workers including supervisors
67,417Fire fighting and prevention, and other protective service workers including supervisors
64,387Community and social service occupations
Companies with biggest federal contracts located in this zip code (VICTORVILLE, CA):
FREEMAN HOLDINGS OF CALIFORNIA (18590 READINESS STREET; small business)
$3,220,465 with Defense Logistics Agency for Liquid Propellants and Fuels, Petroleum Base. Signed on 2006-05-05. Completion date: 2010-03-31.
J C HIMMELRICK INC (17496 TURNER RD; small business) : $519,738 in 35 contractsfrom 1999 to 2006
Contracts for Solid Fuel Handling Services, Hazardous Substance Removal, Cleanup, and Disposal Services and Operational Support, Construction of Structures and Facilities -- Waste Treatment and Storage Facilities, Construction of Structures and Facilities -- Other Utilities, and moreby Army Signed by year:2000: $81,752; 2001: $30,640; 2002: $162,780; 2003: $74,058; 2004: $42,222; 2005: $51,954; 2006: $41,468.
Biggest contracts:
$44,752 with Army for Solid Fuel Handling Services. Signed on 2005-11-18. Completion date: 2004-09-30.
$43,450, same as above.Signed on 2004-12-17. Completion date: 2004-12-21.
$43,000 with Army for Hazardous Substance Removal, Cleanup, and Disposal Services and Operational Support. Signed on 2000-11-13. Completion date: 2001-09-30.
$42,589 with Army for Construction of Structures and Facilities -- Waste Treatment and Storage Facilities. Signed on 2003-08-29. Completion date: 2003-09-30.
MOJAVE EQUIPMENT CO INC (17430 D ST; small business) : $219,932 in 8 contractsfrom 2002 to 2005
Contracts for Maintenance, Repair and Rebuilding of Equipment -- Tractors, Maintenance, Repair and Rebuilding of Equipment -- Weapons, Maintenance, Repair and Rebuilding of Equipment -- Construction and Building Materials, Lease or Rental of Equipment -- Tractors, and moreby Army, Navy, Air Force Signed by year:2000: $0; 2001: $0; 2002: $182,406; 2003: $21,900; 2004: -$1,910; 2005: $17,536; 2006: $0.
Biggest contracts:
$120,945 with Army for Maintenance, Repair and Rebuilding of Equipment -- Tractors. Signed on 2002-03-14. Completion date: 2002-09-30.
$33,428 with Army for Maintenance, Repair and Rebuilding of Equipment -- Weapons. Signed on 2002-09-21. Completion date: 2002-09-30.
$25,887 with Navy for Maintenance, Repair and Rebuilding of Equipment -- Construction and Building Materials. Signed on 2002-04-02. Completion date: 2002-06-14.
$21,900 with Army for Lease or Rental of Equipment -- Tractors. Signed on 2003-12-23. Completion date: 2004-02-05.
SERVICE ROCK PRODUCTS CORPORAT (16952 D ST; small business) : $163,751 in 4 contractsfrom 2003 to 2006
$99,995 with Army for Earth Moving and Excavating Equipment. Signed on 2003-09-26. Completion date: 2003-10-10.
$34,875 with Navy for Miscellaneous Construction Materials. Signed on 2003-12-22. Completion date: 2003-12-24.
$27,416, same as above.Signed on 2006-03-16. Completion date: 2006-03-23.
$1,465 with National Park Service for Mineral Construction Materials, Bulk. Signed on 2005-08-26. Completion date: 2005-08-26.
WORLD SERVICE WEST LA INFLIGH (18590 READINESS ST BOX 12; small business) : $84,252 in 6 contractsfrom 1999 to 2002
Contracts for Other Cargo and Freight Services, Information and Data Broadcasting or Data Distribution Services, Facilities Operations Support Services by Army Signed by year:2000: $49,500; 2001: $0; 2002: -$31,248; 2003: $0; 2004: $0; 2005: $0; 2006: $0.
Biggest contracts:
$66,000 with Army for Other Cargo and Freight Services. Signed on 1999-11-17. Completion date: 2000-09-30.
$49,500 with Army for Information and Data Broadcasting or Data Distribution Services. Signed on 2000-12-11. Completion date: 2001-09-30.
$0 with Army for Facilities Operations Support Services. Signed on 2002-08-29. Completion date: 2002-09-27.
$0 with Army for Information and Data Broadcasting or Data Distribution Services. Signed on 2000-12-11. Completion date: 2001-09-30.
TESS CAFE (18003 WESTWINDS RD; small business) : $52,523 in 4 contractsfrom 2000 to 2003
$30,344 with Army for Food Services. Signed on 2000-10-26. Completion date: 2000-12-14.
$11,831 with Army for Food, Oils and Fats. Signed on 2003-01-15. Completion date: 2003-02-09.
$7,703, same as above.Signed on 2002-12-06. Completion date: 2002-10-25.
$2,645 with Army for Food Services. Signed on 2002-12-03. Completion date: 2002-10-28.
FLICK, KRISTOPHER (15217 COPPER CANYON CIR; small business)
$19,120 with Army for Maintenance, Repair or Alteration of Real Property -- Miscellaneous Buildings. Signed on 2000-09-27. Completion date: 2000-12-15.
GRAHAM EQUIPMENT (17109 EUREKA ST.; small business) 50 employees, $6000000 revenue
$12,000 with Bureau of Prisoners/Federal Prison System for Miscellaneous Items. Signed on 2005-05-10. Completion date: 2005-05-11.
$7,875 with Bureau of Prisoners/Federal Prison System for Miscellaneous Items. Signed on 2005-07-07. Completion date: 2005-07-07.
victor valley wra (20111 SHAY RD.) : $1,000 in 3 contractsfrom 2005 to 2006
$1,000 with Bureau of Prisoners/Federal Prison System for Quality Control Services -- Water Purification and Sewage Treatment Equipment. Signed on 2006-01-23. Completion date: 2006-01-23.
$1,000 with Bureau of Prisoners/Federal Prison System for Water Services. Signed on 2005-08-22. Completion date: 2006-04-26.
-$1,000 with Bureau of Prisoners/Federal Prison System for Quality Control Services -- Water Purification and Sewage Treatment Equipment. Signed on 2006-07-25. Completion date: 2006-07-25.
Top industries in this zip code by the number of employees in 2005:
Other Services (except Public Administration): Religious Organizations (100-249 employees: 1 establishment, 20-49 employees: 1 establishment, 5-9 employees: 1 establishment, 1-4 employees: 2 establishments)
Accommodation and Food Services: Limited-Service Restaurants (20-49: 3)
Accommodation and Food Services: Full-Service Restaurants (20-49: 1, 10-19: 1)
Administrative and Support and Waste Management and Remediation Services: Janitorial Services (20-49: 1, 1-4: 2)
Professional, Scientific, and Technical Services: Media Representatives (20-49: 1)
People in group quarters in 2010:
4,463 people in federal prisons
44 people in emergency and transitional shelters (with sleeping facilities) for people experiencing homelessness
7 people in group homes intended for adults
5 people in group homes for juveniles (non-correctional)
2 people in other noninstitutional facilities
People in group quarters in 2000:
135 people in other types of correctional institutions
Fatal accident statistics in 2014:
Fatal accident count: 9
Vehicles involved in fatal accidents: 13
Fatal accidents caused by drunken drivers: 3
Fatalities: 9
Persons involved in fatal accidents: 19
Pedestrians involved in fatal accidents: 3
Fatal accident statistics in 2013:
Fatal accident count: 3
Vehicles involved in fatal accidents: 5
Fatal accidents caused by drunken drivers: 1
Fatalities: 3
Persons involved in fatal accidents: 6
Pedestrians involved in fatal accidents: 0
Home Mortgage Disclosure Act Aggregated Statistics For Year 2009 (Based on 2 full and 2 partial tracts)
A) FHA, FSA/RHS & VA Home Purchase Loans
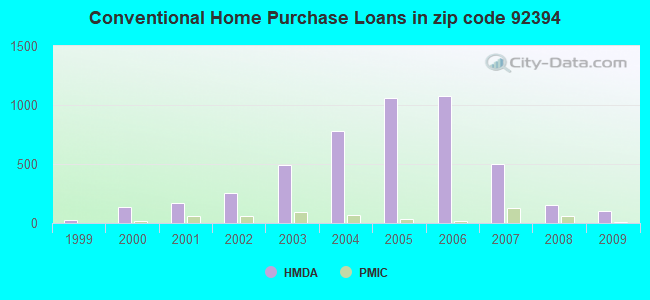
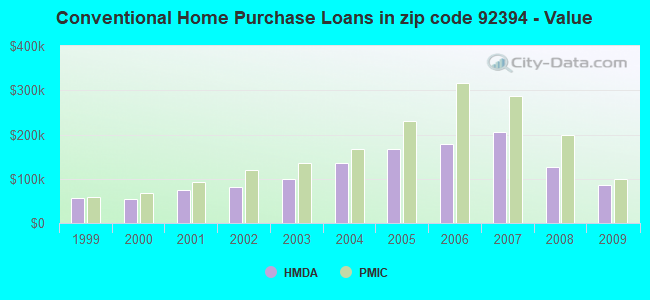
B) Conventional Home Purchase Loans
C) Refinancings
D) Home Improvement Loans
E) Loans on Dwellings For 5+ Families
F) Non-occupant Loans on < 5 Family Dwellings (A B C & D)
G) Loans On Manufactured Home Dwelling (A B C & D)
Number
Average Value
Number
Average Value
Number
Average Value
Number
Average Value
Number
Average Value
Number
Average Value
Number
Average Value
LOANS ORIGINATED
225
$115,601
98
$85,951
86
$150,429
10
$31,585
0
$0
63
$80,924
0
$0
APPLICATIONS APPROVED, NOT ACCEPTED
14
$114,677
16
$73,476
10
$127,915
1
$34,080
0
$0
13
$78,031
1
$40,630
APPLICATIONS DENIED
54
$122,121
38
$90,362
66
$161,800
8
$51,769
1
$88,182,410
21
$85,314
5
$49,540
APPLICATIONS WITHDRAWN
37
$115,766
14
$79,946
38
$161,238
4
$99,605
0
$0
12
$78,090
0
$0
FILES CLOSED FOR INCOMPLETENESS
10
$160,283
13
$99,001
7
$125,256
0
$0
0
$0
8
$92,070
0
$0
Aggregated Statistics For Year 2008 (Based on 2 full and 2 partial tracts)
A) FHA, FSA/RHS & VA Home Purchase Loans
B) Conventional Home Purchase Loans
C) Refinancings
D) Home Improvement Loans
F) Non-occupant Loans on < 5 Family Dwellings (A B C & D)
G) Loans On Manufactured Home Dwelling (A B C & D)
Number
Average Value
Number
Average Value
Number
Average Value
Number
Average Value
Number
Average Value
Number
Average Value
LOANS ORIGINATED
195
$171,541
149
$126,137
106
$161,476
22
$82,210
62
$120,406
9
$34,949
APPLICATIONS APPROVED, NOT ACCEPTED
18
$200,449
34
$176,777
25
$186,787
4
$54,062
10
$152,161
0
$0
APPLICATIONS DENIED
59
$211,828
79
$156,824
252
$218,787
48
$87,892
39
$166,009
13
$33,672
APPLICATIONS WITHDRAWN
47
$197,984
43
$147,183
50
$193,471
4
$160,548
18
$166,737
0
$0
FILES CLOSED FOR INCOMPLETENESS
5
$137,350
10
$219,394
17
$196,436
0
$0
4
$126,472
0
$0
Aggregated Statistics For Year 2007 (Based on 2 full and 2 partial tracts)
A) FHA, FSA/RHS & VA Home Purchase Loans
B) Conventional Home Purchase Loans
C) Refinancings
D) Home Improvement Loans
E) Loans on Dwellings For 5+ Families
F) Non-occupant Loans on < 5 Family Dwellings (A B C & D)
G) Loans On Manufactured Home Dwelling (A B C & D)
Number
Average Value
Number
Average Value
Number
Average Value
Number
Average Value
Number
Average Value
Number
Average Value
Number
Average Value
LOANS ORIGINATED
30
$279,857
500
$205,543
520
$206,866
88
$104,088
1
$5,108,720
134
$196,600
12
$41,830
APPLICATIONS APPROVED, NOT ACCEPTED
5
$252,638
152
$204,957
172
$220,935
21
$48,118
0
$0
31
$242,630
7
$44,747
APPLICATIONS DENIED
14
$243,357
309
$230,176
577
$240,868
147
$122,706
0
$0
69
$213,210
9
$35,678
APPLICATIONS WITHDRAWN
14
$256,741
157
$218,941
213
$228,805
30
$143,773
0
$0
30
$208,429
3
$76,890
FILES CLOSED FOR INCOMPLETENESS
0
$0
31
$240,094
92
$260,824
4
$63,892
1
$3,407,560
1
$364,350
0
$0
Aggregated Statistics For Year 2006 (Based on 2 full and 2 partial tracts)
A) FHA, FSA/RHS & VA Home Purchase Loans
B) Conventional Home Purchase Loans
C) Refinancings
D) Home Improvement Loans
E) Loans on Dwellings For 5+ Families
F) Non-occupant Loans on < 5 Family Dwellings (A B C & D)
G) Loans On Manufactured Home Dwelling (A B C & D)
Number
Average Value
Number
Average Value
Number
Average Value
Number
Average Value
Number
Average Value
Number
Average Value
Number
Average Value
LOANS ORIGINATED
3
$215,377
1,080
$178,717
968
$214,858
123
$104,861
1
$720,830
241
$198,673
9
$98,732
APPLICATIONS APPROVED, NOT ACCEPTED
3
$281,780
271
$195,521
229
$223,557
39
$110,978
0
$0
60
$203,820
4
$29,160
APPLICATIONS DENIED
3
$247,703
463
$191,683
637
$230,480
125
$116,138
0
$0
114
$218,985
5
$76,276
APPLICATIONS WITHDRAWN
0
$0
266
$191,924
440
$229,137
50
$171,056
0
$0
60
$189,338
1
$120,580
FILES CLOSED FOR INCOMPLETENESS
0
$0
54
$202,099
85
$223,280
5
$132,370
0
$0
10
$213,890
0
$0
Aggregated Statistics For Year 2005 (Based on 2 full and 2 partial tracts)
A) FHA, FSA/RHS & VA Home Purchase Loans
B) Conventional Home Purchase Loans
C) Refinancings
D) Home Improvement Loans
E) Loans on Dwellings For 5+ Families
F) Non-occupant Loans on < 5 Family Dwellings (A B C & D)
G) Loans On Manufactured Home Dwelling (A B C & D)
Number
Average Value
Number
Average Value
Number
Average Value
Number
Average Value
Number
Average Value
Number
Average Value
Number
Average Value
LOANS ORIGINATED
26
$196,873
1,057
$166,643
1,073
$178,005
165
$112,799
7
$1,700,784
284
$179,060
17
$86,405
APPLICATIONS APPROVED, NOT ACCEPTED
1
$231,980
149
$163,315
185
$199,889
18
$84,607
0
$0
41
$181,109
7
$45,684
APPLICATIONS DENIED
1
$279,160
280
$170,504
573
$187,056
106
$84,892
0
$0
71
$180,082
9
$59,413
APPLICATIONS WITHDRAWN
9
$215,230
186
$173,676
439
$186,971
87
$131,632
1
$634,330
56
$169,301
3
$107,470
FILES CLOSED FOR INCOMPLETENESS
1
$347,310
39
$182,274
123
$176,579
3
$180,427
0
$0
14
$209,321
0
$0
Aggregated Statistics For Year 2004 (Based on 2 full and 2 partial tracts)
A) FHA, FSA/RHS & VA Home Purchase Loans
B) Conventional Home Purchase Loans
C) Refinancings
D) Home Improvement Loans
E) Loans on Dwellings For 5+ Families
F) Non-occupant Loans on < 5 Family Dwellings (A B C & D)
G) Loans On Manufactured Home Dwelling (A B C & D)
Number
Average Value
Number
Average Value
Number
Average Value
Number
Average Value
Number
Average Value
Number
Average Value
Number
Average Value
LOANS ORIGINATED
60
$152,640
777
$135,637
1,011
$142,492
100
$98,007
5
$698,288
191
$135,243
6
$89,660
APPLICATIONS APPROVED, NOT ACCEPTED
16
$149,572
200
$147,719
221
$139,985
24
$122,596
0
$0
39
$133,177
4
$81,585
APPLICATIONS DENIED
8
$171,034
224
$132,579
531
$146,273
111
$54,609
0
$0
76
$127,870
13
$48,694
APPLICATIONS WITHDRAWN
19
$190,607
183
$153,162
452
$143,920
43
$102,745
0
$0
45
$136,273
3
$72,957
FILES CLOSED FOR INCOMPLETENESS
0
$0
42
$172,874
81
$146,318
8
$63,400
0
$0
5
$190,562
0
$0
Aggregated Statistics For Year 2003 (Based on 2 full and 2 partial tracts)
A) FHA, FSA/RHS & VA Home Purchase Loans
B) Conventional Home Purchase Loans
C) Refinancings
D) Home Improvement Loans
F) Non-occupant Loans on < 5 Family Dwellings (A B C & D)
Number
Average Value
Number
Average Value
Number
Average Value
Number
Average Value
Number
Average Value
LOANS ORIGINATED
201
$140,958
492
$98,984
871
$101,619
33
$25,894
147
$92,071
APPLICATIONS APPROVED, NOT ACCEPTED
16
$133,190
89
$106,891
144
$126,930
7
$51,113
25
$110,706
APPLICATIONS DENIED
33
$167,518
117
$114,437
411
$109,613
56
$31,188
39
$91,708
APPLICATIONS WITHDRAWN
24
$162,624
115
$116,461
316
$106,507
12
$74,922
20
$93,708
FILES CLOSED FOR INCOMPLETENESS
8
$149,736
22
$140,353
52
$97,791
3
$20,533
8
$100,916
Aggregated Statistics For Year 2002 (Based on 2 full and 2 partial tracts)
A) FHA, FSA/RHS & VA Home Purchase Loans
B) Conventional Home Purchase Loans
C) Refinancings
D) Home Improvement Loans
E) Loans on Dwellings For 5+ Families
F) Non-occupant Loans on < 5 Family Dwellings (A B C & D)
Number
Average Value
Number
Average Value
Number
Average Value
Number
Average Value
Number
Average Value
Number
Average Value
LOANS ORIGINATED
183
$114,640
256
$80,547
393
$88,260
31
$23,337
3
$2,496,257
72
$81,658
APPLICATIONS APPROVED, NOT ACCEPTED
10
$128,046
50
$101,021
89
$85,749
8
$17,858
0
$0
14
$128,064
APPLICATIONS DENIED
20
$120,379
77
$79,228
261
$92,610
37
$32,801
1
$170,380
18
$104,987
APPLICATIONS WITHDRAWN
18
$107,032
39
$94,968
162
$96,491
8
$20,970
1
$7,863,600
10
$81,126
FILES CLOSED FOR INCOMPLETENESS
3
$77,763
16
$79,865
51
$102,458
1
$13,110
1
$5,897,700
5
$101,178
Aggregated Statistics For Year 2001 (Based on 2 full and 2 partial tracts)
A) FHA, FSA/RHS & VA Home Purchase Loans
B) Conventional Home Purchase Loans
C) Refinancings
D) Home Improvement Loans
F) Non-occupant Loans on < 5 Family Dwellings (A B C & D)
Number
Average Value
Number
Average Value
Number
Average Value
Number
Average Value
Number
Average Value
LOANS ORIGINATED
235
$110,368
171
$73,900
253
$78,242
13
$31,958
67
$90,862
APPLICATIONS APPROVED, NOT ACCEPTED
18
$117,372
14
$91,836
40
$89,895
5
$19,134
3
$35,387
APPLICATIONS DENIED
47
$112,549
55
$70,987
245
$76,995
34
$20,507
16
$78,554
APPLICATIONS WITHDRAWN
43
$122,526
34
$96,483
155
$80,817
7
$30,893
9
$83,296
FILES CLOSED FOR INCOMPLETENESS
12
$121,995
6
$73,175
25
$80,785
0
$0
4
$82,568
Aggregated Statistics For Year 2000 (Based on 2 full and 2 partial tracts)
A) FHA, FSA/RHS & VA Home Purchase Loans
B) Conventional Home Purchase Loans
C) Refinancings
D) Home Improvement Loans
E) Loans on Dwellings For 5+ Families
F) Non-occupant Loans on < 5 Family Dwellings (A B C & D)
Number
Average Value
Number
Average Value
Number
Average Value
Number
Average Value
Number
Average Value
Number
Average Value
LOANS ORIGINATED
263
$105,847
132
$55,293
52
$55,459
17
$23,976
3
$677,143
17
$56,279
APPLICATIONS APPROVED, NOT ACCEPTED
5
$81,258
17
$69,446
10
$44,036
19
$24,222
0
$0
3
$51,987
APPLICATIONS DENIED
41
$97,688
48
$58,185
140
$59,634
49
$23,664
0
$0
7
$48,117
APPLICATIONS WITHDRAWN
65
$117,006
31
$69,044
61
$48,650
3
$31,890
0
$0
3
$51,113
FILES CLOSED FOR INCOMPLETENESS
5
$104,586
3
$71,210
10
$48,152
1
$30,140
0
$0
0
$0
Aggregated Statistics For Year 1999 (Based on 1 full and 1 partial tracts)
A) FHA, FSA/RHS & VA Home Purchase Loans
B) Conventional Home Purchase Loans
C) Refinancings
D) Home Improvement Loans
E) Loans on Dwellings For 5+ Families
F) Non-occupant Loans on < 5 Family Dwellings (A B C & D)
Detailed PMIC statistics for the following Tracts:0091.02
, 0099.01
2006 - 2018 National Fire Incident Reporting System (NFIRS) incidents
Based on the data from the years 2006 - 2018 the average number of fire incidents per year is 32. The highest number of fires - 79 took place in 2007, and the least - 0 in 2012. The data has a decreasing trend.
When looking into fire subcategories, the most incidents belonged to: Outside Fires (50.7%), and Structure Fires (25.6%).
Fire incident types reported to NFIRS in Zip Code 92394


 Nearest zip codes: 92395, 92392, 92368, 92301, 92344, 92345.


 Based on the data from the years 2006 - 2018 the average number of fire incidents per year is 32. The highest number of fires - 79 took place in 2007, and the least - 0 in 2012. The data has a decreasing trend.
 When looking into fire subcategories, the most incidents belonged to: Outside Fires (50.7%), and Structure Fires (25.6%).