Estimated zip code population in 2022: 86,749 Zip code population in 2010: 78,715 Zip code population in 2000: 68,501
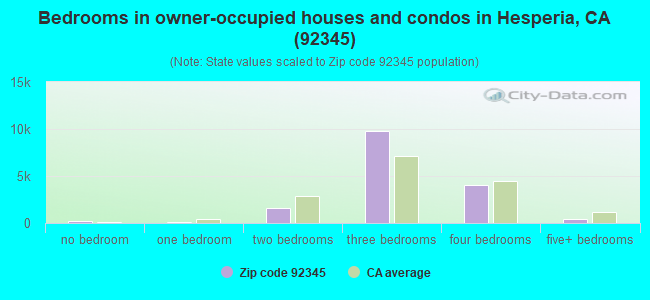
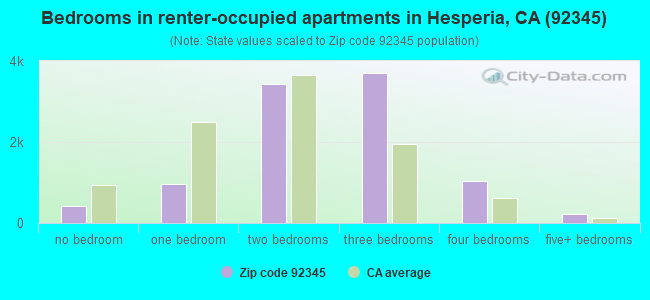
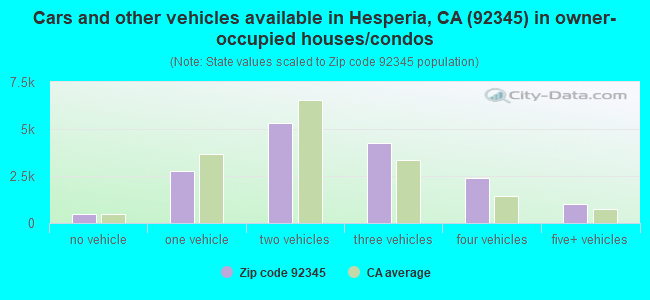
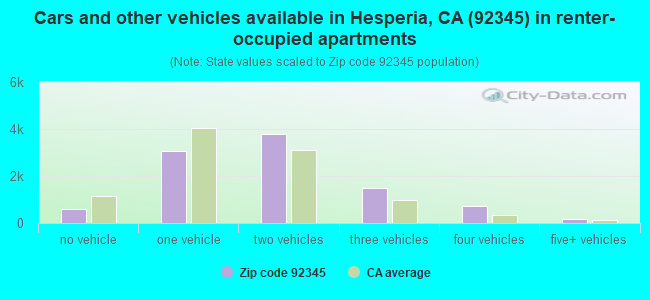
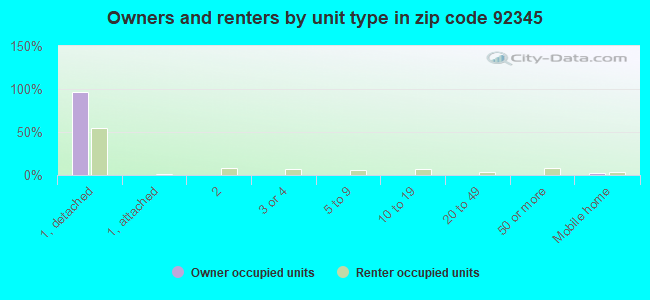
Houses and condos: 27,283 Renter-occupied apartments: 9,799
% of renters here:
38%
State:
44%
March 2022 cost of living index in zip code 92345: 81.6 (low, U.S. average is 100)
Land area: 82.0 sq. mi. Water area: 0.2 sq. mi.
Population density: 1,058 people per square mile
(low).
OSM Map
General Map
Google Map
MSN Map
OSM Map
General Map
Google Map
MSN Map
OSM Map
General Map
Google Map
MSN Map
OSM Map
General Map
Google Map
MSN Map
Please wait while loading the map...
Real estate property taxes paid for housing units in 2022:
This zip code:
0.6% ($2,112)
California:
0.7% ($4,831)
Median real estate property taxes paid for housing units with mortgages in 2022: $2,275 (0.6%) Median real estate property taxes paid for housing units with no mortgage in 2022: $1,788 (0.5%)
Averages for the 2020 tax year for zip code 92345, filed in 2021:
Average Adjusted Gross Income (AGI) in 2020: $45,612 (Individual Income Tax Returns)
Here:
$45,612
State:
$95,910
Salary/wage: $43,873 (reported on 80.7% of returns)
Here:
$43,873
State:
$77,331
(% of AGI for various income ranges: 1065.4% for AGIs below $25k, 3532.2% for AGIs $25k-50k, 7134.6% for AGIs $50k-75k, 10467.1% for AGIs $75k-100k, 18956.6% for AGIs $100k-200k, 49669.2% for AGIs over 200k)
Taxable interest for individuals: $336 (reported on 24.4% of returns)
This zip code:
$336
California:
$2,294
(% of AGI for various income ranges: 4.6% for AGIs below $25k, 6.4% for AGIs $25k-50k, 16.0% for AGIs $50k-75k, 18.6% for AGIs $75k-100k, 39.7% for AGIs $100k-200k, 227.5% for AGIs over 200k)
Ordinary dividends: $2,011 (reported on 4.8% of returns)
Here:
$2,011
State:
$10,949
(% of AGI for various income ranges: 4.1% for AGIs below $25k, 6.0% for AGIs $25k-50k, 10.1% for AGIs $50k-75k, 21.6% for AGIs $75k-100k, 47.4% for AGIs $100k-200k, 754.2% for AGIs over 200k)
Net capital gain/loss in AGI: +$8,247 (reported on 5.5% of returns)
Here:
+$8,247
State:
+$49,306
(% of AGI for various income ranges: 2.0% for AGIs below $25k, 6.7% for AGIs $25k-50k, 30.5% for AGIs $50k-75k, 77.7% for AGIs $75k-100k, 257.3% for AGIs $100k-200k, 7118.3% for AGIs over 200k)
Profit/loss from business: +$9,836 (reported on 18.8% of returns)
Here:
+$9,836
State:
+$15,671
(% of AGI for various income ranges: 216.9% for AGIs below $25k, 247.8% for AGIs $25k-50k, 247.8% for AGIs $50k-75k, 218.3% for AGIs $75k-100k, 406.7% for AGIs $100k-200k, 2430.8% for AGIs over 200k)
Taxable individual retirement arrangement distribution: $15,552 (reported on 2.9% of returns)
92345:
$15,552
California:
$23,505
(% of AGI for various income ranges: 15.8% for AGIs below $25k, 33.6% for AGIs $25k-50k, 91.3% for AGIs $50k-75k, 101.5% for AGIs $75k-100k, 256.1% for AGIs $100k-200k, 1382.5% for AGIs over 200k)
Total itemized deductions: $26,533 (reported on 7.5% of returns)
Here:
$26,533
State:
$39,517
(% of AGI for various income ranges: 27.8% for AGIs below $25k, 119.1% for AGIs $25k-50k, 398.1% for AGIs $50k-75k, 677.1% for AGIs $75k-100k, 1350.4% for AGIs $100k-200k, 5570.0% for AGIs over 200k)
Charity contributions: $5,598 (reported on 6.0% of returns)
Here:
$5,598
State:
$12,598
(% of AGI for various income ranges: 1.8% for AGIs below $25k, 13.3% for AGIs $25k-50k, 46.1% for AGIs $50k-75k, 98.1% for AGIs $75k-100k, 306.7% for AGIs $100k-200k, 1408.3% for AGIs over 200k)
Taxes paid: $7,711 (reported on 7.4% of returns)
92345:
$7,711
State:
$8,807
(% of AGI for various income ranges: 6.0% for AGIs below $25k, 27.1% for AGIs $25k-50k, 110.4% for AGIs $50k-75k, 214.9% for AGIs $75k-100k, 436.5% for AGIs $100k-200k, 1320.0% for AGIs over 200k)
Earned income credit: $2,535 (reported on 25.6% of returns)
Here:
$2,535
State:
$2,074
(% of AGI for various income ranges: 138.6% for AGIs below $25k, 107.9% for AGIs $25k-50k, 2.4% for AGIs $50k-75k)
Percentage of individuals using paid preparers for their 2020 taxes: 93.6%
Here:
94%
State:
92%
(% for various income ranges: 93.3% for AGIs below $25k, 93.6% for AGIs $25k-50k, 93.4% for AGIs $50k-75k, 93.6% for AGIs $75k-100k, 94.5% for AGIs $100k-200k, 97.1% for AGIs over 200k)
Averages for the 2012 tax year for zip code 92345, filed in 2013:
Average Adjusted Gross Income (AGI) in 2012: $37,499 (Individual Income Tax Returns)
Here:
$37,499
State:
$72,726
Salary/wage: $36,514 (reported on 80.6% of returns)
Here:
$36,514
State:
$59,079
(% of AGI for various income ranges: 67.1% for AGIs below $25k, 79.9% for AGIs $25k-50k, 83.1% for AGIs $50k-75k, 83.8% for AGIs $75k-100k, 82.4% for AGIs $100k-200k, 47.4% for AGIs over 200k)
Taxable interest for individuals: $518 (reported on 25.9% of returns)
This zip code:
$518
California:
$2,146
(% of AGI for various income ranges: 0.4% for AGIs below $25k, 0.3% for AGIs $25k-50k, 0.3% for AGIs $50k-75k, 0.3% for AGIs $75k-100k, 0.4% for AGIs $100k-200k, 1.1% for AGIs over 200k)
Ordinary dividends: $2,010 (reported on 5.7% of returns)
Here:
$2,010
State:
$9,308
(% of AGI for various income ranges: 0.3% for AGIs below $25k, 0.3% for AGIs $25k-50k, 0.2% for AGIs $50k-75k, 0.2% for AGIs $75k-100k, 0.2% for AGIs $100k-200k, 3.5% for AGIs over 200k)
Net capital gain/loss in AGI: +$2,729 (reported on 4.6% of returns)
Here:
+$2,729
State:
+$30,460
(% of AGI for various income ranges: 0.2% for AGIs $75k-100k, 0.3% for AGIs $100k-200k, 7.8% for AGIs over 200k)
Profit/loss from business: +$9,239 (reported on 19.9% of returns)
Here:
+$9,239
State:
+$17,064
(% of AGI for various income ranges: 18.1% for AGIs below $25k, 4.2% for AGIs $25k-50k, 1.7% for AGIs $50k-75k, 1.2% for AGIs $75k-100k, 1.4% for AGIs $100k-200k, 1.9% for AGIs over 200k)
Taxable individual retirement arrangement distribution: $13,085 (reported on 4.5% of returns)
92345:
$13,085
California:
$19,557
(% of AGI for various income ranges: 1.4% for AGIs below $25k, 1.2% for AGIs $25k-50k, 1.4% for AGIs $50k-75k, 1.4% for AGIs $75k-100k, 2.7% for AGIs $100k-200k)
Self-employment retirement plans: $12,900 (reported on 0.1% of returns)
92345:
$12,900
California:
$24,530
Total itemized deductions: $20,094 (29% of AGI, reported on 28.0% of returns)
Here:
$20,094
State:
$34,004
Here:
28.9% of AGI
State:
22.7% of AGI
(% of AGI for various income ranges: 6.8% for AGIs below $25k, 12.8% for AGIs $25k-50k, 17.7% for AGIs $50k-75k, 18.5% for AGIs $75k-100k, 19.2% for AGIs $100k-200k, 14.2% for AGIs over 200k)
Charity contributions: $2,612 (reported on 22.2% of returns)
Here:
$2,612
State:
$4,659
(% of AGI for various income ranges: 0.5% for AGIs below $25k, 1.1% for AGIs $25k-50k, 1.7% for AGIs $50k-75k, 2.0% for AGIs $75k-100k, 2.3% for AGIs $100k-200k, 2.5% for AGIs over 200k)
Taxes paid: $5,020 (reported on 27.9% of returns)
92345:
$5,020
State:
$14,448
(% of AGI for various income ranges: 1.1% for AGIs below $25k, 2.4% for AGIs $25k-50k, 3.9% for AGIs $50k-75k, 4.8% for AGIs $75k-100k, 6.4% for AGIs $100k-200k, 6.3% for AGIs over 200k)
Earned income credit: $2,750 (reported on 34.1% of returns)
Here:
$2,750
State:
$2,286
(% of AGI for various income ranges: 12.0% for AGIs below $25k, 2.1% for AGIs $25k-50k)
Percentage of individuals using paid preparers for their 2012 taxes: 66.3%
Here:
66%
State:
64%
(% for various income ranges: 61.8% for AGIs below $25k, 68.7% for AGIs $25k-50k, 72.3% for AGIs $50k-75k, 72.3% for AGIs $75k-100k, 72.4% for AGIs $100k-200k, 81.8% for AGIs over 200k)
Averages for the 2004 tax year for zip code 92345, filed in 2005:
Average Adjusted Gross Income (AGI) in 2004: $39,581 (Individual Income Tax Returns)
Here:
$39,581
State:
$58,600
Salary/wage: $37,512 (reported on 85.0% of returns)
Here:
$37,512
State:
$49,455
(% of AGI for various income ranges: 103.4% for AGIs below $10k, 74.9% for AGIs $10k-25k, 84.0% for AGIs $25k-50k, 87.6% for AGIs $50k-75k, 87.3% for AGIs $75k-100k, 64.4% for AGIs over 100k)
Taxable interest for individuals: $836 (reported on 37.4% of returns)
This zip code:
$836
California:
$2,365
(% of AGI for various income ranges: 4.8% for AGIs below $10k, 1.1% for AGIs $10k-25k, 0.6% for AGIs $25k-50k, 0.4% for AGIs $50k-75k, 0.6% for AGIs $75k-100k, 1.2% for AGIs over 100k)
Taxable dividends: $1,204 (reported on 9.3% of returns)
Here:
$1,204
State:
$4,746
(% of AGI for various income ranges: 1.2% for AGIs below $10k, 0.4% for AGIs $10k-25k, 0.2% for AGIs $25k-50k, 0.1% for AGIs $50k-75k, 0.2% for AGIs $75k-100k, 0.4% for AGIs over 100k)
Net capital gain/loss: +$15,470 (reported on 9.0% of returns)
Here:
+$15,470
State:
+$23,418
(% of AGI for various income ranges: -0.2% for AGIs below $10k, 0.2% for AGIs $10k-25k, 0.6% for AGIs $25k-50k, 1.1% for AGIs $50k-75k, 2.1% for AGIs $75k-100k, 12.7% for AGIs over 100k)
Profit/loss from business: +$9,327 (reported on 17.6% of returns)
Here:
+$9,327
State:
+$16,826
(% of AGI for various income ranges: 7.3% for AGIs below $10k, 9.7% for AGIs $10k-25k, 4.6% for AGIs $25k-50k, 2.0% for AGIs $50k-75k, 2.2% for AGIs $75k-100k, 4.6% for AGIs over 100k)
IRA payment deduction: $3,086 (reported on 1.6% of returns)
92345:
$3,086
California:
$3,192
(% of AGI for various income ranges: 0.1% for AGIs $10k-25k, 0.2% for AGIs $25k-50k, 0.1% for AGIs $50k-75k, 0.1% for AGIs $75k-100k, 0.1% for AGIs over 100k)
Self-employed pension: $15,608 (reported on 0.3% of returns)
Here:
$15,608
California:
$17,688
Total itemized deductions: $19,190 (30% of AGI, reported on 42.8% of returns)
Here:
$19,190
State:
$28,113
Here:
30.1% of AGI
State:
25.3% of AGI
(% of AGI for various income ranges: 18.9% for AGIs below $10k, 13.0% for AGIs $10k-25k, 21.4% for AGIs $25k-50k, 23.8% for AGIs $50k-75k, 23.1% for AGIs $75k-100k, 18.7% for AGIs over 100k)
Charity contributions deductions: $2,413 (4% of AGI, reported on 37.0% of returns)
Here:
$2,413
State:
$3,923
Here:
3.6% of AGI
State:
3.3% of AGI
(% of AGI for various income ranges: 0.8% for AGIs below $10k, 1.1% for AGIs $10k-25k, 2.0% for AGIs $25k-50k, 2.5% for AGIs $50k-75k, 2.8% for AGIs $75k-100k, 2.6% for AGIs over 100k)
Total tax: $4,597 (reported on 69.3% of returns)
92345:
$4,597
State:
$10,761
(% of AGI for various income ranges: 4.0% for AGIs below $10k, 4.0% for AGIs $10k-25k, 5.1% for AGIs $25k-50k, 6.7% for AGIs $50k-75k, 8.6% for AGIs $75k-100k, 15.0% for AGIs over 100k)
Earned income credit: $1,937 (reported on 21.7% of returns)
Here:
$1,937
State:
$1,763
Percentage of individuals using paid preparers for their 2004 taxes: 71.0%
Here:
71%
State:
66%
(% for various income ranges: 61.7% for AGIs below $10k, 70.7% for AGIs $10k-25k, 73.3% for AGIs $25k-50k, 74.5% for AGIs $50k-75k, 74.4% for AGIs $75k-100k, 78.5% for AGIs over 100k)
Likely homosexual households (counted as self-reported same-sex unmarried-partner households)
Lesbian couples: 0.0% of all households
Gay men: 0.1% of all households
Household received Food Stamps/SNAP in the past 12 months: 6,240 Household did not receive Food Stamps/SNAP in the past 12 months: 20,462
Women who had a birth in the past 12 months: 1,411 (710 now married, 706 unmarried) Women who did not have a birth in the past 12 months: 18,791 (7,964 now married, 10,805 unmarried)
Housing units in zip code 92345 with a mortgage: 11,525 (414 second mortgage, 4 home equity loan, 203 both second mortgage and home equity loan) Median monthly owner costs for units with a mortgage: $1,666 Median monthly owner costs for units without a mortgage: $502
Residents with income below the poverty level in 2022:
This zip code:
19.1%
Whole state:
12.2%
Residents with income below 50% of the poverty level in 2022:
This zip code:
10.8%
Whole state:
6.2%
Median number of rooms in houses and condos:
Here:
6.3
State:
6.0
Median number of rooms in apartments:
Here:
5.0
State:
3.9
Notable locations in this zip code not listed on our city pages
13,698 married couples with children.
6,074 single-parent households (2,409 men, 3,665 women).
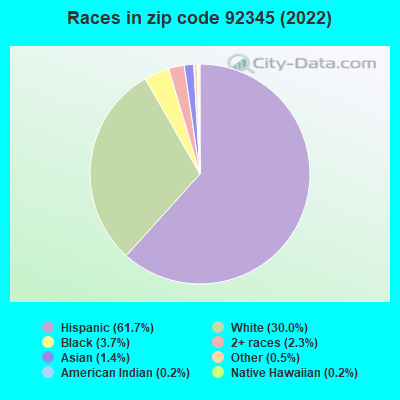
64.6% of residents of 92345 zip code speak English at home.
33.4% of residents speak Spanish at home (64% very well, 17% well, 15% not well, 4% not at all).
0.4% of residents speak other Indo-European language at home (65% very well, 35% well).
0.7% of residents speak Asian or Pacific Island language at home (53% very well, 32% well, 15% not well).
0.3% of residents speak other language at home (75% very well, 16% well, 9% not well).
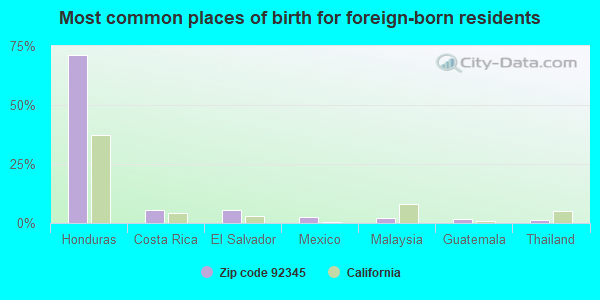
Foreign born population: 15,053 (17.4%) (46.9% of them are naturalized citizens)
This zip code:
17.4%
Whole state:
26.7%
71%Honduras
6%Costa Rica
5%El Salvador
2%Mexico
2%Malaysia
2%Guatemala
1%Thailand
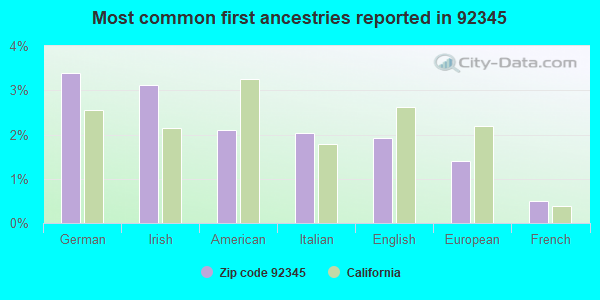
3%German
3%Irish
2%American
2%Italian
2%English
1%European
1%French
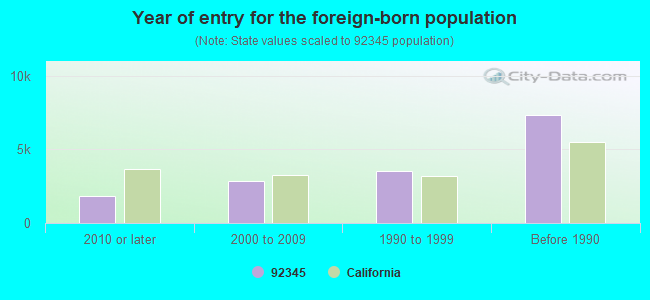
Year of entry for the foreign-born population
1,8362010 or later
2,8572000 to 2009
3,5641990 to 1999
7,346Before 1990
Major facilities with environmental interests located in this zip code:
C AND M WOOD INDUSTRIES INCORPORATED (17229 LEMON STREET SUITE D in HESPERIA, CA)
AIR MAJOR (AIRS/AFS) STATE MASTER (California - Hazardous Waste Tracking) - HAZARDOU WASTE PROGRAM ENFORCEMENT/COMPLIANCE ACTIVITY (Integrated Compliance Information System) COMPLIANCE ACTIVITY (Tracking inspections of insecticide, fungicide, and rodenticide, and toxic substances) CRITERIA AND HAZARDOUS AIR POLLUTANT INVENTORY (Inventory of air pollution sources) HAZARDOUS WASTE BIENNIAL REPORTER (Resource Conservation and Recovery Act (tracking hazardous waste)) Large Quantity Generators, more that 1000 kg of hazardous waste/month (Resource Conservation and Recovery Act (tracking hazardous waste)) Large Quantity Generators, more that 1000 kg of hazardous waste/month (Resource Conservation and Recovery Act (tracking hazardous waste)) - notification TRI REPORTER (Tracking of toxic chemicals releasing facilities) Business SIC classification: DRAPERY HARDWARE AND WINDOW BLINDS AND SHADES Organizations: CALVIN T LAM (CONTACT/OWNER)
HIGH TECH ETCH (17229 LEMON ST BLDG E STE 4 in HESPERIA, CA)
STATE MASTER (California - Hazardous Waste Tracking) - HAZARDOU WASTE PROGRAM HAZARDOUS WASTE BIENNIAL REPORTER (Resource Conservation and Recovery Act (tracking hazardous waste)) Large Quantity Generators, more that 1000 kg of hazardous waste/month (Resource Conservation and Recovery Act (tracking hazardous waste)) Organizations: WILL ASHFORD (CONTACT/OPERATOR)
ACCENT AUTO BODY (11550 I AVENUE in HESPERIA, CA)
STATE MASTER (California - Hazardous Waste Tracking) - HAZARDOU WASTE PROGRAM CRITERIA AND HAZARDOUS AIR POLLUTANT INVENTORY (Inventory of air pollution sources) Small Quantity Generators, between 100 kg and 1000 kg of hazardous waste/month (Resource Conservation and Recovery Act (tracking hazardous waste)) - notification Business SIC classification: TOP, BODY, AND UPHOLSTERY REPAIR SHOPS AND PAINT SHOPS Business NAICS classification: AUTOMOTIVE BODY, PAINT, AND INTERIOR REPAIR AND MAINTENANCE. Organizations: JOHN MARTINES (CONTACT/OWNER)
HESPERIA LANDFILL (SANTA FE AVE S OF MAIN in HESPERIA, CA)
STATE MASTER (California - Hazardous Waste Tracking) - HAZARDOU WASTE PROGRAM Small Quantity Generators, between 100 kg and 1000 kg of hazardous waste/month (Resource Conservation and Recovery Act (tracking hazardous waste)) - notification Organizations: SAN BERNARDINO CNTY (CONTACT/OWNER)
Alternative names: CNTY SAN BERNARDINO/HESPERIA LANDFILL
MOJAVE SIPHON POWER PLANT (16001 HWY 173 in HESPERIA, CA)
STATE MASTER (California - Hazardous Waste Tracking) - HAZARDOU WASTE PROGRAM Small Quantity Generators, between 100 kg and 1000 kg of hazardous waste/month (Resource Conservation and Recovery Act (tracking hazardous waste)) Organizations: DEPT OF WATER RESOURCES (CONTACT/OPERATOR)
, STATE OF CA DEPT OF WATER RESOURCES (CONTACT/OWNER)
ADVANCED DOUBLE DISK (17344 EUCALYPTUS in HESPERIA, CA)
STATE MASTER (California - Hazardous Waste Tracking) - HAZARDOU WASTE PROGRAM Small Quantity Generators, between 100 kg and 1000 kg of hazardous waste/month (Resource Conservation and Recovery Act (tracking hazardous waste)) - notification Organizations: JEFF BEEBE (CONTACT/OWNER)
HESPERIA UNIFIED SCHOOL DIST (11107 E SANTA FE in HESPERIA, CA)
STATE MASTER (California - Hazardous Waste Tracking) - HAZARDOU WASTE PROGRAM Small Quantity Generators, between 100 kg and 1000 kg of hazardous waste/month (Resource Conservation and Recovery Act (tracking hazardous waste)) - notification Alternative names: HESPERIA USD
M AND M ENGINEERING (17579 MESA RD in HESPERIA, CA)
STATE MASTER (California - Hazardous Waste Tracking) - HAZARDOU WASTE PROGRAM Small Quantity Generators, between 100 kg and 1000 kg of hazardous waste/month (Resource Conservation and Recovery Act (tracking hazardous waste)) - notification Organizations: GLEN MAURICE (CONTACT/OWNER)
JOSHUA CIRCLE ELEMENTARY (10140 EIGHT ST. in HESPERIA, CA)
(National Center for Education Statistics) - STATE ID-6035943 Organizations: HESPERIA UNIFIED (SCHOOL DISTRICT)
MESA ACADEMY (16119 OLIVE in HESPERIA, CA)
(National Center for Education Statistics) - STATE ID-6120851 Organizations: HESPERIA UNIFIED (SCHOOL DISTRICT)
JUNIPER ELEMENTARY (9400 I AVE. in HESPERIA, CA)
(National Center for Education Statistics) - STATE ID-6035950 Organizations: HESPERIA UNIFIED (SCHOOL DISTRICT)
HESPERIA COMMUNITY DAY (16527 LEMON ST. in HESPERIA, CA)
(National Center for Education Statistics) - STATE ID-3630944 Organizations: HESPERIA UNIFIED (SCHOOL DISTRICT)
KINGSTON ELEMENTARY (7473 KINGSTON AVE. in HESPERIA, CA)
(National Center for Education Statistics) - STATE ID-6100937 Organizations: HESPERIA UNIFIED (SCHOOL DISTRICT)
Housing units lacking complete plumbing facilities: 1.5% Housing units lacking complete kitchen facilities: 1.6%
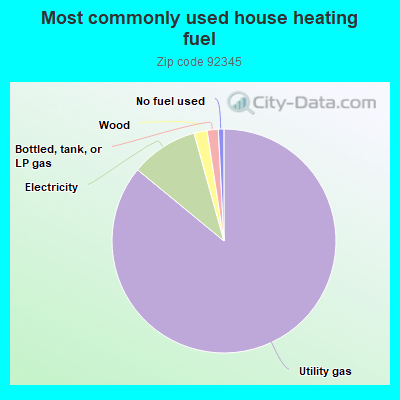
85.8%Utility gas
9.7%Electricity
1.9%Wood
1.6%Bottled, tank, or LP gas
0.8%No fuel used
Population in 1990: 52,170. Population change in the 1990s: +16,331 (+31.3%).
Place of birth for U.S.-born residents:
This state: 62,354
Northeast: 1,670
Midwest: 2,449
South: 2,254
West: 2,167
51% of the 92345 zip code residents lived in the same house 5 years ago. Out of people who lived in different houses, 69% lived in this county. Out of people who lived in different counties, 50% lived in California.
94% of the 92345 zip code residents lived in the same house 1 year ago. Out of people who lived in different houses, 50% moved from this county. Out of people who lived in different houses, 42% moved from different county within same state. Out of people who lived in different houses, 9% moved from different state. Out of people who lived in different houses, 3% moved from abroad.
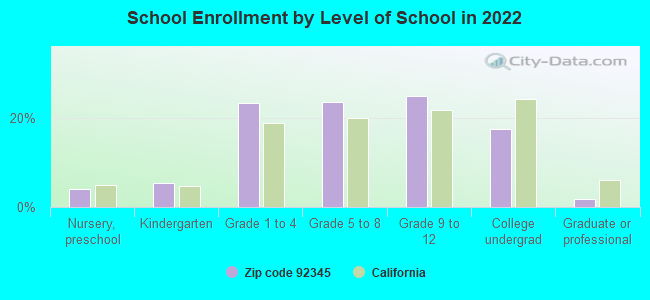
Private vs. public school enrollment:
Students in private schools in grades 1 to 8 (elementary and middle school): 551
Here:
5.1%
California:
10.5%
Students in private schools in grades 9 to 12 (high school): 123
Here:
2.1%
California:
8.5%
Students in private undergraduate colleges: 614
Here:
14.9%
California:
15.9%
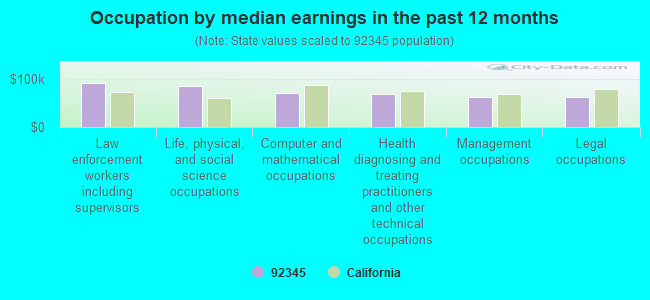
Occupation by median earnings in the past 12 months ($)
92,018Law enforcement workers including supervisors
86,301Life, physical, and social science occupations
71,349Computer and mathematical occupations
68,231Health diagnosing and treating practitioners and other technical occupations
63,070Management occupations
62,898Legal occupations
Companies with biggest federal contracts located in this zip code (HESPERIA, CA):
JR CARDENAS CONSTRUCTION, INC (11580 I AVENUE; small business) : $25,417,499 in 123 contractsfrom 2000 to 2006
Contracts for Maintenance, Repair or Alteration of Real Property -- Other Non-Building Facilities, Construction of Structures and Facilities -- Other Administrative Facilities and Service Buildings, Maintenance, Repair or Alteration of Real Property -- Other Warehouse Buildings, Construction of Structures and Facilities -- Miscellaneous Buildings, and moreby Navy, National Park Service, Bureau of Land Management Signed by year:2000: $5,279,443; 2001: $4,233,703; 2002: $2,266,687; 2003: $7,265,904; 2004: $5,325,883; 2005: $795,536; 2006: $250,343.
Biggest contracts:
$2,185,977 with Navy for Maintenance, Repair or Alteration of Real Property -- Other Non-Building Facilities. Signed on 2004-04-15. Completion date: 2005-05-16.
$1,755,058 with National Park Service for Construction of Structures and Facilities -- Other Administrative Facilities and Service Buildings. Signed on 2003-08-15. Completion date: 2004-08-15.
$1,579,948 with Navy for Maintenance, Repair or Alteration of Real Property -- Other Warehouse Buildings. Signed on 2000-04-13. Completion date: 2001-01-31.
$1,535,000 with National Park Service for Construction of Structures and Facilities -- Miscellaneous Buildings. Signed on 2001-09-15. Completion date: 2002-05-15.
CDM CONSTRUCTORS INC (12269 SCARBROUGH CT) : $5,354,797 in 6 contractsfrom 2004 to 2006
Contracts for Construction of Structures and Facilities -- Other Utilities by Navy Signed by year:2000: $0; 2001: $0; 2002: $0; 2003: $0; 2004: $25,000; 2005: $5,237,000; 2006: $92,797.
Biggest contracts:
$2,979,000 with Navy for Construction of Structures and Facilities -- Other Utilities. Signed on 2005-09-26. Completion date: 2006-09-26.
$2,283,000, same as above.Signed on 2005-09-30. Completion date: 2006-09-30.
$92,797, same as above.Signed on 2006-05-09. Completion date: 2007-01-01.
$25,000, same as above.Signed on 2004-12-10. Completion date: 2005-12-09.
DEL'S DISTRIBUTING CO., INC. (PO BOX 402727) 50 employees, $6000000 revenue: $867,110 in 126 contractsfrom 2004 to 2006
Contracts for Food, Oils and Fats, Perishable Subsistence $10k To $25K by Bureau of Prisoners/Federal Prison System Signed by year:2000: $0; 2001: $0; 2002: $0; 2003: $0; 2004: $41,628; 2005: $465,875; 2006: $359,607.
Biggest contracts:
$64,777 with Bureau of Prisoners/Federal Prison System for Food, Oils and Fats. Signed on 2005-01-03. Completion date: 2005-01-10.
$58,300, same as above.Signed on 2005-09-12. Completion date: 2005-09-12.
$29,993, same as above.Signed on 2005-11-30. Completion date: 2005-11-30.
$29,451, same as above.Signed on 2005-12-23. Completion date: 2005-12-23.
BRYON K PORTER (9823 E AVE; small business) : $501,395 in 7 contractsfrom 2002 to 2003
Contracts for Material Handling Equipment, Nonself-Propelled, Structural Shapes, Nonferrous Base Metal, Locomotive and Rail Car Accessories and Components, Installation of Equipment -- Miscellaneous by Navy, Army Signed by year:2000: $0; 2001: $0; 2002: $463,895; 2003: $37,500; 2004: $0; 2005: $0; 2006: $0.
Biggest contracts:
$195,000 with Navy for Material Handling Equipment, Nonself-Propelled. Signed on 2002-08-06. Completion date: 2002-12-02.
$64,740 with Army for Structural Shapes, Nonferrous Base Metal. Signed on 2002-09-30. Completion date: 2002-11-30.
$57,330 with Navy for Locomotive and Rail Car Accessories and Components. Signed on 2002-06-20. Completion date: 2002-08-01.
$55,860 with Army for Locomotive and Rail Car Accessories and Components. Signed on 2002-09-16. Completion date: 2002-11-18.
CREW CONSTRUCTION & DEV (18745 TEMECULA AVE; small business) : $458,029 in 4 contractsin 2000
$290,000 with Navy for Construction of Structures and Facilities -- Miscellaneous Buildings. Signed on 2000-01-24. Completion date: 2000-08-01.
$126,120 with Navy for Construction of Structures and Facilities -- Sewage and Waste Facilities. Signed on 2000-08-30. Completion date: 2001-01-16.
$31,409 with Navy for Maintenance, Repair or Alteration of Real Property -- Miscellaneous Buildings. Signed on 2000-01-06. Completion date: 2000-01-06.
$10,500, same as above.Signed on 2000-02-01. Completion date: 2000-03-31.
SHED WORLD, INC (6694 CALIENTE RD UNIT A; small business) : $313,139 in 8 contractsfrom 2004 to 2005
Contracts for Building Components, Prefabricated, Miscellaneous Prefabricated Structures, Prefabricated and Portable Buildings, Miscellaneous Items by Army, Navy Signed by year:2000: $0; 2001: $0; 2002: $0; 2003: $0; 2004: $85,957; 2005: $227,182; 2006: $0.
Biggest contracts:
$217,718 with Army for Building Components, Prefabricated. Signed on 2005-08-24. Completion date: 2005-09-05.
$69,535 with Army for Miscellaneous Prefabricated Structures. Signed on 2004-02-18. Completion date: 2004-02-20.
$6,354 with Army for Prefabricated and Portable Buildings. Signed on 2004-08-31. Completion date: 2004-09-20.
$5,581 with Army for Building Components, Prefabricated. Signed on 2005-08-26. Completion date: 2005-10-17.
BARKLEY ANDROSS CORP (17434 BUCKTHORN ST; small business) : $185,694 in 5 contractsfrom 2004 to 2006
Contracts for Telephone and Telegraph Equipment, Communications Security Equipment and Components, Electrical Control Equipment by Army Signed by year:2000: $0; 2001: $0; 2002: $0; 2003: $0; 2004: $171,711; 2005: $10,394; 2006: $3,589.
Biggest contracts:
$89,768 with Army for Telephone and Telegraph Equipment. Signed on 2004-08-20. Completion date: 2004-12-31.
$81,943 with Army for Communications Security Equipment and Components. Signed on 2004-12-30. Completion date: 2005-03-31.
$8,059 with Army for Telephone and Telegraph Equipment. Signed on 2005-09-13. Completion date: 2006-03-31.
$3,589 with Army for Communications Security Equipment and Components. Signed on 2006-03-02. Completion date: 2006-02-23.
HIGH DESERT FLEET SERVICES (16701 CHESTNUT ST STE 1D; small business) : $105,650 in 5 contractsin 2005
Contracts for Optical Sighting and Ranging Equipment, Filters and Networks, Specialized Shipping and Storage Containers, Coil, Flat, Leaf, and Wire Springs by Navy, Air Force Signed by year:2000: $0; 2001: $0; 2002: $0; 2003: $0; 2004: $0; 2005: $105,650; 2006: $0.
Biggest contracts:
$54,975 with Navy for Optical Sighting and Ranging Equipment. Signed on 2005-09-13. Completion date: 2005-12-12.
$17,500 with Navy for Filters and Networks. Signed on 2005-07-11. Completion date: 2005-09-06.
$17,200 with Air Force for Specialized Shipping and Storage Containers. Signed on 2005-09-30. Completion date: 2005-10-31.
$8,600, same as above.Signed on 2005-09-30. Completion date: 2005-10-28.
COMFORT SYSTEMS INC (6694 CALIENTE RD STE C; small business) : $104,164 in 3 contractsfrom 2003 to 2005
$96,123 with American Forces Information Service for Cabinets, Lockers, Bins, and Shelving. Signed on 2003-12-10. Completion date: 2004-03-26.
$6,750 with Navy for Roofing and Siding Materials. Signed on 2005-09-12. Completion date: 2005-09-15.
$1,291 with American Forces Information Service for Cabinets, Lockers, Bins, and Shelving. Signed on 2004-03-11. Completion date: 2004-03-26.
PORTABLEACHER CORP (16755; small business) : $84,080 in 2 contractsin 2001
$55,800 with Navy for Miscellaneous Furniture and Fixtures. Signed on 2001-05-31. Completion date: 2001-07-20.
$28,280, same as above.Signed on 2001-09-13. Completion date: 2001-11-12.
Top industries in this zip code by the number of employees in 2005:
2005 - 2018 National Fire Incident Reporting System (NFIRS) incidents
According to the data from the years 2005 - 2018 the average number of fire incidents per year is 75. The highest number of fires - 240 took place in 2007, and the least - 7 in 2010. The data has a growing trend.
When looking into fire subcategories, the most incidents belonged to: Outside Fires (49.4%), and Structure Fires (29.1%).
Fire incident types reported to NFIRS in Zip Code 92345
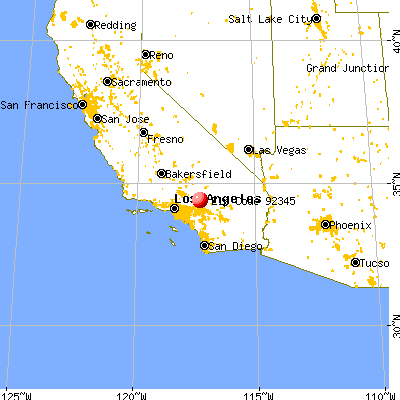


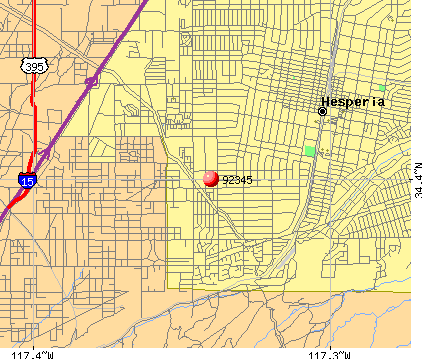 Nearest zip codes: 92344, 92395, 92322, 92325, 92308, 92352.


 According to the data from the years 2005 - 2018 the average number of fire incidents per year is 75. The highest number of fires - 240 took place in 2007, and the least - 7 in 2010. The data has a growing trend.
 When looking into fire subcategories, the most incidents belonged to: Outside Fires (49.4%), and Structure Fires (29.1%).