Hesperia, California Submit your own pictures of this city and show them to the world
OSM Map
General Map
Google Map
MSN Map
OSM Map
General Map
Google Map
MSN Map
OSM Map
General Map
Google Map
MSN Map
OSM Map
General Map
Google Map
MSN Map
Please wait while loading the map...
Population in 2022: 100,744 (99% urban, 1% rural). Population change since 2000: +61.0%Males: 52,470 Females: 48,274
March 2022 cost of living index in Hesperia: 81.7 (low, U.S. average is 100) Percentage of residents living in poverty in 2022: 14.4%for White Non-Hispanic residents , 29.0% for Black residents , 16.8% for Hispanic or Latino residents , 13.5% for American Indian residents , 4.7% for Native Hawaiian and other Pacific Islander residents , 18.3% for other race residents , 19.4% for two or more races residents )
Profiles of local businesses
Business Search - 14 Million verified businesses
Data:
Median household income ($)
Median household income (% change since 2000)
Household income diversity
Ratio of average income to average house value (%)
Ratio of average income to average rent
Median household income ($) - White
Median household income ($) - Black or African American
Median household income ($) - Asian
Median household income ($) - Hispanic or Latino
Median household income ($) - American Indian and Alaska Native
Median household income ($) - Multirace
Median household income ($) - Other Race
Median household income for houses/condos with a mortgage ($)
Median household income for apartments without a mortgage ($)
Races - White alone (%)
Races - White alone (% change since 2000)
Races - Black alone (%)
Races - Black alone (% change since 2000)
Races - American Indian alone (%)
Races - American Indian alone (% change since 2000)
Races - Asian alone (%)
Races - Asian alone (% change since 2000)
Races - Hispanic (%)
Races - Hispanic (% change since 2000)
Races - Native Hawaiian and Other Pacific Islander alone (%)
Races - Native Hawaiian and Other Pacific Islander alone (% change since 2000)
Races - Two or more races (%)
Races - Two or more races (% change since 2000)
Races - Other race alone (%)
Races - Other race alone (% change since 2000)
Racial diversity
Unemployment (%)
Unemployment (% change since 2000)
Unemployment (%) - White
Unemployment (%) - Black or African American
Unemployment (%) - Asian
Unemployment (%) - Hispanic or Latino
Unemployment (%) - American Indian and Alaska Native
Unemployment (%) - Multirace
Unemployment (%) - Other Race
Population density (people per square mile)
Population - Males (%)
Population - Females (%)
Population - Males (%) - White
Population - Males (%) - Black or African American
Population - Males (%) - Asian
Population - Males (%) - Hispanic or Latino
Population - Males (%) - American Indian and Alaska Native
Population - Males (%) - Multirace
Population - Males (%) - Other Race
Population - Females (%) - White
Population - Females (%) - Black or African American
Population - Females (%) - Asian
Population - Females (%) - Hispanic or Latino
Population - Females (%) - American Indian and Alaska Native
Population - Females (%) - Multirace
Population - Females (%) - Other Race
Coronavirus confirmed cases (Apr 26, 2024)
Deaths caused by coronavirus (Apr 26, 2024)
Coronavirus confirmed cases (per 100k population) (Apr 26, 2024)
Deaths caused by coronavirus (per 100k population) (Apr 26, 2024)
Daily increase in number of cases (Apr 26, 2024)
Weekly increase in number of cases (Apr 26, 2024)
Cases doubled (in days) (Apr 26, 2024)
Hospitalized patients (Apr 18, 2022)
Negative test results (Apr 18, 2022)
Total test results (Apr 18, 2022)
COVID Vaccine doses distributed (per 100k population) (Sep 19, 2023)
COVID Vaccine doses administered (per 100k population) (Sep 19, 2023)
COVID Vaccine doses distributed (Sep 19, 2023)
COVID Vaccine doses administered (Sep 19, 2023)
Likely homosexual households (%)
Likely homosexual households (% change since 2000)
Likely homosexual households - Lesbian couples (%)
Likely homosexual households - Lesbian couples (% change since 2000)
Likely homosexual households - Gay men (%)
Likely homosexual households - Gay men (% change since 2000)
Cost of living index
Median gross rent ($)
Median contract rent ($)
Median monthly housing costs ($)
Median house or condo value ($)
Median house or condo value ($ change since 2000)
Mean house or condo value by units in structure - 1, detached ($)
Mean house or condo value by units in structure - 1, attached ($)
Mean house or condo value by units in structure - 2 ($)
Mean house or condo value by units in structure by units in structure - 3 or 4 ($)
Mean house or condo value by units in structure - 5 or more ($)
Mean house or condo value by units in structure - Boat, RV, van, etc. ($)
Mean house or condo value by units in structure - Mobile home ($)
Median house or condo value ($) - White
Median house or condo value ($) - Black or African American
Median house or condo value ($) - Asian
Median house or condo value ($) - Hispanic or Latino
Median house or condo value ($) - American Indian and Alaska Native
Median house or condo value ($) - Multirace
Median house or condo value ($) - Other Race
Median resident age
Resident age diversity
Median resident age - Males
Median resident age - Females
Median resident age - White
Median resident age - Black or African American
Median resident age - Asian
Median resident age - Hispanic or Latino
Median resident age - American Indian and Alaska Native
Median resident age - Multirace
Median resident age - Other Race
Median resident age - Males - White
Median resident age - Males - Black or African American
Median resident age - Males - Asian
Median resident age - Males - Hispanic or Latino
Median resident age - Males - American Indian and Alaska Native
Median resident age - Males - Multirace
Median resident age - Males - Other Race
Median resident age - Females - White
Median resident age - Females - Black or African American
Median resident age - Females - Asian
Median resident age - Females - Hispanic or Latino
Median resident age - Females - American Indian and Alaska Native
Median resident age - Females - Multirace
Median resident age - Females - Other Race
Commute - mean travel time to work (minutes)
Travel time to work - Less than 5 minutes (%)
Travel time to work - Less than 5 minutes (% change since 2000)
Travel time to work - 5 to 9 minutes (%)
Travel time to work - 5 to 9 minutes (% change since 2000)
Travel time to work - 10 to 19 minutes (%)
Travel time to work - 10 to 19 minutes (% change since 2000)
Travel time to work - 20 to 29 minutes (%)
Travel time to work - 20 to 29 minutes (% change since 2000)
Travel time to work - 30 to 39 minutes (%)
Travel time to work - 30 to 39 minutes (% change since 2000)
Travel time to work - 40 to 59 minutes (%)
Travel time to work - 40 to 59 minutes (% change since 2000)
Travel time to work - 60 to 89 minutes (%)
Travel time to work - 60 to 89 minutes (% change since 2000)
Travel time to work - 90 or more minutes (%)
Travel time to work - 90 or more minutes (% change since 2000)
Marital status - Never married (%)
Marital status - Now married (%)
Marital status - Separated (%)
Marital status - Widowed (%)
Marital status - Divorced (%)
Median family income ($)
Median family income (% change since 2000)
Median non-family income ($)
Median non-family income (% change since 2000)
Median per capita income ($)
Median per capita income (% change since 2000)
Median family income ($) - White
Median family income ($) - Black or African American
Median family income ($) - Asian
Median family income ($) - Hispanic or Latino
Median family income ($) - American Indian and Alaska Native
Median family income ($) - Multirace
Median family income ($) - Other Race
Median year house/condo built
Median year apartment built
Year house built - Built 2005 or later (%)
Year house built - Built 2000 to 2004 (%)
Year house built - Built 1990 to 1999 (%)
Year house built - Built 1980 to 1989 (%)
Year house built - Built 1970 to 1979 (%)
Year house built - Built 1960 to 1969 (%)
Year house built - Built 1950 to 1959 (%)
Year house built - Built 1940 to 1949 (%)
Year house built - Built 1939 or earlier (%)
Average household size
Household density (households per square mile)
Average household size - White
Average household size - Black or African American
Average household size - Asian
Average household size - Hispanic or Latino
Average household size - American Indian and Alaska Native
Average household size - Multirace
Average household size - Other Race
Occupied housing units (%)
Vacant housing units (%)
Owner occupied housing units (%)
Renter occupied housing units (%)
Vacancy status - For rent (%)
Vacancy status - For sale only (%)
Vacancy status - Rented or sold, not occupied (%)
Vacancy status - For seasonal, recreational, or occasional use (%)
Vacancy status - For migrant workers (%)
Vacancy status - Other vacant (%)
Residents with income below the poverty level (%)
Residents with income below 50% of the poverty level (%)
Children below poverty level (%)
Poor families by family type - Married-couple family (%)
Poor families by family type - Male, no wife present (%)
Poor families by family type - Female, no husband present (%)
Poverty status for native-born residents (%)
Poverty status for foreign-born residents (%)
Poverty among high school graduates not in families (%)
Poverty among people who did not graduate high school not in families (%)
Residents with income below the poverty level (%) - White
Residents with income below the poverty level (%) - Black or African American
Residents with income below the poverty level (%) - Asian
Residents with income below the poverty level (%) - Hispanic or Latino
Residents with income below the poverty level (%) - American Indian and Alaska Native
Residents with income below the poverty level (%) - Multirace
Residents with income below the poverty level (%) - Other Race
Air pollution - Air Quality Index (AQI)
Air pollution - CO
Air pollution - NO2
Air pollution - SO2
Air pollution - Ozone
Air pollution - PM10
Air pollution - PM25
Air pollution - Pb
Crime - Murders per 100,000 population
Crime - Rapes per 100,000 population
Crime - Robberies per 100,000 population
Crime - Assaults per 100,000 population
Crime - Burglaries per 100,000 population
Crime - Thefts per 100,000 population
Crime - Auto thefts per 100,000 population
Crime - Arson per 100,000 population
Crime - City-data.com crime index
Crime - Violent crime index
Crime - Property crime index
Crime - Murders per 100,000 population (5 year average)
Crime - Rapes per 100,000 population (5 year average)
Crime - Robberies per 100,000 population (5 year average)
Crime - Assaults per 100,000 population (5 year average)
Crime - Burglaries per 100,000 population (5 year average)
Crime - Thefts per 100,000 population (5 year average)
Crime - Auto thefts per 100,000 population (5 year average)
Crime - Arson per 100,000 population (5 year average)
Crime - City-data.com crime index (5 year average)
Crime - Violent crime index (5 year average)
Crime - Property crime index (5 year average)
1996 Presidential Elections Results (%) - Democratic Party (Clinton)
1996 Presidential Elections Results (%) - Republican Party (Dole)
1996 Presidential Elections Results (%) - Other
2000 Presidential Elections Results (%) - Democratic Party (Gore)
2000 Presidential Elections Results (%) - Republican Party (Bush)
2000 Presidential Elections Results (%) - Other
2004 Presidential Elections Results (%) - Democratic Party (Kerry)
2004 Presidential Elections Results (%) - Republican Party (Bush)
2004 Presidential Elections Results (%) - Other
2008 Presidential Elections Results (%) - Democratic Party (Obama)
2008 Presidential Elections Results (%) - Republican Party (McCain)
2008 Presidential Elections Results (%) - Other
2012 Presidential Elections Results (%) - Democratic Party (Obama)
2012 Presidential Elections Results (%) - Republican Party (Romney)
2012 Presidential Elections Results (%) - Other
2016 Presidential Elections Results (%) - Democratic Party (Clinton)
2016 Presidential Elections Results (%) - Republican Party (Trump)
2016 Presidential Elections Results (%) - Other
2020 Presidential Elections Results (%) - Democratic Party (Biden)
2020 Presidential Elections Results (%) - Republican Party (Trump)
2020 Presidential Elections Results (%) - Other
Ancestries Reported - Arab (%)
Ancestries Reported - Czech (%)
Ancestries Reported - Danish (%)
Ancestries Reported - Dutch (%)
Ancestries Reported - English (%)
Ancestries Reported - French (%)
Ancestries Reported - French Canadian (%)
Ancestries Reported - German (%)
Ancestries Reported - Greek (%)
Ancestries Reported - Hungarian (%)
Ancestries Reported - Irish (%)
Ancestries Reported - Italian (%)
Ancestries Reported - Lithuanian (%)
Ancestries Reported - Norwegian (%)
Ancestries Reported - Polish (%)
Ancestries Reported - Portuguese (%)
Ancestries Reported - Russian (%)
Ancestries Reported - Scotch-Irish (%)
Ancestries Reported - Scottish (%)
Ancestries Reported - Slovak (%)
Ancestries Reported - Subsaharan African (%)
Ancestries Reported - Swedish (%)
Ancestries Reported - Swiss (%)
Ancestries Reported - Ukrainian (%)
Ancestries Reported - United States (%)
Ancestries Reported - Welsh (%)
Ancestries Reported - West Indian (%)
Ancestries Reported - Other (%)
Educational Attainment - No schooling completed (%)
Educational Attainment - Less than high school (%)
Educational Attainment - High school or equivalent (%)
Educational Attainment - Less than 1 year of college (%)
Educational Attainment - 1 or more years of college (%)
Educational Attainment - Associate degree (%)
Educational Attainment - Bachelor's degree (%)
Educational Attainment - Master's degree (%)
Educational Attainment - Professional school degree (%)
Educational Attainment - Doctorate degree (%)
School Enrollment - Nursery, preschool (%)
School Enrollment - Kindergarten (%)
School Enrollment - Grade 1 to 4 (%)
School Enrollment - Grade 5 to 8 (%)
School Enrollment - Grade 9 to 12 (%)
School Enrollment - College undergrad (%)
School Enrollment - Graduate or professional (%)
School Enrollment - Not enrolled in school (%)
School enrollment - Public schools (%)
School enrollment - Private schools (%)
School enrollment - Not enrolled (%)
Median number of rooms in houses and condos
Median number of rooms in apartments
Housing units lacking complete plumbing facilities (%)
Housing units lacking complete kitchen facilities (%)
Density of houses
Urban houses (%)
Rural houses (%)
Households with people 60 years and over (%)
Households with people 65 years and over (%)
Households with people 75 years and over (%)
Households with one or more nonrelatives (%)
Households with no nonrelatives (%)
Population in households (%)
Family households (%)
Nonfamily households (%)
Population in families (%)
Family households with own children (%)
Median number of bedrooms in owner occupied houses
Mean number of bedrooms in owner occupied houses
Median number of bedrooms in renter occupied houses
Mean number of bedrooms in renter occupied houses
Median number of vehichles in owner occupied houses
Mean number of vehichles in owner occupied houses
Median number of vehichles in renter occupied houses
Mean number of vehichles in renter occupied houses
Mortgage status - with mortgage (%)
Mortgage status - with second mortgage (%)
Mortgage status - with home equity loan (%)
Mortgage status - with both second mortgage and home equity loan (%)
Mortgage status - without a mortgage (%)
Average family size
Average family size - White
Average family size - Black or African American
Average family size - Asian
Average family size - Hispanic or Latino
Average family size - American Indian and Alaska Native
Average family size - Multirace
Average family size - Other Race
Geographical mobility - Same house 1 year ago (%)
Geographical mobility - Moved within same county (%)
Geographical mobility - Moved from different county within same state (%)
Geographical mobility - Moved from different state (%)
Geographical mobility - Moved from abroad (%)
Place of birth - Born in state of residence (%)
Place of birth - Born in other state (%)
Place of birth - Native, outside of US (%)
Place of birth - Foreign born (%)
Housing units in structures - 1, detached (%)
Housing units in structures - 1, attached (%)
Housing units in structures - 2 (%)
Housing units in structures - 3 or 4 (%)
Housing units in structures - 5 to 9 (%)
Housing units in structures - 10 to 19 (%)
Housing units in structures - 20 to 49 (%)
Housing units in structures - 50 or more (%)
Housing units in structures - Mobile home (%)
Housing units in structures - Boat, RV, van, etc. (%)
House/condo owner moved in on average (years ago)
Renter moved in on average (years ago)
Year householder moved into unit - Moved in 1999 to March 2000 (%)
Year householder moved into unit - Moved in 1995 to 1998 (%)
Year householder moved into unit - Moved in 1990 to 1994 (%)
Year householder moved into unit - Moved in 1980 to 1989 (%)
Year householder moved into unit - Moved in 1970 to 1979 (%)
Year householder moved into unit - Moved in 1969 or earlier (%)
Means of transportation to work - Drove car alone (%)
Means of transportation to work - Carpooled (%)
Means of transportation to work - Public transportation (%)
Means of transportation to work - Bus or trolley bus (%)
Means of transportation to work - Streetcar or trolley car (%)
Means of transportation to work - Subway or elevated (%)
Means of transportation to work - Railroad (%)
Means of transportation to work - Ferryboat (%)
Means of transportation to work - Taxicab (%)
Means of transportation to work - Motorcycle (%)
Means of transportation to work - Bicycle (%)
Means of transportation to work - Walked (%)
Means of transportation to work - Other means (%)
Working at home (%)
Industry diversity
Most Common Industries - Agriculture, forestry, fishing and hunting, and mining (%)
Most Common Industries - Agriculture, forestry, fishing and hunting (%)
Most Common Industries - Mining, quarrying, and oil and gas extraction (%)
Most Common Industries - Construction (%)
Most Common Industries - Manufacturing (%)
Most Common Industries - Wholesale trade (%)
Most Common Industries - Retail trade (%)
Most Common Industries - Transportation and warehousing, and utilities (%)
Most Common Industries - Transportation and warehousing (%)
Most Common Industries - Utilities (%)
Most Common Industries - Information (%)
Most Common Industries - Finance and insurance, and real estate and rental and leasing (%)
Most Common Industries - Finance and insurance (%)
Most Common Industries - Real estate and rental and leasing (%)
Most Common Industries - Professional, scientific, and management, and administrative and waste management services (%)
Most Common Industries - Professional, scientific, and technical services (%)
Most Common Industries - Management of companies and enterprises (%)
Most Common Industries - Administrative and support and waste management services (%)
Most Common Industries - Educational services, and health care and social assistance (%)
Most Common Industries - Educational services (%)
Most Common Industries - Health care and social assistance (%)
Most Common Industries - Arts, entertainment, and recreation, and accommodation and food services (%)
Most Common Industries - Arts, entertainment, and recreation (%)
Most Common Industries - Accommodation and food services (%)
Most Common Industries - Other services, except public administration (%)
Most Common Industries - Public administration (%)
Occupation diversity
Most Common Occupations - Management, business, science, and arts occupations (%)
Most Common Occupations - Management, business, and financial occupations (%)
Most Common Occupations - Management occupations (%)
Most Common Occupations - Business and financial operations occupations (%)
Most Common Occupations - Computer, engineering, and science occupations (%)
Most Common Occupations - Computer and mathematical occupations (%)
Most Common Occupations - Architecture and engineering occupations (%)
Most Common Occupations - Life, physical, and social science occupations (%)
Most Common Occupations - Education, legal, community service, arts, and media occupations (%)
Most Common Occupations - Community and social service occupations (%)
Most Common Occupations - Legal occupations (%)
Most Common Occupations - Education, training, and library occupations (%)
Most Common Occupations - Arts, design, entertainment, sports, and media occupations (%)
Most Common Occupations - Healthcare practitioners and technical occupations (%)
Most Common Occupations - Health diagnosing and treating practitioners and other technical occupations (%)
Most Common Occupations - Health technologists and technicians (%)
Most Common Occupations - Service occupations (%)
Most Common Occupations - Healthcare support occupations (%)
Most Common Occupations - Protective service occupations (%)
Most Common Occupations - Fire fighting and prevention, and other protective service workers including supervisors (%)
Most Common Occupations - Law enforcement workers including supervisors (%)
Most Common Occupations - Food preparation and serving related occupations (%)
Most Common Occupations - Building and grounds cleaning and maintenance occupations (%)
Most Common Occupations - Personal care and service occupations (%)
Most Common Occupations - Sales and office occupations (%)
Most Common Occupations - Sales and related occupations (%)
Most Common Occupations - Office and administrative support occupations (%)
Most Common Occupations - Natural resources, construction, and maintenance occupations (%)
Most Common Occupations - Farming, fishing, and forestry occupations (%)
Most Common Occupations - Construction and extraction occupations (%)
Most Common Occupations - Installation, maintenance, and repair occupations (%)
Most Common Occupations - Production, transportation, and material moving occupations (%)
Most Common Occupations - Production occupations (%)
Most Common Occupations - Transportation occupations (%)
Most Common Occupations - Material moving occupations (%)
People in Group quarters - Institutionalized population (%)
People in Group quarters - Correctional institutions (%)
People in Group quarters - Federal prisons and detention centers (%)
People in Group quarters - Halfway houses (%)
People in Group quarters - Local jails and other confinement facilities (including police lockups) (%)
People in Group quarters - Military disciplinary barracks (%)
People in Group quarters - State prisons (%)
People in Group quarters - Other types of correctional institutions (%)
People in Group quarters - Nursing homes (%)
People in Group quarters - Hospitals/wards, hospices, and schools for the handicapped (%)
People in Group quarters - Hospitals/wards and hospices for chronically ill (%)
People in Group quarters - Hospices or homes for chronically ill (%)
People in Group quarters - Military hospitals or wards for chronically ill (%)
People in Group quarters - Other hospitals or wards for chronically ill (%)
People in Group quarters - Hospitals or wards for drug/alcohol abuse (%)
People in Group quarters - Mental (Psychiatric) hospitals or wards (%)
People in Group quarters - Schools, hospitals, or wards for the mentally retarded (%)
People in Group quarters - Schools, hospitals, or wards for the physically handicapped (%)
People in Group quarters - Institutions for the deaf (%)
People in Group quarters - Institutions for the blind (%)
People in Group quarters - Orthopedic wards and institutions for the physically handicapped (%)
People in Group quarters - Wards in general hospitals for patients who have no usual home elsewhere (%)
People in Group quarters - Wards in military hospitals for patients who have no usual home elsewhere (%)
People in Group quarters - Juvenile institutions (%)
People in Group quarters - Long-term care (%)
People in Group quarters - Homes for abused, dependent, and neglected children (%)
People in Group quarters - Residential treatment centers for emotionally disturbed children (%)
People in Group quarters - Training schools for juvenile delinquents (%)
People in Group quarters - Short-term care, detention or diagnostic centers for delinquent children (%)
People in Group quarters - Type of juvenile institution unknown (%)
People in Group quarters - Noninstitutionalized population (%)
People in Group quarters - College dormitories (includes college quarters off campus) (%)
People in Group quarters - Military quarters (%)
People in Group quarters - On base (%)
People in Group quarters - Barracks, unaccompanied personnel housing (UPH), (Enlisted/Officer), ;and similar group living quarters for military personnel (%)
People in Group quarters - Transient quarters for temporary residents (%)
People in Group quarters - Military ships (%)
People in Group quarters - Group homes (%)
People in Group quarters - Homes or halfway houses for drug/alcohol abuse (%)
People in Group quarters - Homes for the mentally ill (%)
People in Group quarters - Homes for the mentally retarded (%)
People in Group quarters - Homes for the physically handicapped (%)
People in Group quarters - Other group homes (%)
People in Group quarters - Religious group quarters (%)
People in Group quarters - Dormitories (%)
People in Group quarters - Agriculture workers' dormitories on farms (%)
People in Group quarters - Job Corps and vocational training facilities (%)
People in Group quarters - Other workers' dormitories (%)
People in Group quarters - Crews of maritime vessels (%)
People in Group quarters - Other nonhousehold living situations (%)
People in Group quarters - Other noninstitutional group quarters (%)
Residents speaking English at home (%)
Residents speaking English at home - Born in the United States (%)
Residents speaking English at home - Native, born elsewhere (%)
Residents speaking English at home - Foreign born (%)
Residents speaking Spanish at home (%)
Residents speaking Spanish at home - Born in the United States (%)
Residents speaking Spanish at home - Native, born elsewhere (%)
Residents speaking Spanish at home - Foreign born (%)
Residents speaking other language at home (%)
Residents speaking other language at home - Born in the United States (%)
Residents speaking other language at home - Native, born elsewhere (%)
Residents speaking other language at home - Foreign born (%)
Class of Workers - Employee of private company (%)
Class of Workers - Self-employed in own incorporated business (%)
Class of Workers - Private not-for-profit wage and salary workers (%)
Class of Workers - Local government workers (%)
Class of Workers - State government workers (%)
Class of Workers - Federal government workers (%)
Class of Workers - Self-employed workers in own not incorporated business and Unpaid family workers (%)
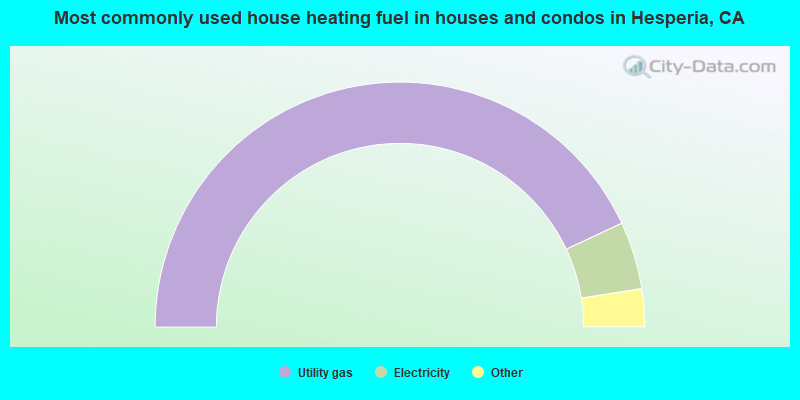
House heating fuel used in houses and condos - Utility gas (%)
House heating fuel used in houses and condos - Bottled, tank, or LP gas (%)
House heating fuel used in houses and condos - Electricity (%)
House heating fuel used in houses and condos - Fuel oil, kerosene, etc. (%)
House heating fuel used in houses and condos - Coal or coke (%)
House heating fuel used in houses and condos - Wood (%)
House heating fuel used in houses and condos - Solar energy (%)
House heating fuel used in houses and condos - Other fuel (%)
House heating fuel used in houses and condos - No fuel used (%)
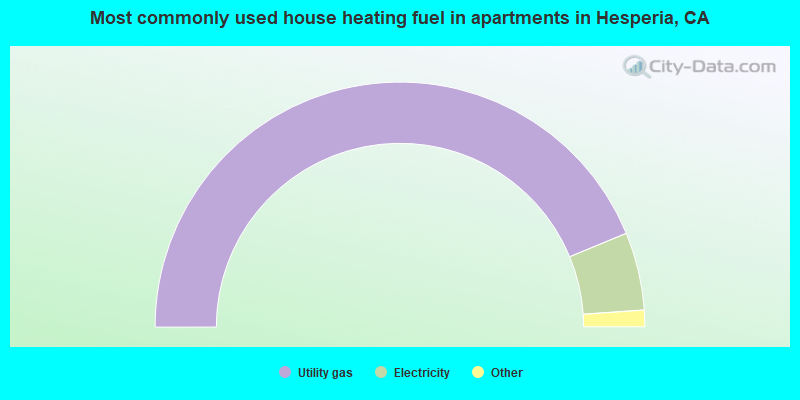
House heating fuel used in apartments - Utility gas (%)
House heating fuel used in apartments - Bottled, tank, or LP gas (%)
House heating fuel used in apartments - Electricity (%)
House heating fuel used in apartments - Fuel oil, kerosene, etc. (%)
House heating fuel used in apartments - Coal or coke (%)
House heating fuel used in apartments - Wood (%)
House heating fuel used in apartments - Solar energy (%)
House heating fuel used in apartments - Other fuel (%)
House heating fuel used in apartments - No fuel used (%)
Armed forces status - In Armed Forces (%)
Armed forces status - Civilian (%)
Armed forces status - Civilian - Veteran (%)
Armed forces status - Civilian - Nonveteran (%)
Fatal accidents locations in years 2005-2021
Fatal accidents locations in 2005
Fatal accidents locations in 2006
Fatal accidents locations in 2007
Fatal accidents locations in 2008
Fatal accidents locations in 2009
Fatal accidents locations in 2010
Fatal accidents locations in 2011
Fatal accidents locations in 2012
Fatal accidents locations in 2013
Fatal accidents locations in 2014
Fatal accidents locations in 2015
Fatal accidents locations in 2016
Fatal accidents locations in 2017
Fatal accidents locations in 2018
Fatal accidents locations in 2019
Fatal accidents locations in 2020
Fatal accidents locations in 2021
Alcohol use - People drinking some alcohol every month (%)
Alcohol use - People not drinking at all (%)
Alcohol use - Average days/month drinking alcohol
Alcohol use - Average drinks/week
Alcohol use - Average days/year people drink much
Audiometry - Average condition of hearing (%)
Audiometry - People that can hear a whisper from across a quiet room (%)
Audiometry - People that can hear normal voice from across a quiet room (%)
Audiometry - Ears ringing, roaring, buzzing (%)
Audiometry - Had a job exposure to loud noise (%)
Audiometry - Had off-work exposure to loud noise (%)
Blood Pressure & Cholesterol - Has high blood pressure (%)
Blood Pressure & Cholesterol - Checking blood pressure at home (%)
Blood Pressure & Cholesterol - Frequently checking blood cholesterol (%)
Blood Pressure & Cholesterol - Has high cholesterol level (%)
Consumer Behavior - Money monthly spent on food at supermarket/grocery store
Consumer Behavior - Money monthly spent on food at other stores
Consumer Behavior - Money monthly spent on eating out
Consumer Behavior - Money monthly spent on carryout/delivered foods
Consumer Behavior - Income spent on food at supermarket/grocery store (%)
Consumer Behavior - Income spent on food at other stores (%)
Consumer Behavior - Income spent on eating out (%)
Consumer Behavior - Income spent on carryout/delivered foods (%)
Current Health Status - General health condition (%)
Current Health Status - Blood donors (%)
Current Health Status - Has blood ever tested for HIV virus (%)
Current Health Status - Left-handed people (%)
Dermatology - People using sunscreen (%)
Diabetes - Diabetics (%)
Diabetes - Had a blood test for high blood sugar (%)
Diabetes - People taking insulin (%)
Diet Behavior & Nutrition - Diet health (%)
Diet Behavior & Nutrition - Milk product consumption (# of products/month)
Diet Behavior & Nutrition - Meals not home prepared (#/week)
Diet Behavior & Nutrition - Meals from fast food or pizza place (#/week)
Diet Behavior & Nutrition - Ready-to-eat foods (#/month)
Diet Behavior & Nutrition - Frozen meals/pizza (#/month)
Drug Use - People that ever used marijuana or hashish (%)
Drug Use - Ever used hard drugs (%)
Drug Use - Ever used any form of cocaine (%)
Drug Use - Ever used heroin (%)
Drug Use - Ever used methamphetamine (%)
Health Insurance - People covered by health insurance (%)
Kidney Conditions-Urology - Avg. # of times urinating at night
Medical Conditions - People with asthma (%)
Medical Conditions - People with anemia (%)
Medical Conditions - People with psoriasis (%)
Medical Conditions - People with overweight (%)
Medical Conditions - Elderly people having difficulties in thinking or remembering (%)
Medical Conditions - People who ever received blood transfusion (%)
Medical Conditions - People having trouble seeing even with glass/contacts (%)
Medical Conditions - People with arthritis (%)
Medical Conditions - People with gout (%)
Medical Conditions - People with congestive heart failure (%)
Medical Conditions - People with coronary heart disease (%)
Medical Conditions - People with angina pectoris (%)
Medical Conditions - People who ever had heart attack (%)
Medical Conditions - People who ever had stroke (%)
Medical Conditions - People with emphysema (%)
Medical Conditions - People with thyroid problem (%)
Medical Conditions - People with chronic bronchitis (%)
Medical Conditions - People with any liver condition (%)
Medical Conditions - People who ever had cancer or malignancy (%)
Mental Health - People who have little interest in doing things (%)
Mental Health - People feeling down, depressed, or hopeless (%)
Mental Health - People who have trouble sleeping or sleeping too much (%)
Mental Health - People feeling tired or having little energy (%)
Mental Health - People with poor appetite or overeating (%)
Mental Health - People feeling bad about themself (%)
Mental Health - People who have trouble concentrating on things (%)
Mental Health - People moving or speaking slowly or too fast (%)
Mental Health - People having thoughts they would be better off dead (%)
Oral Health - Average years since last visit a dentist
Oral Health - People embarrassed because of mouth (%)
Oral Health - People with gum disease (%)
Oral Health - General health of teeth and gums (%)
Oral Health - Average days a week using dental floss/device
Oral Health - Average days a week using mouthwash for dental problem
Oral Health - Average number of teeth
Pesticide Use - Households using pesticides to control insects (%)
Pesticide Use - Households using pesticides to kill weeds (%)
Physical Activity - People doing vigorous-intensity work activities (%)
Physical Activity - People doing moderate-intensity work activities (%)
Physical Activity - People walking or bicycling (%)
Physical Activity - People doing vigorous-intensity recreational activities (%)
Physical Activity - People doing moderate-intensity recreational activities (%)
Physical Activity - Average hours a day doing sedentary activities
Physical Activity - Average hours a day watching TV or videos
Physical Activity - Average hours a day using computer
Physical Functioning - People having limitations keeping them from working (%)
Physical Functioning - People limited in amount of work they can do (%)
Physical Functioning - People that need special equipment to walk (%)
Physical Functioning - People experiencing confusion/memory problems (%)
Physical Functioning - People requiring special healthcare equipment (%)
Prescription Medications - Average number of prescription medicines taking
Preventive Aspirin Use - Adults 40+ taking low-dose aspirin (%)
Reproductive Health - Vaginal deliveries (%)
Reproductive Health - Cesarean deliveries (%)
Reproductive Health - Deliveries resulted in a live birth (%)
Reproductive Health - Pregnancies resulted in a delivery (%)
Reproductive Health - Women breastfeeding newborns (%)
Reproductive Health - Women that had a hysterectomy (%)
Reproductive Health - Women that had both ovaries removed (%)
Reproductive Health - Women that have ever taken birth control pills (%)
Reproductive Health - Women taking birth control pills (%)
Reproductive Health - Women that have ever used Depo-Provera or injectables (%)
Reproductive Health - Women that have ever used female hormones (%)
Sexual Behavior - People 18+ that ever had sex (vaginal, anal, or oral) (%)
Sexual Behavior - Males 18+ that ever had vaginal sex with a woman (%)
Sexual Behavior - Males 18+ that ever performed oral sex on a woman (%)
Sexual Behavior - Males 18+ that ever had anal sex with a woman (%)
Sexual Behavior - Males 18+ that ever had any sex with a man (%)
Sexual Behavior - Females 18+ that ever had vaginal sex with a man (%)
Sexual Behavior - Females 18+ that ever performed oral sex on a man (%)
Sexual Behavior - Females 18+ that ever had anal sex with a man (%)
Sexual Behavior - Females 18+ that ever had any kind of sex with a woman (%)
Sexual Behavior - Average age people first had sex
Sexual Behavior - Average number of female sex partners in lifetime (males 18+)
Sexual Behavior - Average number of female vaginal sex partners in lifetime (males 18+)
Sexual Behavior - Average age people first performed oral sex on a woman (18+)
Sexual Behavior - Average number of woman performed oral sex on in lifetime (18+)
Sexual Behavior - Average number of male sex partners in lifetime (males 18+)
Sexual Behavior - Average number of male anal sex partners in lifetime (males 18+)
Sexual Behavior - Average age people first performed oral sex on a man (18+)
Sexual Behavior - Average number of male oral sex partners in lifetime (18+)
Sexual Behavior - People using protection when performing oral sex (%)
Sexual Behavior - Average number of times people have vaginal or anal sex a year
Sexual Behavior - People having sex without condom (%)
Sexual Behavior - Average number of male sex partners in lifetime (females 18+)
Sexual Behavior - Average number of male vaginal sex partners in lifetime (females 18+)
Sexual Behavior - Average number of female sex partners in lifetime (females 18+)
Sexual Behavior - Circumcised males 18+ (%)
Sleep Disorders - Average hours sleeping at night
Sleep Disorders - People that has trouble sleeping (%)
Smoking-Cigarette Use - People smoking cigarettes (%)
Taste & Smell - People 40+ having problems with smell (%)
Taste & Smell - People 40+ having problems with taste (%)
Taste & Smell - People 40+ that ever had wisdom teeth removed (%)
Taste & Smell - People 40+ that ever had tonsils teeth removed (%)
Taste & Smell - People 40+ that ever had a loss of consciousness because of a head injury (%)
Taste & Smell - People 40+ that ever had a broken nose or other serious injury to face or skull (%)
Taste & Smell - People 40+ that ever had two or more sinus infections (%)
Weight - Average height (inches)
Weight - Average weight (pounds)
Weight - Average BMI
Weight - People that are obese (%)
Weight - People that ever were obese (%)
Weight - People trying to lose weight (%)
68,438 67.9% Hispanic 21,832 21.7% White alone 4,429 4.4% Black alone 4,182 4.2% Two or more races 958 1.0% Other race alone 895 0.9% Asian alone 32 0.03% American Indian alone
The City-Data.com crime index weighs serious crimes and violent crimes more heavily. Higher means more crime, U.S. average is 246.1. It adjusts for the number of visitors and daily workers commuting into cities.
- means the value is smaller than the state average.
- means the value is about the same as the state average.
- means the value is bigger than the state average.
- means the value is much bigger than the state average.
Crime rate in Hesperia detailed stats: murders, rapes, robberies, assaults, burglaries, thefts, arson Officers per 1,000 residents here:
0.01California average:
1.98
Latest news from Hesperia, CA collected exclusively by city-data.com from local newspapers, TV, and radio stations
Ancestries: German (3.1%), Irish (3.0%), American (2.0%), Italian (1.7%), European (1.5%), English (1.5%).
Current Local Time:
Land area: 67.3 square miles.
Population density: 1,496 people per square mile (low).
17,555 residents are foreign born (15.5% Latin America ).
This city:
17.5%California:
26.5%
Median real estate property taxes paid for housing units with mortgages in 2022: $2,666 (0.6%)Median real estate property taxes paid for housing units with no mortgage in 2022: $2,188 (0.6%)
Nearest city with pop. 200,000+: Riverside, CA
Nearest city with pop. 1,000,000+: Los Angeles, CA
Nearest cities:
Latitude: 34.41 N, Longitude: 117.31 W
Daytime population change due to commuting: -14,932 (-14.8%)Workers who live and work in this city: 10,906 (29.0%)
Area code commonly used in this area: 909
Property values in Hesperia, CA
Hesperia tourist attractions:
Single-family new house construction building permits:
2022: 276 buildings , average cost: $221,7002021: 245 buildings , average cost: $157,2002020: 172 buildings , average cost: $214,7002019: 200 buildings , average cost: $207,5002018: 249 buildings , average cost: $174,7002017: 232 buildings , average cost: $216,1002016: 137 buildings , average cost: $219,1002015: 100 buildings , average cost: $186,3002014: 75 buildings , average cost: $206,4002013: 18 buildings , average cost: $197,4002010: 2 buildings , average cost: $289,1002009: 2 buildings , average cost: $92,0002008: 189 buildings , average cost: $138,7002007: 326 buildings , average cost: $231,8002006: 1051 buildings , average cost: $230,8002005: 1760 buildings , average cost: $231,4002004: 1478 buildings , average cost: $216,2002003: 1034 buildings , average cost: $152,4002002: 463 buildings , average cost: $142,9002001: 539 buildings , average cost: $130,7002000: 210 buildings , average cost: $130,3001999: 212 buildings , average cost: $119,3001998: 188 buildings , average cost: $109,3001997: 216 buildings , average cost: $107,800Unemployment in December 2023: Population change in the 1990s: +11,052 (+21.4%).
Most common occupations in Hesperia, CA (%)
Both Males Females
Driver/sales workers and truck drivers (6.2%)
Electrical equipment mechanics and other installation, maintenance, and repair workers, including supervisors (4.3%)
Other production occupations, including supervisors (4.2%)
Other sales and related occupations, including supervisors (4.2%)
Vehicle and mobile equipment mechanics, installers, and repairers (3.7%)
Material recording, scheduling, dispatching, and distributing workers (3.2%)
Cashiers (3.2%)
Driver/sales workers and truck drivers (10.2%)
Electrical equipment mechanics and other installation, maintenance, and repair workers, including supervisors (7.1%)
Vehicle and mobile equipment mechanics, installers, and repairers (6.3%)
Other production occupations, including supervisors (6.2%)
Construction traders workers except carpenters, electricians, painters, plumbers, and construction laborers (4.1%)
Metal workers and plastic workers (3.9%)
Building and grounds cleaning and maintenance occupations (3.7%)
Cashiers (6.3%)
Other office and administrative support workers, including supervisors (5.8%)
Secretaries and administrative assistants (5.6%)
Other sales and related occupations, including supervisors (5.6%)
Information and record clerks, except customer service representatives (4.9%)
Preschool, kindergarten, elementary, and middle school teachers (4.9%)
Retail sales workers, except cashiers (4.2%)
Earthquake activity:
Hesperia-area historical earthquake activity is significantly above California state average. It is 7530% greater than the overall U.S. average. On 6/28/1992 at 11:57:34, a magnitude 7.6 (6.2 MB, 7.6 MS, 7.3 MW, Depth: 0.7 mi, Class: Major, Intensity: VIII - XII) earthquake occurred 47.0 miles away from the city center, causing 3 deaths ( 1 shaking deaths, 2 other deaths) and 400 injuries, causing $100,000,000 total damage and $40,000,000 insured lossesOn 7/21/1952 at 11:52:14, a magnitude 7.7 (7.7 UK) earthquake occurred 104.5 miles away from the city center, causing $50,000,000 total damage On 10/16/1999 at 09:46:44, a magnitude 7.4 (6.3 MB, 7.4 MS, 7.2 MW, 7.3 ML) earthquake occurred 50.2 miles away from Hesperia center On 6/28/1992 at 15:05:30, a magnitude 6.9 (6.3 MB, 6.7 MS, 6.5 MW, 6.9 ME, Depth: 3.1 mi, Class: Strong, Intensity: VII - IX) earthquake occurred 29.2 miles away from Hesperia center On 5/19/1940 at 04:36:40, a magnitude 7.2 (7.2 UK) earthquake occurred 123.8 miles away from Hesperia center, causing $33,000,000 total damage On 4/21/1918 at 22:32:30, a magnitude 6.8 (6.8 UK) earthquake occurred 42.3 miles away from the city center Magnitude types: body-wave magnitude (MB), energy magnitude (ME), local magnitude (ML), surface-wave magnitude (MS), moment magnitude (MW) Natural disasters: The number of natural disasters in San Bernardino County (46) is a lot greater than the US average (15).Major Disasters (Presidential) Declared: 27Emergencies Declared: 2Fires: 24, Floods: 18, Storms: 9, Winter Storms: 6, Landslides: 5, Mudslides: 4, Heavy Rains: 2, Earthquake: 1, Flash Flood: 1, Freeze: 1, Hurricane: 1, Snow: 1, Tornado: 1, Tropical Storm: 1, Wind: 1, Other: 1 (Note: some incidents may be assigned to more than one category). Hospitals and medical centers in Hesperia: DESERT VALLEY HOME HEALTH HOSPICE (11910 HESPERIA RD SUITE 1 AND 2) HESPERIA DIALYSIS CENTER (14135 MAIN STREET, SUITE 501)
Other hospitals and medical centers near Hesperia: DESERT VALLEY HOSPITAL (about 5 miles away; VICTORVILLE, CA)
UNITED HEALTH GROUP (Home Health Center, about 5 miles away; VICTORVILLE, CA)
DESERT CITIES DIALYSIS (Dialysis Facility, about 5 miles away; VICTORVILLE, CA)
APPLE VALLEY CARE CENTER (Nursing Home, about 6 miles away; APPLE VALLEY, CA)
KNOLLS WEST CONVALESCENT HOSPITAL (Nursing Home, about 7 miles away; VICTORVILLE, CA)
VICTORVILLE HOME HEALTH AGENCY SERVICES, LLC (Home Health Center, about 7 miles away; VICTORVILLE, CA)
HIGH DESERT HAVEN (Hospital, about 8 miles away; APPLE VALLEY, CA)
Amtrak station near Hesperia: 9 miles: VICTORVILLE (16858 D ST.) Services: fully wheelchair accessible, public payphones, free short-term parking, taxi stand, intercity bus service.
College/University in Hesperia: San Joaquin Valley College-Hesperia Full-time enrollment: 874; Location: 9331 Mariposa Rd; Private, for-profit; Website: www.sjvc.edu)
Colleges/universities with over 2000 students nearest to Hesperia:
Victor Valley College (about 5 miles; Victorville, CA ; Full-time enrollment: 7,630)
California State University-San Bernardino (about 16 miles; San Bernardino, CA ; FT enrollment: 15,748)
San Bernardino Valley College (about 23 miles; San Bernardino, CA ; FT enrollment: 7,444)
The Art Institute of California-Argosy University Inland Empire (about 24 miles; San Bernardino, CA ; FT enrollment: 2,238)
Chaffey College (about 24 miles; Rancho Cucamonga, CA ; FT enrollment: 10,496)
Loma Linda University (about 26 miles; Loma Linda, CA ; FT enrollment: 2,839)
University of Redlands (about 26 miles; Redlands, CA ; FT enrollment: 4,854)
Biggest public high schools in Hesperia: HESPERIA HIGH Students: 2,383, Location: 9898 MAPLE AVE., Grades: 9-12)SULTANA HIGH Students: 1,696, Location: 17311 SULTANA AVE., Grades: 9-12)ENCORE JR./SR. HIGH SCH FOR THE PERF AND VISUAL AR Students: 393, Location: 16955 LEMON ST., Grades: 7-12, Charter school )SUMMIT LEADERSHIP ACADEMY-HIGH DESERT Students: 122, Location: 12850 MUSCATEL ST., Grades: 9-12, Charter school )MOJAVE HIGH Students: 93, Location: 16633 LEMON, Grades: 9-12)SHADOW RIDGE Students: 63, Location: 12850 MUSCATEL ST., Grades: KG-12)CANYON RIDGE HIGH Students: 54, Location: 12850 MUSCATEL AVE., Grades: 9-12)HESPERIA COMMUNITY DAY Students: 19, Location: 16527 1/2 LEMON ST., Grades: 7-12)MIRUS SECONDARY Location: 14073 MAIN ST., STE. 103, Grades: 7-12, Charter school )
ALTA VISTA PUBLIC Location: 11988 HESPERIA RD., STE. B, Grades: KG-12, Charter school )
Private high schools in Hesperia: HESPERIA CHRISTIAN SCHOOL Students: 296, Location: 16775 OLIVE ST, Grades: PK-12)
MOUNTAIN VIEW SCHOOL Students: 28, Location: 8500 ESCONDIDO AVE, Grades: 4-12)
Biggest public elementary/middle schools in Hesperia: CEDAR MIDDLE Students: 1,021, Location: 13565 CEDAR ST., Grades: 7-8)RANCHERO MIDDLE Students: 1,013, Location: 17607 RANCHERO RD., Grades: 7-8)HESPERIA JUNIOR HIGH Students: 975, Location: 10275 CYPRESS, Grades: 7-8)MISSION CREST ELEMENTARY Students: 569, Location: 13065 MUSCATEL ST., Grades: KG-6)CARMEL ELEMENTARY Students: 560, Location: 9321 GLENDALE AVE., Grades: KG-6)KINGSTON ELEMENTARY Students: 558, Location: 7473 KINGSTON AVE., Grades: KG-6)COTTONWOOD ELEMENTARY Students: 553, Location: 8850 COTTONWOOD, Grades: KG-6)MESQUITE TRAILS ELEMENTARY Students: 542, Location: 13884 MESQUITE, Grades: KG-6)JOSHUA CIRCLE ELEMENTARY Students: 515, Location: 10140 EIGHTH AVE., Grades: KG-6)CYPRESS SCHOOL OF THE ARTS Students: 487, Location: 10365 CYPRESS, Grades: KG-6)Private elementary/middle school in Hesperia: NEW LIFE CHRISTIAN ACADEMY Students: 73, Location: 15975 HERCULES ST, Grades: PK-6)
See full list of schools located in Hesperia User-submitted facts and corrections:
Web address for Kingston Elementary School: http://www.hesperia.org/kingston
Notable locations in Hesperia: (A) , Rancho Linda Vista Equestrian Center (B) , Hesperia Golf and Country Club (C) , Herrington Ranch (D) , San Bernardino County Fire Department Station 305 Hesperia (E) , San Bernardino County Fire Department Station 301 Hesperia (F) , San Bernardino County Fire Department Station 303 Hesperia (G) , San Bernardino County Fire Department Station 304 Hesperia (H) , San Bernardino County Fire Department Station 302 Hesperia (I) , Leisure League Senior Center (J) , Hesperia City Hall (K) , Hesperia Branch San Bernardino County Library (L) . Display/hide their locations on the map
Shopping Centers: (1) , Hesperia Town Center Shopping Center (2) , Hesperia Square Shopping Center (3) , Hesperia Marketplace Shopping Center (4) . Display/hide their locations on the map
Churches in Hesperia include: (A) , Calvary Chaple of the High Desert (B) , The Church of Jesus Christ of Latter Day Saints (C) , Hesperia Church of the Nazarene (D) , Kingdom Hall of Jehovahs Witnesses (E) , Mountain View Baptist Church (F) , Pentecostal Church of God (G) , Saint Hilarys Episcopal Mission (H) , Seventh Day Adventist Church (I) . Display/hide their locations on the map
Parks in Hesperia include: (1) , Lime Street Park (2) , Live Oak Park (3) , Timberlane Park (4) , Val Scheer Rodeo Grounds (5) . Display/hide their locations on the map
Tourist attractions: (1) , Cinema Safari Zoo (Cultural Attractions- Events- & Facilities; 19038 Willow Street) (2) . Display/hide their approximate locations on the map
Birthplace of: Thomas Denny (fighter) - Martial artist.
San Bernardino County has a predicted average indoor radon screening level between 2 and 4 pCi/L (pico curies per liter) - Moderate Potential Drinking water stations with addresses in Hesperia and their reported violations in the past:
DOYLE SPRINGS ASSN (Population served: 300, Groundwater):
Past health violations:
MCL, Monthly (TCR) - Between OCT-2005 and DEC-2005, Contaminant: Coliform. Follow-up actions: St Formal NOV issued (JAN-10-2006)
MCL, Monthly (TCR) - Between OCT-2005 and DEC-2005, Contaminant: Coliform
Past monitoring violations:
2 routine major monitoring violations
Population served: 150, Groundwater):
Past health violations:
MCL, Monthly (TCR) - In JUN-2009, Contaminant: Coliform. Follow-up actions: St Compliance achieved (JUL-10-2009), St Violation/Reminder Notice (AUG-18-2009)
Past monitoring violations:
Initial Tap Sampling for Pb and Cu - In JUL-01-1993, Contaminant: Lead and Copper Rule. Follow-up actions: Fed Compliance achieved (SEP-30-2005)
One routine major monitoring violation
Average household size: This city:
3.4 peopleCalifornia:
2.9 people
Percentage of family households: This city:
80.0%Whole state:
68.7%
Percentage of households with unmarried partners: This city:
8.2%Whole state:
7.2%
Likely homosexual households (counted as self-reported same-sex unmarried-partner households)
Lesbian couples: 0.4% of all households Gay men: 0.3% of all households
People in group quarters in Hesperia in 2010:
9 people in other noninstitutional facilities
6 people in nursing facilities/skilled-nursing facilities
6 people in group homes intended for adults
6 people in residential treatment centers for adults
People in group quarters in Hesperia in 2000:
104 people in nursing homes
87 people in other noninstitutional group quarters
86 people in state prisons
41 people in other group homes
6 people in homes for abused, dependent, and neglected children
5 people in homes for the mentally retarded
2 people in religious group quarters
Banks with branches in Hesperia (2011 data):
U.S. Bank National Association: Hesperia Branch at 14075 Main Street, branch established on 2007/04/07; Hesperia Branch at 16832 Main St., branch established on 1987/06/30. Info updated 2012/01/30: Bank assets: $330,470.8 mil, Deposits: $236,091.5 mil, headquarters in Cincinnati, OH, positive income , 3121 total offices , Holding Company: U.S. Bancorp
East West Bank: Hesperia Branch at 15479 Main Street, branch established on 1996/06/01. Info updated 2010/06/14: Bank assets: $21,962.4 mil, Deposits: $17,501.8 mil, headquarters in Pasadena, CA, positive income , Commercial Lending Specialization, 131 total offices , Holding Company: East West Bancorp, Inc.
JPMorgan Chase Bank, National Association: Hesperia Branch at 17317 East Main Street, branch established on 1988/06/30. Info updated 2011/11/10: Bank assets: $1,811,678.0 mil, Deposits: $1,190,738.0 mil, headquarters in Columbus, OH, positive income , International Specialization, 5577 total offices , Holding Company: Jpmorgan Chase & Co.
Wells Fargo Bank, National Association: Hesperia Main And I at 17442 Main Street, branch established on 1912/01/01. Info updated 2011/04/05: Bank assets: $1,161,490.0 mil, Deposits: $905,653.0 mil, headquarters in Sioux Falls, SD, positive income , 6395 total offices , Holding Company: Wells Fargo & Company
Union Bank, National Association: Hesperia Branch at 17123 Main Street, branch established on 1971/08/30. Info updated 2011/09/01: Bank assets: $88,967.5 mil, Deposits: $65,286.4 mil, headquarters in San Francisco, CA, positive income , Commercial Lending Specialization, 403 total offices , Holding Company: Mitsubishi Ufj Financial Group, Inc.
Bank of America, National Association: Hesperia Branch at 17291 Main Street, branch established on 1960/07/01. Info updated 2009/11/18: Bank assets: $1,451,969.3 mil, Deposits: $1,077,176.8 mil, headquarters in Charlotte, NC, positive income , 5782 total offices , Holding Company: Bank Of America Corporation
For population 15 years and over in Hesperia:
Never married: 34.7%Now married: 50.2%Separated: 1.9%Widowed: 5.4%Divorced: 7.8% For population 25 years and over in Hesperia:
High school or higher: 75.1%Bachelor's degree or higher: 9.5%Graduate or professional degree: 4.0%Unemployed: 10.6%Mean travel time to work (commute): 36.1 minutes
Education Gini index (Inequality in education) Here:
16.0California average:
15.5
Religion statistics for Hesperia, CA (based on San Bernardino County data)
Religion Adherents Congregations Catholic 445,334 55 Evangelical Protestant 243,524 832 Other 80,047 205 Mainline Protestant 26,062 135 Black Protestant 14,969 37 Orthodox 3,868 10 None 1,221,406 -
Source: Clifford Grammich, Kirk Hadaway, Richard Houseal, Dale E.Jones, Alexei Krindatch, Richie Stanley and Richard H.Taylor. 2012. 2010 U.S.Religion Census: Religious Congregations & Membership Study. Association of Statisticians of American Religious Bodies. Jones, Dale E., et al. 2002. Congregations and Membership in the United States 2000. Nashville, TN: Glenmary Research Center. Graphs represent county-level data
Food Environment Statistics: Number of grocery stores : 301This county :
1.50 / 10,000 pop.California :
2.14 / 10,000 pop.
Number of supercenters and club stores : 11San Bernardino County :
0.05 / 10,000 pop.State :
0.04 / 10,000 pop.
Number of convenience stores (no gas) : 114Here :
0.57 / 10,000 pop.California :
0.62 / 10,000 pop.
Number of convenience stores (with gas) : 320This county :
1.60 / 10,000 pop.California :
1.49 / 10,000 pop.
Number of full-service restaurants : 940San Bernardino County :
4.69 / 10,000 pop.California :
7.42 / 10,000 pop.
Adult diabetes rate : San Bernardino County :
7.4%California :
7.3%
Adult obesity rate : This county :
27.1%State :
21.3%
Low-income preschool obesity rate : San Bernardino County :
16.2%California :
17.9%
Health and Nutrition: Healthy diet rate : This city:
47.9%State:
49.4%
Average overall health of teeth and gums : Hesperia:
45.3%State:
48.0%
People feeling badly about themselves : This city:
22.2%California:
20.2%
People not drinking alcohol at all : Here:
10.9%California:
11.2%
Average hours sleeping at night : Hesperia:
6.8California:
6.8
Overweight people : This city:
33.7%California:
31.5%
General health condition : Average condition of hearing : Here:
79.1%California:
80.9%
More about Health and Nutrition of Hesperia, CA Residents
Local government employment and payroll (March 2022)
Function
Full-time employees
Monthly full-time payroll
Average yearly full-time wage
Part-time employees
Monthly part-time payroll
Other and Unallocable
37 $238,727 $77,425 3 $433 Financial Administration
19 $126,458 $79,868 1 $1,532 Other Government Administration
14 $113,677 $97,437 8 $7,615 Health
14 $65,919 $56,502 2 $4,234 Streets and Highways
13 $75,879 $70,042 0 $0 Housing and Community Development (Local)
8 $50,167 $75,251 0 $0
Totals for Government
105 $670,827 $76,666 14 $13,814
Hesperia government finances - Expenditure in 2017 (per resident):
Construction - Regular Highways: $15,284,000 ($151.71)
Housing and Community Development: $5,801,000 ($57.58)Protective Inspection and Regulation - Other: $2,401,000 ($23.83)Local Fire Protection: $112,000 ($1.11)Current Operations - Police Protection: $15,526,000 ($154.11)
Local Fire Protection: $10,599,000 ($105.21)Housing and Community Development: $9,621,000 ($95.50)Central Staff Services: $7,908,000 ($78.50)Regular Highways: $5,761,000 ($57.18)Financial Administration: $3,109,000 ($30.86)Protective Inspection and Regulation - Other: $2,699,000 ($26.79)Health - Other: $1,476,000 ($14.65)General - Other: $17,000 ($0.17)General - Interest on Debt: $10,121,000 ($100.46)
Other Capital Outlay - Housing and Community Development: $5,927,000 ($58.83)
General - Other: $659,000 ($6.54)General Public Building: $511,000 ($5.07)Central Staff Services: $91,000 ($0.90)
Hesperia government finances - Revenue in 2017 (per resident):
Charges - Other: $6,560,000 ($65.12)
Federal Intergovernmental - Housing and Community Development: $2,759,000 ($27.39)
Other: $27,000 ($0.27)Local Intergovernmental - Other: $153,000 ($1.52)
Miscellaneous - General Revenue - Other: $2,596,000 ($25.77)
Rents: $1,978,000 ($19.63)Special Assessments: $819,000 ($8.13)Fines and Forfeits: $710,000 ($7.05)Interest Earnings: $326,000 ($3.24)State Intergovernmental - Highways: $1,788,000 ($17.75)
Other: $793,000 ($7.87)General Local Government Support: $6,000 ($0.06)Tax - Property: $26,230,000 ($260.36)
General Sales and Gross Receipts: $10,662,000 ($105.83)Other License: $6,613,000 ($65.64)Public Utilities Sales: $3,231,000 ($32.07)Other Selective Sales: $1,101,000 ($10.93)Occupation and Business License - Other: $289,000 ($2.87)Documentary and Stock Transfer: $270,000 ($2.68)
Hesperia government finances - Debt in 2017 (per resident):
Long Term Debt - Beginning Outstanding - Unspecified Public Purpose: $186,940,000 ($1855.59)
Outstanding Unspecified Public Purpose: $185,225,000 ($1838.57)Retired Unspecified Public Purpose: $1,715,000 ($17.02)
Hesperia government finances - Cash and Securities in 2017 (per resident):
Bond Funds - Cash and Securities: $5,493,000 ($54.52)
Other Funds - Cash and Securities: $53,610,000 ($532.14)
Sinking Funds - Cash and Securities: $24,404,000 ($242.24)
6.45% of this county's 2021 resident taxpayers lived in other counties in 2020 ($54,954 average adjusted gross income )
Here:
6.45%California average:
5.19%
0.03% of residents moved from foreign countries ($259 average AGI )San Bernardino County:
0.03%California average:
0.03%
Top counties from which taxpayers relocated into this county between 2020 and 2021:
6.46% of this county's 2020 resident taxpayers moved to other counties in 2021 ($59,647 average adjusted gross income )
Here:
6.46%California average:
6.14%
0.03% of residents moved to foreign countries ($253 average AGI )San Bernardino County:
0.03%California average:
0.02%
Top counties to which taxpayers relocated from this county between 2020 and 2021:
Businesses in Hesperia, CA
Name Count Name Count
7-Eleven 2 Marriott 2 99 Cents Only Stores 2 Marshalls 1 Albertsons 1 MasterBrand Cabinets 5 Arby's 1 McDonald's 2 AutoZone 2 Motel 6 1 Blockbuster 1 Panda Express 1 Burger King 2 Papa John's Pizza 2 CVS 1 Penske 1 Carl\s Jr. 2 Pizza Hut 1 Circle K 2 Popeyes 2 Curves 1 Quiznos 1 DHL 2 RadioShack 1 Decora Cabinetry 1 Rite Aid 2 Dennys 1 Rue21 1 Discount Tire 1 Sears 1 Econo Lodge 1 Sprint Nextel 1 El Pollo Loco 1 Starbucks 4 FedEx 4 Subway 4 Firestone Complete Auto Care 1 Super 8 1 GNC 3 T-Mobile 4 H&R Block 1 Taco Bell 2 Holiday Inn 1 Target 1 IHOP 1 U-Haul 7 Jack In The Box 2 UPS 3 Jones New York 1 Verizon Wireless 2 KFC 1 Vons 1 Kmart 1 Walgreens 3 La Quinta 1 Wendy's 2 Little Caesars Pizza 3
Strongest AM radio stations in Hesperia:
KIXW (960 AM; 5 kW; APPLE VALLEY, CA; Owner: CAPSTAR TX LIMITED PARTNERSHIP)
KLAC (570 AM; 50 kW; LOS ANGELES, CA; Owner: AMFM RADIO LICENSES, L.L.C.)
KPLS (830 AM; 50 kW; ORANGE, CA; Owner: CRN LICENSES, LLC)
KRAK (910 AM; 1 kW; HESPERIA, CA; Owner: INFINITY RADIO OPERATIONS INC.)
KFI (640 AM; 50 kW; LOS ANGELES, CA; Owner: CAPSTAR TX LIMITED PARTNERSHIP)
KDIS (1110 AM; 50 kW; PASADENA, CA; Owner: ABC,INC.)
KWRN (1550 AM; 5 kW; APPLE VALLEY, CA; Owner: MAJOR MARKET STATONS, INC.)
KTNQ (1020 AM; 50 kW; LOS ANGELES, CA; Owner: KTNQ-AM LICENSE CORP.)
KXTA (1150 AM; 50 kW; LOS ANGELES, CA; Owner: CITICASTERS LICENSES, L.P.)
KFWB (980 AM; 50 kW; LOS ANGELES, CA; Owner: INFINITY BROADCASTING OPERATIONS, INC.)
KSPN (710 AM; 50 kW; LOS ANGELES, CA; Owner: KABC-AM RADIO, INC.)
KIRN (670 AM; 35 kW; SIMI VALLEY, CA; Owner: LOTUS OXNARD CORP.)
KMPC (1540 AM; 50 kW; LOS ANGELES, CA; Owner: ROSE CITY RADIO CORPORATION)
Strongest FM radio stations in Hesperia:
K295AI (106.9 FM; MUSCOY, CA; Owner: ASSOCIATION FOR COMMUNITY EDUCATION, INC.)
KHMS (88.5 FM; VICTORVILLE, CA; Owner: FAITH COMMUNICATIONS CORP.)
KCXX (103.9 FM; LAKE ARROWHEAD, CA; Owner: ALL-PRO BROADCASTING, INC.)
K212EK (90.3 FM; VICTORVILLE, CA; Owner: CALVARY CHAPEL OF TWIN FALLS, INC.)
K210DL (89.9 FM; APPLE VALLEY, CA; Owner: CALVARY CHAPEL OF TWIN FALLS, INC.)
KGGI (99.1 FM; RIVERSIDE, CA; Owner: AMFM RADIO LICENSES, L.L.C.)
KATJ-FM (100.7 FM; GEORGE, CA; Owner: CAPSTAR TX LIMITED PARTNERSHIP)
KVFG (103.1 FM; VICTORVILLE, CA; Owner: INFINITY RADIO OPERATIONS INC.)
KLYY (97.5 FM; RIVERSIDE, CA; Owner: ENTRAVISION HOLDINGS, LLC)
K201CD (88.1 FM; VICTORVILLE, CA; Owner: SAN BERNARDINO COMMNTY COLLEGE DIST.)
KELT (92.7 FM; RIVERSIDE, CA; Owner: AMATURO GROUP OF L.A., LTD)
KXRD (89.5 FM; VICTORVILLE, CA; Owner: EDUCATIONAL MEDIA FOUNDATION)
KUOR-FM (89.1 FM; REDLANDS, CA; Owner: UNIVERSITY OF REDLANDS)
KLRD (90.1 FM; YUCAIPA, CA; Owner: EDUCATIONAL MEDIA FOUNDATION)
KIXA (106.5 FM; LUCERNE VALLEY, CA; Owner: CAPSTAR TX LIMITED PARTNERSHIP)
K264AF (100.7 FM; GUASTI, CA; Owner: EDUCATIONAL MEDIA FOUNDATION)
KZXY-FM (102.3 FM; APPLE VALLEY, CA; Owner: CAPSTAR TX LIMITED PARTNERSHIP)
KCBS-FM (93.1 FM; LOS ANGELES, CA; Owner: INFINITY BROADCASTING OPERATIONS, INC.)
K201AR (88.1 FM; BANNING, CA; Owner: KSGN, INC.)
K232CX (94.3 FM; DESERT HOT SPRINGS, CA; Owner: MCC RADIO, LLC)
TV broadcast stations around Hesperia:
KHIZ (Channel 64; BARSTOW, CA; Owner: SUNBELT TELEVISION, INC.)
KTRO-LP (Channel 50; LANCASTER, CA; Owner: ROBERT D. ADELMAN)
National Bridge Inventory (NBI) Statistics 33 Number of bridges443ft / 135m Total length $1,154,000 Total costs1,091,932 Total average daily traffic149,639 Total average daily truck traffic
New bridges - historical statistics
1 1920-1929 1 1950-1959 11 1960-1969 9 1970-1979 2 1990-1999 3 2000-2009 6 2010-2019
See full National Bridge Inventory statistics for Hesperia, CA
Home Mortgage Disclosure Act Aggregated Statistics For Year 2009(Based on 12 full and 3 partial tracts) A) FHA, FSA/RHS & VA B) Conventional C) Refinancings D) Home Improvement Loans E) Loans on Dwellings For 5+ Families F) Non-occupant Loans on G) Loans On Manufactured Number Average Value Number Average Value Number Average Value Number Average Value Number Average Value Number Average Value Number Average Value
LOANS ORIGINATED 839 $127,152 365 $100,320 431 $158,376 27 $60,587 1 $556,000 199 $86,811 6 $107,347 APPLICATIONS APPROVED, NOT ACCEPTED 64 $131,127 46 $108,035 83 $161,933 6 $66,617 0 $0 33 $102,842 2 $85,760 APPLICATIONS DENIED 154 $127,517 106 $99,491 371 $172,953 56 $62,378 1 $130,000 74 $91,368 18 $91,634 APPLICATIONS WITHDRAWN 103 $128,832 75 $107,370 195 $167,622 13 $73,280 0 $0 43 $93,834 2 $82,465 FILES CLOSED FOR INCOMPLETENESS 28 $138,310 22 $118,180 37 $174,608 2 $43,575 1 $500,000 11 $141,878 1 $153,960
Aggregated Statistics For Year 2008(Based on 12 full and 3 partial tracts) A) FHA, FSA/RHS & VA B) Conventional C) Refinancings D) Home Improvement Loans E) Loans on Dwellings For 5+ Families F) Non-occupant Loans on G) Loans On Manufactured Number Average Value Number Average Value Number Average Value Number Average Value Number Average Value Number Average Value Number Average Value
LOANS ORIGINATED 543 $183,632 406 $156,566 578 $176,933 78 $91,794 3 $845,333 174 $139,543 14 $98,099 APPLICATIONS APPROVED, NOT ACCEPTED 47 $189,282 102 $160,642 210 $205,015 18 $74,560 0 $0 43 $141,573 16 $88,924 APPLICATIONS DENIED 114 $189,246 197 $180,906 1,022 $228,481 149 $116,497 0 $0 137 $183,599 23 $99,130 APPLICATIONS WITHDRAWN 75 $184,445 87 $164,572 289 $209,693 44 $118,408 2 $255,000 46 $152,740 2 $131,000 FILES CLOSED FOR INCOMPLETENESS 17 $204,948 32 $181,645 80 $222,640 14 $184,557 0 $0 15 $135,701 2 $39,755
Aggregated Statistics For Year 2007(Based on 12 full and 3 partial tracts) A) FHA, FSA/RHS & VA B) Conventional C) Refinancings D) Home Improvement Loans E) Loans on Dwellings For 5+ Families F) Non-occupant Loans on G) Loans On Manufactured Number Average Value Number Average Value Number Average Value Number Average Value Number Average Value Number Average Value Number Average Value
LOANS ORIGINATED 54 $266,343 950 $213,110 2,290 $219,952 423 $138,888 8 $769,125 273 $213,823 32 $113,365 APPLICATIONS APPROVED, NOT ACCEPTED 5 $273,010 277 $216,938 662 $237,662 109 $90,454 0 $0 85 $226,848 22 $89,894 APPLICATIONS DENIED 7 $238,557 691 $236,225 2,249 $262,804 557 $145,495 3 $850,667 244 $239,768 38 $100,287 APPLICATIONS WITHDRAWN 10 $264,523 291 $220,875 898 $237,794 142 $177,680 0 $0 88 $223,243 5 $128,698 FILES CLOSED FOR INCOMPLETENESS 4 $278,910 109 $227,781 364 $264,633 17 $171,509 0 $0 26 $182,449 2 $182,070
Aggregated Statistics For Year 2006(Based on 12 full and 3 partial tracts) A) FHA, FSA/RHS & VA B) Conventional C) Refinancings D) Home Improvement Loans E) Loans on Dwellings For 5+ Families F) Non-occupant Loans on G) Loans On Manufactured Number Average Value Number Average Value Number Average Value Number Average Value Number Average Value Number Average Value Number Average Value
LOANS ORIGINATED 18 $232,021 3,321 $196,301 4,115 $219,100 739 $130,627 6 $935,618 604 $192,735 43 $115,727 APPLICATIONS APPROVED, NOT ACCEPTED 2 $156,500 646 $200,270 801 $229,032 129 $122,381 0 $0 140 $206,483 15 $92,531 APPLICATIONS DENIED 5 $253,362 1,357 $198,855 2,298 $238,218 612 $125,073 1 $576,300 253 $223,118 37 $146,759 APPLICATIONS WITHDRAWN 6 $186,947 768 $205,334 1,822 $230,235 231 $169,662 1 $290,000 150 $190,882 9 $139,719 FILES CLOSED FOR INCOMPLETENESS 0 $0 179 $219,000 366 $227,829 28 $178,131 1 $910,000 37 $235,429 3 $262,247
Aggregated Statistics For Year 2005(Based on 12 full and 3 partial tracts) A) FHA, FSA/RHS & VA B) Conventional C) Refinancings D) Home Improvement Loans E) Loans on Dwellings For 5+ Families F) Non-occupant Loans on G) Loans On Manufactured Number Average Value Number Average Value Number Average Value Number Average Value Number Average Value Number Average Value Number Average Value
LOANS ORIGINATED 39 $188,492 3,370 $180,111 5,119 $184,939 754 $124,515 11 $1,245,135 651 $175,143 45 $101,309 APPLICATIONS APPROVED, NOT ACCEPTED 7 $175,437 735 $181,580 796 $182,936 121 $79,662 0 $0 149 $165,607 25 $78,544 APPLICATIONS DENIED 15 $195,077 1,211 $181,303 2,184 $189,570 470 $102,031 1 $1,050,000 209 $179,043 67 $89,116 APPLICATIONS WITHDRAWN 11 $155,581 907 $196,356 1,962 $189,083 296 $130,536 0 $0 186 $173,222 15 $139,527 FILES CLOSED FOR INCOMPLETENESS 4 $215,500 176 $186,596 607 $185,472 37 $110,818 0 $0 43 $164,562 1 $135,410
Aggregated Statistics For Year 2004(Based on 12 full and 3 partial tracts) A) FHA, FSA/RHS & VA B) Conventional C) Refinancings D) Home Improvement Loans E) Loans on Dwellings For 5+ Families F) Non-occupant Loans on G) Loans On Manufactured Number Average Value Number Average Value Number Average Value Number Average Value Number Average Value Number Average Value Number Average Value
LOANS ORIGINATED 230 $159,872 2,846 $139,653 4,757 $140,705 639 $98,269 18 $903,722 545 $125,174 25 $65,027 APPLICATIONS APPROVED, NOT ACCEPTED 21 $149,415 554 $149,291 988 $142,653 129 $78,504 1 $174,000 125 $129,460 20 $110,361 APPLICATIONS DENIED 48 $159,091 812 $138,963 2,079 $147,974 441 $71,807 2 $755,000 180 $129,797 38 $73,747 APPLICATIONS WITHDRAWN 42 $151,321 561 $153,166 1,910 $141,115 229 $94,332 0 $0 122 $139,148 10 $102,552 FILES CLOSED FOR INCOMPLETENESS 7 $155,729 129 $160,825 400 $142,474 67 $88,157 1 $179,000 34 $119,943 1 $263,810
Aggregated Statistics For Year 2003(Based on 12 full and 3 partial tracts) A) FHA, FSA/RHS & VA B) Conventional C) Refinancings D) Home Improvement Loans E) Loans on Dwellings For 5+ Families F) Non-occupant Loans on Number Average Value Number Average Value Number Average Value Number Average Value Number Average Value Number Average Value
LOANS ORIGINATED 580 $118,148 1,667 $105,851 4,576 $105,816 163 $37,832 7 $939,714 432 $92,093 APPLICATIONS APPROVED, NOT ACCEPTED 27 $122,379 299 $106,535 809 $109,900 45 $37,835 0 $0 88 $101,764 APPLICATIONS DENIED 75 $127,458 385 $104,856 1,886 $123,948 222 $37,395 2 $223,000 140 $90,476 APPLICATIONS WITHDRAWN 54 $125,854 206 $112,041 1,649 $112,361 52 $40,820 1 $2,300,000 84 $95,885 FILES CLOSED FOR INCOMPLETENESS 21 $124,742 59 $113,822 283 $110,907 22 $40,411 0 $0 28 $86,312
Aggregated Statistics For Year 1999(Based on 1 full and 3 partial tracts) A) FHA, FSA/RHS & VA B) Conventional C) Refinancings D) Home Improvement Loans E) Loans on Dwellings For 5+ Families F) Non-occupant Loans on Number Average Value Number Average Value Number Average Value Number Average Value Number Average Value Number Average Value
LOANS ORIGINATED 482 $82,853 224 $72,633 683 $77,714 106 $25,039 15 $143,539 101 $56,432 APPLICATIONS APPROVED, NOT ACCEPTED 20 $83,280 32 $77,439 170 $82,580 74 $23,400 1 $59,160 12 $66,159 APPLICATIONS DENIED 40 $88,220 69 $72,732 581 $66,042 180 $21,493 7 $256,581 40 $64,574 APPLICATIONS WITHDRAWN 39 $91,384 63 $78,146 291 $76,178 12 $32,427 2 $116,555 25 $63,935 FILES CLOSED FOR INCOMPLETENESS 15 $81,319 10 $78,098 101 $83,671 3 $26,810 0 $0 8 $67,319
Detailed mortgage data for all 15 tracts in Hesperia, CA
Private Mortgage Insurance Companies Aggregated Statistics For Year 2009(Based on 12 full and 3 partial tracts) A) Conventional B) Refinancings C) Non-occupant Loans on Number Average Value Number Average Value Number Average Value
LOANS ORIGINATED 29 $123,714 4 $159,405 4 $99,030 APPLICATIONS APPROVED, NOT ACCEPTED 19 $155,654 6 $246,518 2 $152,925 APPLICATIONS DENIED 8 $138,979 2 $169,720 0 $0 APPLICATIONS WITHDRAWN 2 $181,210 0 $0 0 $0 FILES CLOSED FOR INCOMPLETENESS 1 $55,160 2 $246,010 0 $0
Aggregated Statistics For Year 2008(Based on 12 full and 3 partial tracts) A) Conventional B) Refinancings C) Non-occupant Loans on Number Average Value Number Average Value Number Average Value
LOANS ORIGINATED 152 $202,940 54 $249,426 17 $171,486 APPLICATIONS APPROVED, NOT ACCEPTED 148 $273,311 119 $281,989 13 $249,719 APPLICATIONS DENIED 38 $184,840 21 $263,835 15 $179,035 APPLICATIONS WITHDRAWN 11 $219,102 9 $282,717 0 $0 FILES CLOSED FOR INCOMPLETENESS 4 $253,302 6 $314,795 3 $324,703
Aggregated Statistics For Year 2007(Based on 12 full and 3 partial tracts) A) Conventional B) Refinancings C) Non-occupant Loans on D) Loans On Manufactured Number Average Value Number Average Value Number Average Value Number Average Value
LOANS ORIGINATED 204 $281,078 172 $307,403 22 $273,040 3 $163,137 APPLICATIONS APPROVED, NOT ACCEPTED 37 $302,451 81 $312,592 4 $338,930 3 $155,893 APPLICATIONS DENIED 11 $301,827 15 $316,276 4 $341,445 0 $0 APPLICATIONS WITHDRAWN 17 $283,449 15 $311,767 2 $315,165 0 $0 FILES CLOSED FOR INCOMPLETENESS 0 $0 2 $304,270 0 $0 0 $0
Aggregated Statistics For Year 2006(Based on 12 full and 3 partial tracts) A) Conventional B) Refinancings C) Non-occupant Loans on D) Loans On Manufactured Number Average Value Number Average Value Number Average Value Number Average Value
LOANS ORIGINATED 64 $288,340 89 $312,525 7 $256,579 1 $152,440 APPLICATIONS APPROVED, NOT ACCEPTED 18 $304,089 36 $270,408 1 $172,890 1 $228,860 APPLICATIONS DENIED 8 $319,045 3 $394,690 0 $0 0 $0 APPLICATIONS WITHDRAWN 4 $341,228 7 $313,787 0 $0 0 $0 FILES CLOSED FOR INCOMPLETENESS 0 $0 1 $290,210 0 $0 0 $0
Aggregated Statistics For Year 2005(Based on 12 full and 3 partial tracts) A) Conventional B) Refinancings C) Non-occupant Loans on D) Loans On Manufactured Number Average Value Number Average Value Number Average Value Number Average Value
LOANS ORIGINATED 139 $242,927 121 $237,232 22 $193,125 1 $153,730 APPLICATIONS APPROVED, NOT ACCEPTED 38 $240,586 62 $218,637 12 $210,302 0 $0 APPLICATIONS DENIED 5 $236,210 2 $305,500 0 $0 0 $0 APPLICATIONS WITHDRAWN 9 $222,373 7 $263,204 3 $215,397 0 $0 FILES CLOSED FOR INCOMPLETENESS 1 $279,800 2 $179,355 1 $279,800 0 $0
Aggregated Statistics For Year 2004(Based on 12 full and 3 partial tracts) A) Conventional B) Refinancings C) Non-occupant Loans on D) Loans On Manufactured Number Average Value Number Average Value Number Average Value Number Average Value
LOANS ORIGINATED 258 $174,513 190 $167,821 48 $147,435 1 $100,690 APPLICATIONS APPROVED, NOT ACCEPTED 63 $156,246 82 $145,446 15 $117,456 2 $103,510 APPLICATIONS DENIED 7 $182,924 3 $211,120 3 $178,043 0 $0 APPLICATIONS WITHDRAWN 8 $164,324 22 $151,724 5 $149,200 0 $0 FILES CLOSED FOR INCOMPLETENESS 7 $144,249 4 $137,700 2 $119,000 0 $0
Aggregated Statistics For Year 2003(Based on 12 full and 3 partial tracts) A) Conventional B) Refinancings C) Non-occupant Loans on Number Average Value Number Average Value Number Average Value
LOANS ORIGINATED 341 $135,504 420 $121,903 48 $108,569 APPLICATIONS APPROVED, NOT ACCEPTED 47 $133,950 116 $121,424 7 $88,690 APPLICATIONS DENIED 7 $152,233 5 $118,818 1 $68,000 APPLICATIONS WITHDRAWN 8 $149,834 16 $115,497 5 $96,910 FILES CLOSED FOR INCOMPLETENESS 1 $50,000 3 $120,000 1 $100,000
Aggregated Statistics For Year 1999(Based on 1 full and 3 partial tracts) A) Conventional B) Refinancings C) Non-occupant Loans on Number Average Value Number Average Value Number Average Value
LOANS ORIGINATED 69 $93,348 70 $105,701 9 $68,340 APPLICATIONS APPROVED, NOT ACCEPTED 11 $104,115 17 $98,796 4 $64,342 APPLICATIONS DENIED 6 $133,963 7 $95,291 0 $0 APPLICATIONS WITHDRAWN 5 $80,794 5 $104,466 1 $40,840 FILES CLOSED FOR INCOMPLETENESS 1 $85,840 0 $0 0 $0
Fire-safe hotels and motels in Hesperia, California:
Americas Best Value Inn, 12033 Oakwood Ave, Hesperia, California 92345 Phone: (760) 949-3231, Fax: (760) 949-0237
Days Inn & Suites, 14865 Bear Valley Rd, Hesperia, California 92345 Phone: (760) 948-0600, Fax: (760) 956-8645
Springhill Suites By Marriott, 9625 Mariposa Rd, Hesperia, California 92345 Phone: (760) 948-8982, Fax: (760) 948-8984
Econo Lodge, 11976 Mariposa Rd, Hesperia, California 92345 Phone: (760) 949-1515, Fax: (760) 949-5529
Country Hearth Inn & Suites, 9757 Cataba Rd, Hesperia, California 92345 Phone: (760) 947-0094, Fax: (760) 947-1731
Courtyard By Marriott, 9619 Mariposa Rd, Hesperia, California 92345 Phone: (760) 956-3876, Fax: (760) 956-3876
All 6 fire-safe hotels and motels in Hesperia, California
Most common first names in Hesperia, CA among deceased individuals Name Count Lived (average)
John 267 73.7 years William 229 73.8 years Robert 228 71.9 years Mary 215 77.8 years James 192 72.8 years Charles 148 75.0 years George 138 76.3 years Richard 121 67.4 years Joseph 111 75.8 years Helen 103 77.9 years
Most common last names in Hesperia, CA among deceased individuals Last name Count Lived (average)
Smith 111 72.0 years Johnson 80 74.9 years Brown 57 73.1 years Jones 56 73.4 years Williams 47 73.4 years Davis 38 76.3 years Anderson 37 71.9 years Garcia 35 68.1 years Miller 35 78.1 years Thompson 34 79.1 years
Hesperia compared to California state average:
Median house value below state average. Hispanic race population percentage above state average. Length of stay since moving in significantly below state average. House age below state average. Percentage of population with a bachelor's degree or higher significantly below state average.
#4 on the list of "Top 101 cities with the smallest sunshine amount differences during a year (population 50,000+)"
#5 on the list of "Top 101 cities with largest percentage of males in industries: other services, except public administration (population 50,000+)"
#5 on the list of "Top 101 cities with largest percentage of females in occupations: transportation occupations (population 50,000+)"
#9 on the list of "Top 101 cities with largest percentage of females in occupations: installation, maintenance, and repair occupations (population 50,000+)"
#15 on the list of "Top 101 cities with largest percentage of males in occupations: construction and extraction occupations (population 50,000+)"
#19 on the list of "Top 101 cities with largest percentage of males in occupations: transportation occupations (population 50,000+)"
#22 on the list of "Top 101 cities with largest percentage of males in industries: construction (population 50,000+)"
#28 on the list of "Top 101 cities with the largest percentage of one, detached housing units in structures (20,000+ housing units)"
#31 on the list of "Top 101 cities with the largest differences between daily high and daily low temperatures (population 50,000+)"
#36 on the list of "Top 101 cities with fewest building permits per 10,000 residents (population 50,000+)"
#38 on the list of "Top 101 cities with largest percentage of males in industries: utilities (population 50,000+)"
#40 on the list of "Top 101 cities with the least people having Doctorate degrees (population 50,000+)"
#40 on the list of "Top 101 cities with largest percentage of females in industries: construction (population 50,000+)"
#44 on the list of "Top 101 cities with the largest city-data.com crime index increase from 2002 to 2012 (population 50,000+)"
#46 on the list of "Top 101 cities with the largest city-data.com crime index increase from 2011 to 2012 (population 50,000+)"
#48 on the list of "Top 101 cities with the most cars per house, population 50,000+"
#54 on the list of "Top 100 least-educated cities (pop. 50,000+)"
#55 on the list of "Top 100 cities with longest commuting times (pop. 50,000+)"
#57 on the list of "Top 101 cities with largest percentage of males in occupations: installation, maintenance, and repair occupations (population 50,000+)"
#59 on the list of "Top 100 highest located cities (pop. 50,000+)"
#5 on the list of "Top 101 counties with the highest Nitrogen Dioxide air pollution readings in 2012 (ppm)"
#5 on the list of "Top 101 counties with the highest ground withdrawal of fresh water for public supply"
#10 on the list of "Top 101 counties with the most Evangelical Protestant congregations"
#14 on the list of "Top 101 counties with the highest total withdrawal of fresh water for public supply"
#15 on the list of "Top 101 counties with the most Evangelical Protestant adherents (pop. 50,000+)"
Top Patent Applicants
Thomas V. Doherty (3)
Fred Barker (2)
Eric Schmidt (2)
Alex Chavez (2)
Ofir Moreno (2)
Andrew K. Brown (2)
Timothy L. Timmerman, Ii (2)
Manuel Sandoval (2)
Gerald W. Reid (1)
Martin Hair (1)
Total of 45 patent applications in 2008-2024.


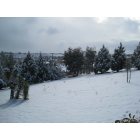
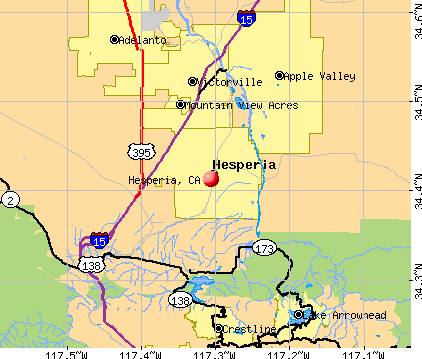


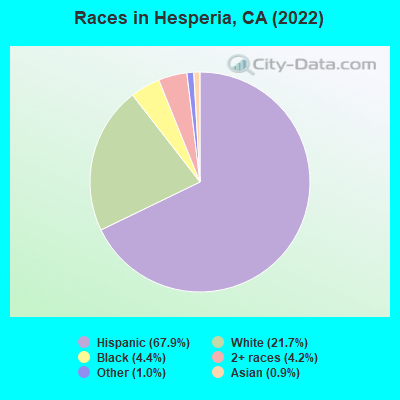
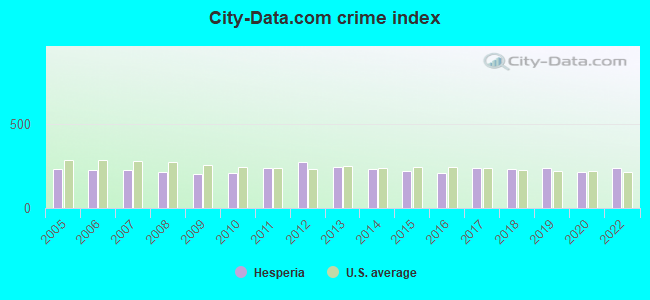
 Recent articles from our blog. Our writers, many of them Ph.D. graduates or candidates, create easy-to-read articles on a wide variety of topics.

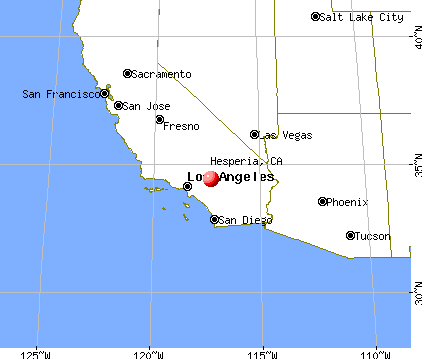
 (32.6 miles
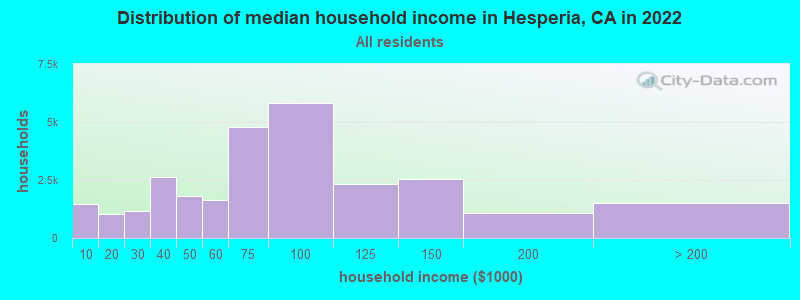
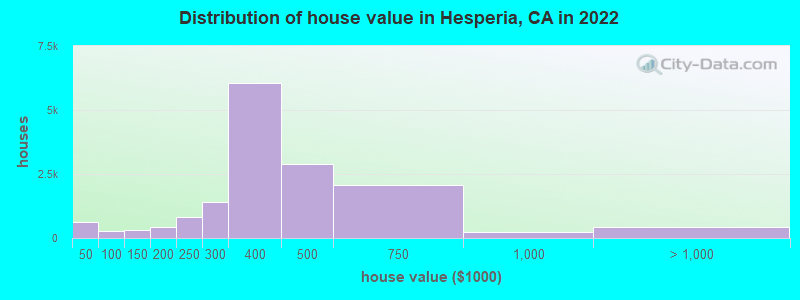
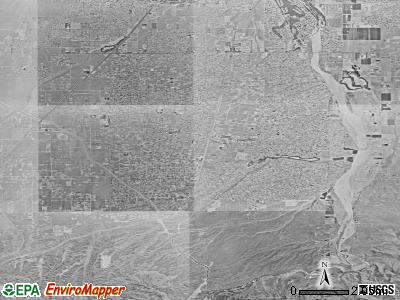
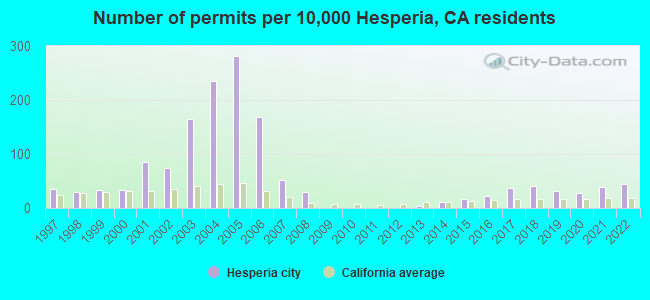
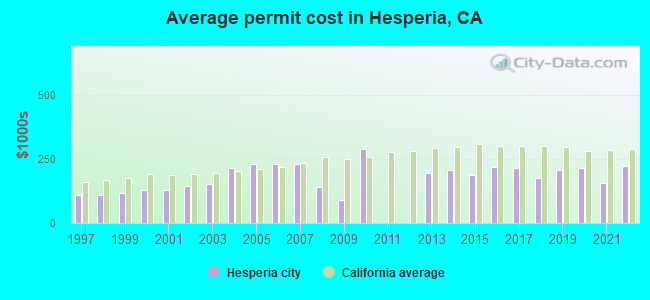
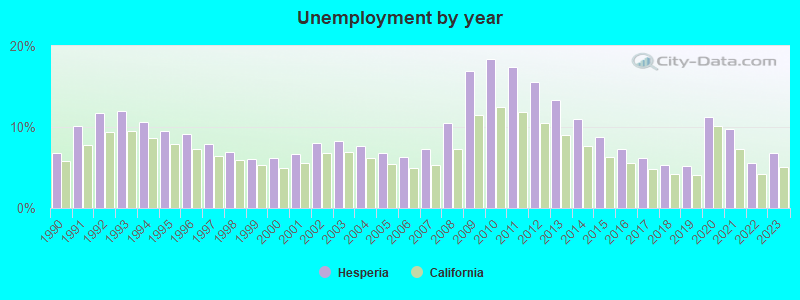
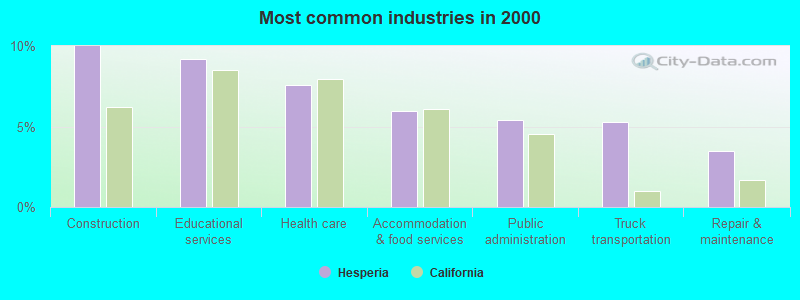
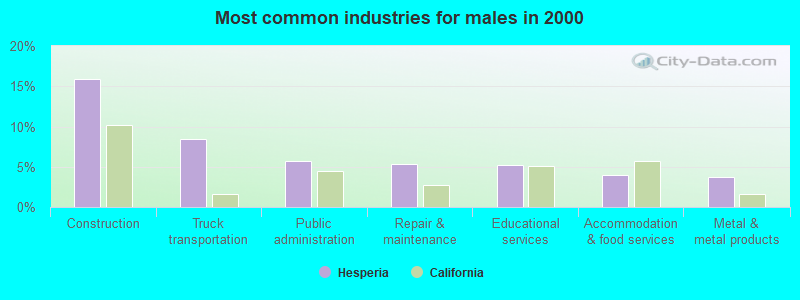
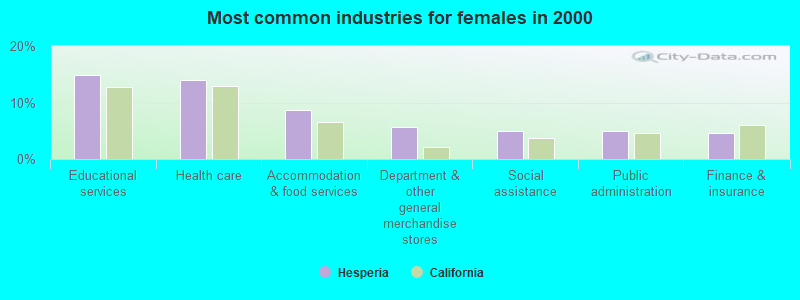
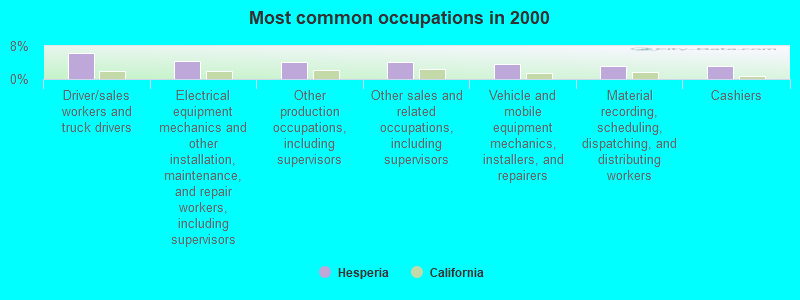
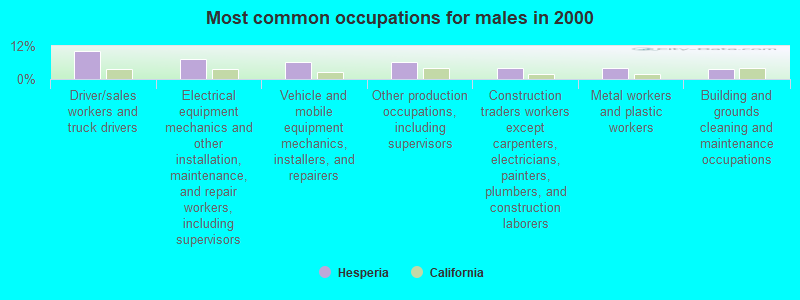
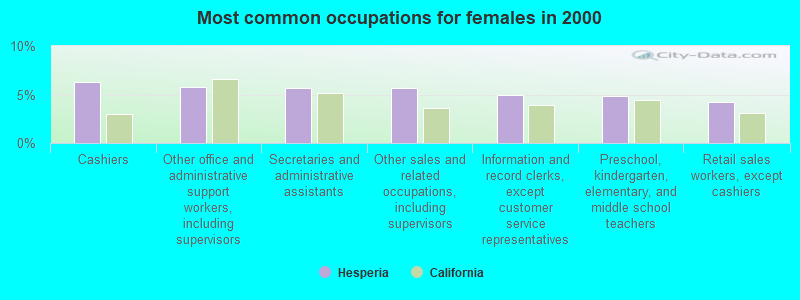
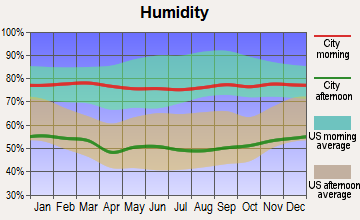
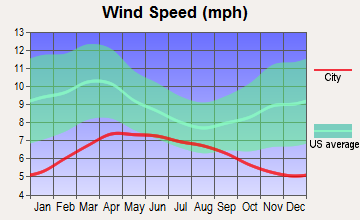
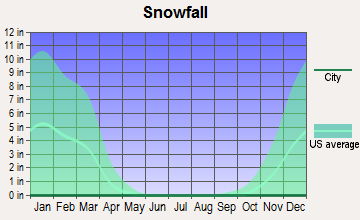
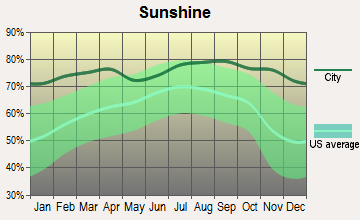
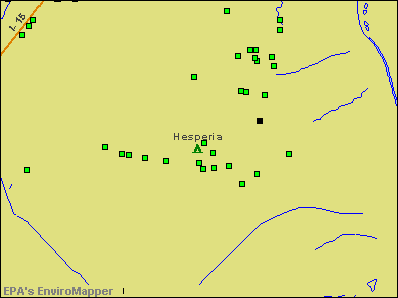

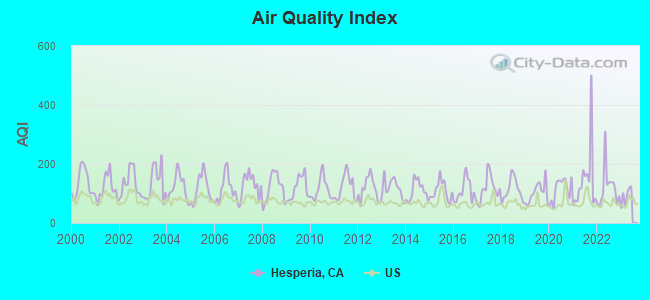
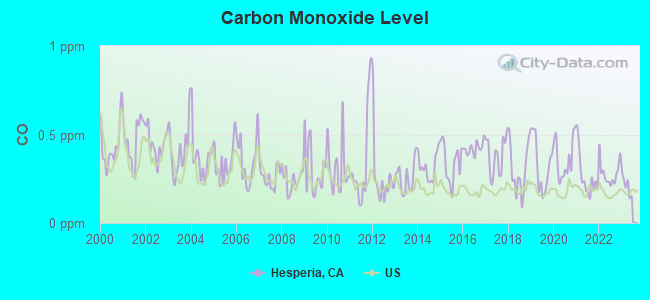
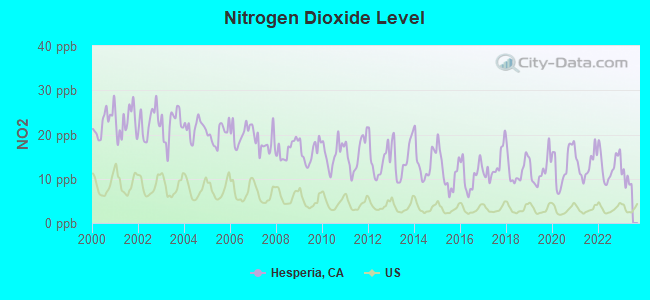
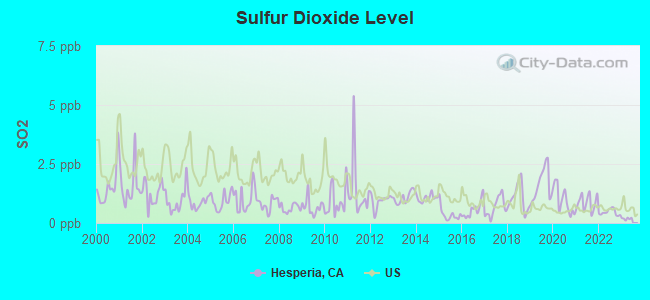

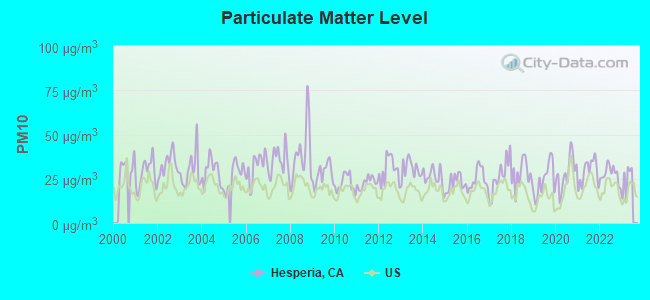
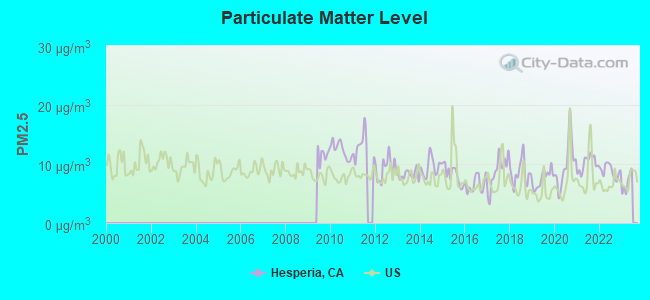
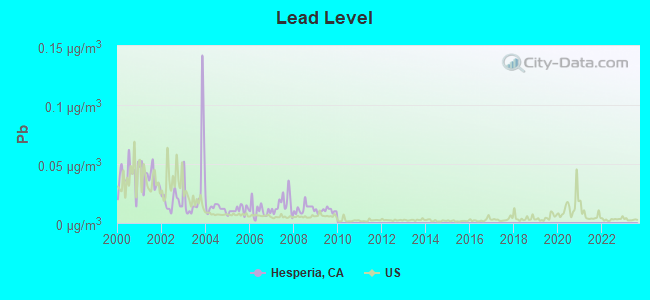
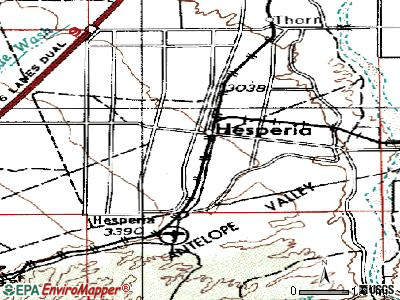
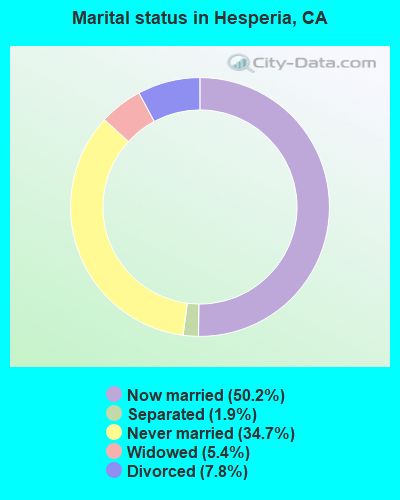
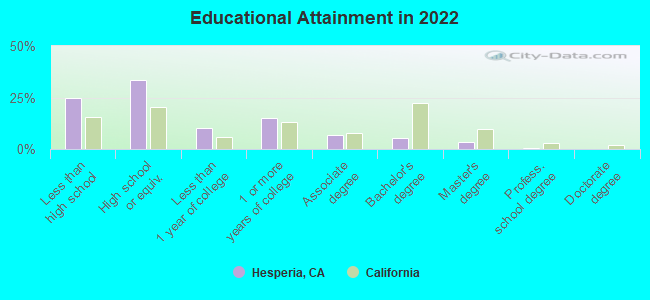
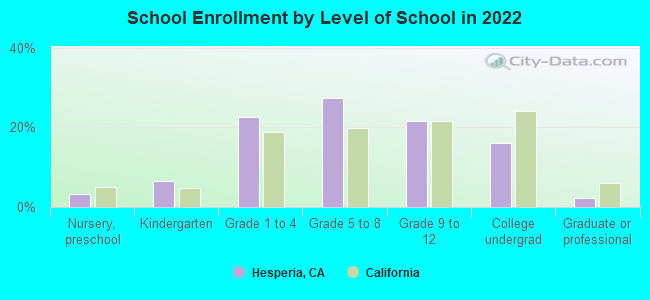
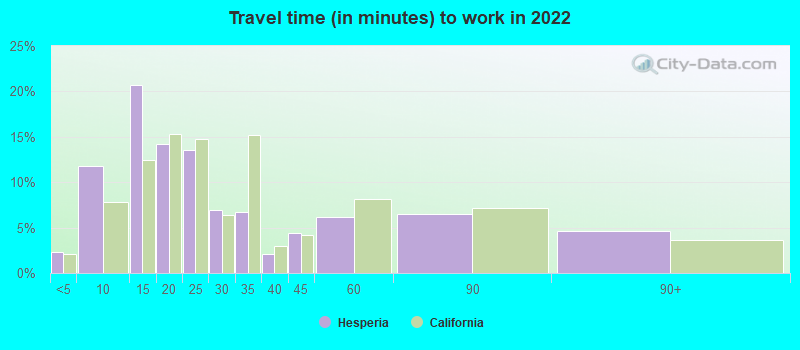
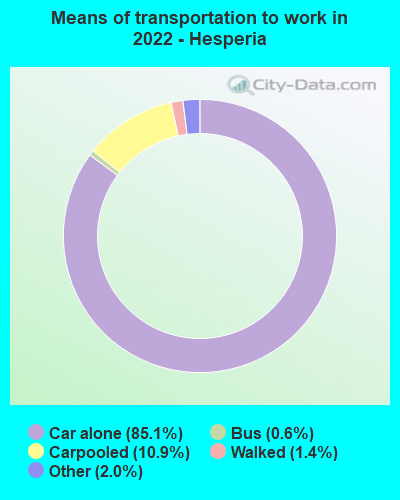
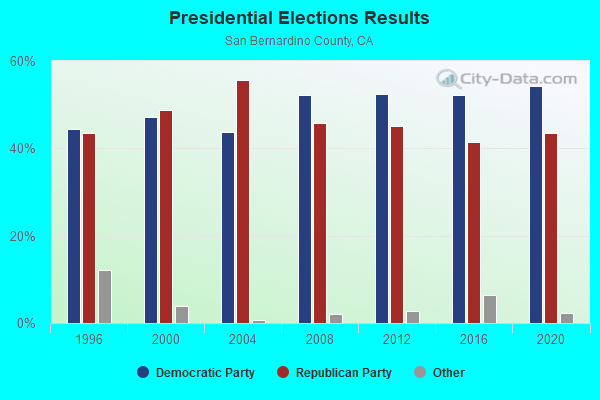
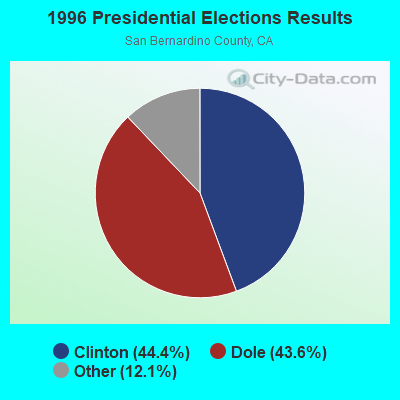
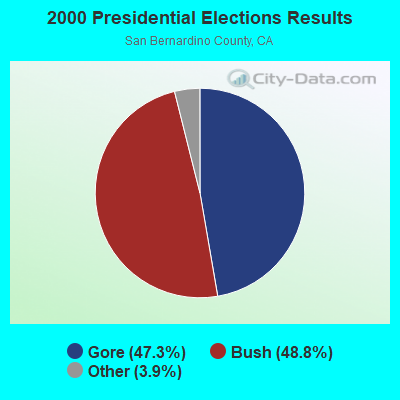
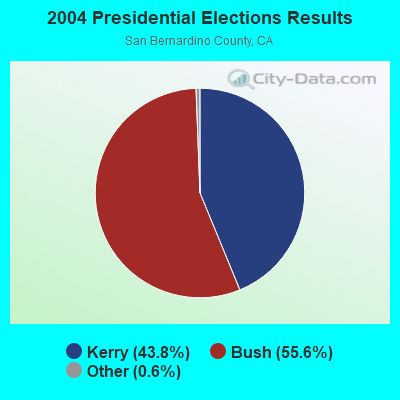
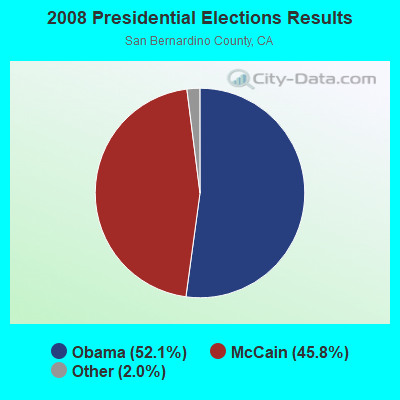
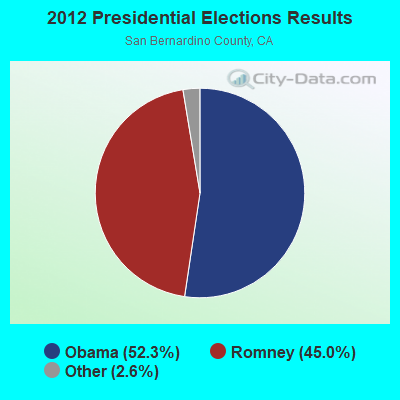
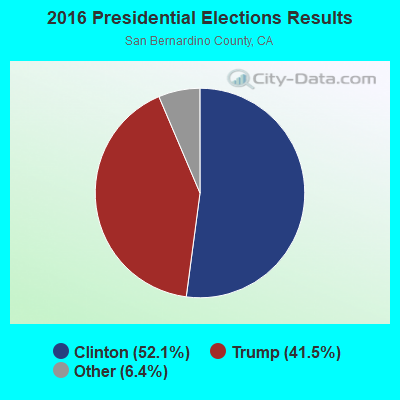
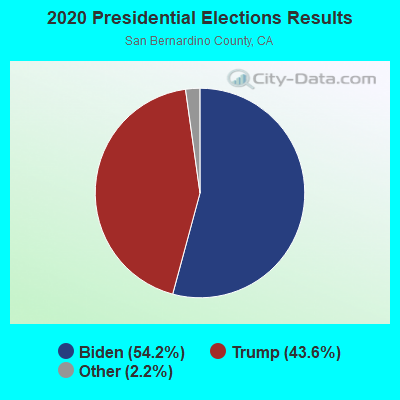
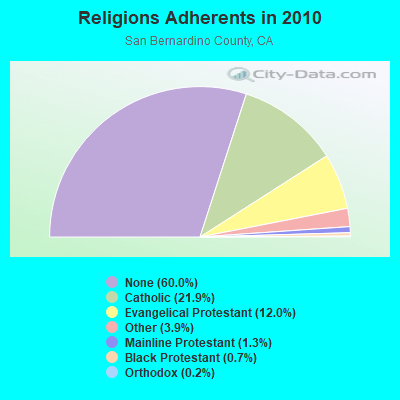
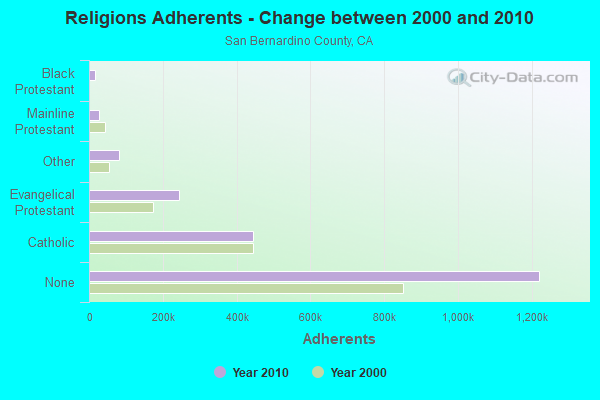
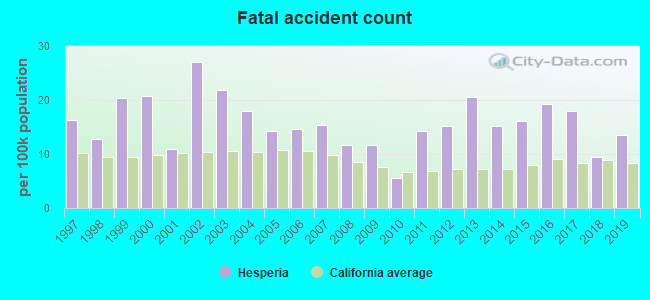
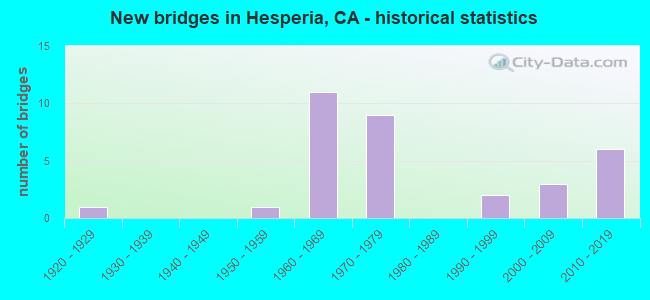
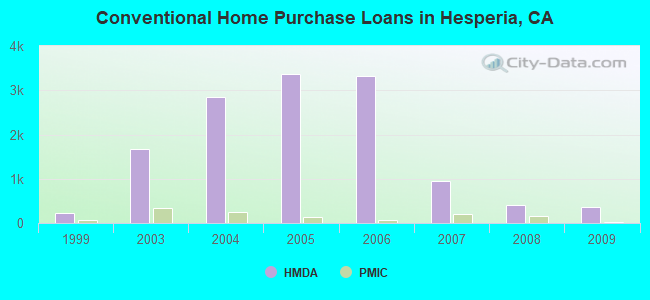
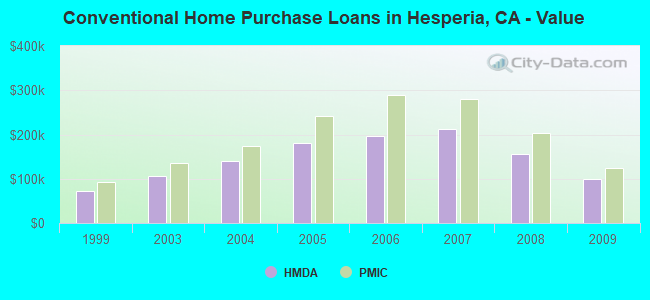
 According to the data from the years 2005 - 2018 the average number of fires per year is 52. The highest number of reported fire incidents - 203 took place in 2018, and the least - 0 in 2012. The data has a growing trend.
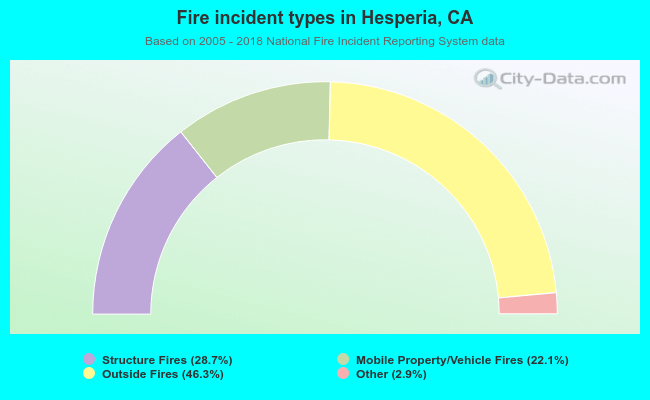 When looking into fire subcategories, the most incidents belonged to: Outside Fires (46.3%), and Structure Fires (28.7%).