Estimated zip code population in 2022: 31,288
Zip code population in 2010: 28,873
Zip code population in 2000: 24,637
Houses and condos: 9,891
Renter-occupied apartments: 4,800
% of renters here:
50%State:
44%
March 2022 cost of living index in zip code 92405: 82.2
(low, U.S. average is 100)
Land area: 4.7
sq. mi.
Water area: 0.0
sq. mi.
Population density: 6,620 people per square mile (high).
OSM Map
General Map
Google Map
MSN Map
OSM Map
General Map
Google Map
MSN Map
OSM Map
General Map
Google Map
MSN Map
OSM Map
General Map
Google Map
MSN Map
Please wait while loading the map...
Real estate property taxes paid for housing units in 2022:
This zip code:
0.6% ($2,153)California:
0.7% ($4,831)
Median real estate property taxes paid for housing units with mortgages in 2022: $2,472 (0.7%)
Median real estate property taxes paid for housing units with no mortgage in 2022: $1,858 (0.5%)
Profiles of local businesses
Business Search - 14 Million verified businesses
Males: 15,656 Females: 15,631
For population 25 years and over in 92405:
High school or higher: 72.1%Bachelor's degree or higher: 13.7%Graduate or professional degree: 5.5%Unemployed: 7.1%Mean travel time to work (commute): 28.2 minutes
For population 15 years and over in 92405:
Never married: 45.6%Now married: 39.0%Separated: 2.7%Widowed: 3.5%Divorced: 9.3%
Zip code 92405 compared to state average:
Median household income below state average. Median house value below state average. Black race population percentage above state average. Median age below state average. House age above state average. Percentage of population with a bachelor's degree or higher significantly below state average. 20,707 66.2% Hispanic or Latino 5,165 16.5% White 3,650 11.7% Black 964 3.1% Asian 723 2.3% Two or more races 62 0.2% Some other race 12 0.04% American Indian
Data:
Median household income ($)
Median household income (% change since 2000)
Household income diversity
Ratio of average income to average house value (%)
Ratio of average income to average rent
Median household income ($) - White
Median household income ($) - Black or African American
Median household income ($) - Asian
Median household income ($) - Hispanic or Latino
Median household income ($) - American Indian and Alaska Native
Median household income ($) - Multirace
Median household income ($) - Other Race
Median household income for houses/condos with a mortgage ($)
Median household income for apartments without a mortgage ($)
Races - White alone (%)
Races - White alone (% change since 2000)
Races - Black alone (%)
Races - Black alone (% change since 2000)
Races - American Indian alone (%)
Races - American Indian alone (% change since 2000)
Races - Asian alone (%)
Races - Asian alone (% change since 2000)
Races - Hispanic (%)
Races - Hispanic (% change since 2000)
Races - Native Hawaiian and Other Pacific Islander alone (%)
Races - Native Hawaiian and Other Pacific Islander alone (% change since 2000)
Races - Two or more races (%)
Races - Two or more races (% change since 2000)
Races - Other race alone (%)
Races - Other race alone (% change since 2000)
Racial diversity
Unemployment (%)
Unemployment (% change since 2000)
Unemployment (%) - White
Unemployment (%) - Black or African American
Unemployment (%) - Asian
Unemployment (%) - Hispanic or Latino
Unemployment (%) - American Indian and Alaska Native
Unemployment (%) - Multirace
Unemployment (%) - Other Race
Population density (people per square mile)
Population - Males (%)
Population - Females (%)
Population - Males (%) - White
Population - Males (%) - Black or African American
Population - Males (%) - Asian
Population - Males (%) - Hispanic or Latino
Population - Males (%) - American Indian and Alaska Native
Population - Males (%) - Multirace
Population - Males (%) - Other Race
Population - Females (%) - White
Population - Females (%) - Black or African American
Population - Females (%) - Asian
Population - Females (%) - Hispanic or Latino
Population - Females (%) - American Indian and Alaska Native
Population - Females (%) - Multirace
Population - Females (%) - Other Race
Coronavirus confirmed cases (Apr 27, 2024)
Deaths caused by coronavirus (Apr 27, 2024)
Coronavirus confirmed cases (per 100k population) (Apr 27, 2024)
Deaths caused by coronavirus (per 100k population) (Apr 27, 2024)
Daily increase in number of cases (Apr 27, 2024)
Weekly increase in number of cases (Apr 27, 2024)
Cases doubled (in days) (Apr 27, 2024)
Hospitalized patients (Apr 18, 2022)
Negative test results (Apr 18, 2022)
Total test results (Apr 18, 2022)
COVID Vaccine doses distributed (per 100k population) (Sep 19, 2023)
COVID Vaccine doses administered (per 100k population) (Sep 19, 2023)
COVID Vaccine doses distributed (Sep 19, 2023)
COVID Vaccine doses administered (Sep 19, 2023)
Likely homosexual households (%)
Likely homosexual households (% change since 2000)
Likely homosexual households - Lesbian couples (%)
Likely homosexual households - Lesbian couples (% change since 2000)
Likely homosexual households - Gay men (%)
Likely homosexual households - Gay men (% change since 2000)
Cost of living index
Median gross rent ($)
Median contract rent ($)
Median monthly housing costs ($)
Median house or condo value ($)
Median house or condo value ($ change since 2000)
Mean house or condo value by units in structure - 1, detached ($)
Mean house or condo value by units in structure - 1, attached ($)
Mean house or condo value by units in structure - 2 ($)
Mean house or condo value by units in structure by units in structure - 3 or 4 ($)
Mean house or condo value by units in structure - 5 or more ($)
Mean house or condo value by units in structure - Boat, RV, van, etc. ($)
Mean house or condo value by units in structure - Mobile home ($)
Median house or condo value ($) - White
Median house or condo value ($) - Black or African American
Median house or condo value ($) - Asian
Median house or condo value ($) - Hispanic or Latino
Median house or condo value ($) - American Indian and Alaska Native
Median house or condo value ($) - Multirace
Median house or condo value ($) - Other Race
Median resident age
Resident age diversity
Median resident age - Males
Median resident age - Females
Median resident age - White
Median resident age - Black or African American
Median resident age - Asian
Median resident age - Hispanic or Latino
Median resident age - American Indian and Alaska Native
Median resident age - Multirace
Median resident age - Other Race
Median resident age - Males - White
Median resident age - Males - Black or African American
Median resident age - Males - Asian
Median resident age - Males - Hispanic or Latino
Median resident age - Males - American Indian and Alaska Native
Median resident age - Males - Multirace
Median resident age - Males - Other Race
Median resident age - Females - White
Median resident age - Females - Black or African American
Median resident age - Females - Asian
Median resident age - Females - Hispanic or Latino
Median resident age - Females - American Indian and Alaska Native
Median resident age - Females - Multirace
Median resident age - Females - Other Race
Commute - mean travel time to work (minutes)
Travel time to work - Less than 5 minutes (%)
Travel time to work - Less than 5 minutes (% change since 2000)
Travel time to work - 5 to 9 minutes (%)
Travel time to work - 5 to 9 minutes (% change since 2000)
Travel time to work - 10 to 19 minutes (%)
Travel time to work - 10 to 19 minutes (% change since 2000)
Travel time to work - 20 to 29 minutes (%)
Travel time to work - 20 to 29 minutes (% change since 2000)
Travel time to work - 30 to 39 minutes (%)
Travel time to work - 30 to 39 minutes (% change since 2000)
Travel time to work - 40 to 59 minutes (%)
Travel time to work - 40 to 59 minutes (% change since 2000)
Travel time to work - 60 to 89 minutes (%)
Travel time to work - 60 to 89 minutes (% change since 2000)
Travel time to work - 90 or more minutes (%)
Travel time to work - 90 or more minutes (% change since 2000)
Marital status - Never married (%)
Marital status - Now married (%)
Marital status - Separated (%)
Marital status - Widowed (%)
Marital status - Divorced (%)
Median family income ($)
Median family income (% change since 2000)
Median non-family income ($)
Median non-family income (% change since 2000)
Median per capita income ($)
Median per capita income (% change since 2000)
Median family income ($) - White
Median family income ($) - Black or African American
Median family income ($) - Asian
Median family income ($) - Hispanic or Latino
Median family income ($) - American Indian and Alaska Native
Median family income ($) - Multirace
Median family income ($) - Other Race
Median year house/condo built
Median year apartment built
Year house built - Built 2005 or later (%)
Year house built - Built 2000 to 2004 (%)
Year house built - Built 1990 to 1999 (%)
Year house built - Built 1980 to 1989 (%)
Year house built - Built 1970 to 1979 (%)
Year house built - Built 1960 to 1969 (%)
Year house built - Built 1950 to 1959 (%)
Year house built - Built 1940 to 1949 (%)
Year house built - Built 1939 or earlier (%)
Average household size
Household density (households per square mile)
Average household size - White
Average household size - Black or African American
Average household size - Asian
Average household size - Hispanic or Latino
Average household size - American Indian and Alaska Native
Average household size - Multirace
Average household size - Other Race
Occupied housing units (%)
Vacant housing units (%)
Owner occupied housing units (%)
Renter occupied housing units (%)
Vacancy status - For rent (%)
Vacancy status - For sale only (%)
Vacancy status - Rented or sold, not occupied (%)
Vacancy status - For seasonal, recreational, or occasional use (%)
Vacancy status - For migrant workers (%)
Vacancy status - Other vacant (%)
Residents with income below the poverty level (%)
Residents with income below 50% of the poverty level (%)
Children below poverty level (%)
Poor families by family type - Married-couple family (%)
Poor families by family type - Male, no wife present (%)
Poor families by family type - Female, no husband present (%)
Poverty status for native-born residents (%)
Poverty status for foreign-born residents (%)
Poverty among high school graduates not in families (%)
Poverty among people who did not graduate high school not in families (%)
Residents with income below the poverty level (%) - White
Residents with income below the poverty level (%) - Black or African American
Residents with income below the poverty level (%) - Asian
Residents with income below the poverty level (%) - Hispanic or Latino
Residents with income below the poverty level (%) - American Indian and Alaska Native
Residents with income below the poverty level (%) - Multirace
Residents with income below the poverty level (%) - Other Race
Air pollution - Air Quality Index (AQI)
Air pollution - CO
Air pollution - NO2
Air pollution - SO2
Air pollution - Ozone
Air pollution - PM10
Air pollution - PM25
Air pollution - Pb
Crime - Murders per 100,000 population
Crime - Rapes per 100,000 population
Crime - Robberies per 100,000 population
Crime - Assaults per 100,000 population
Crime - Burglaries per 100,000 population
Crime - Thefts per 100,000 population
Crime - Auto thefts per 100,000 population
Crime - Arson per 100,000 population
Crime - City-data.com crime index
Crime - Violent crime index
Crime - Property crime index
Crime - Murders per 100,000 population (5 year average)
Crime - Rapes per 100,000 population (5 year average)
Crime - Robberies per 100,000 population (5 year average)
Crime - Assaults per 100,000 population (5 year average)
Crime - Burglaries per 100,000 population (5 year average)
Crime - Thefts per 100,000 population (5 year average)
Crime - Auto thefts per 100,000 population (5 year average)
Crime - Arson per 100,000 population (5 year average)
Crime - City-data.com crime index (5 year average)
Crime - Violent crime index (5 year average)
Crime - Property crime index (5 year average)
1996 Presidential Elections Results (%) - Democratic Party (Clinton)
1996 Presidential Elections Results (%) - Republican Party (Dole)
1996 Presidential Elections Results (%) - Other
2000 Presidential Elections Results (%) - Democratic Party (Gore)
2000 Presidential Elections Results (%) - Republican Party (Bush)
2000 Presidential Elections Results (%) - Other
2004 Presidential Elections Results (%) - Democratic Party (Kerry)
2004 Presidential Elections Results (%) - Republican Party (Bush)
2004 Presidential Elections Results (%) - Other
2008 Presidential Elections Results (%) - Democratic Party (Obama)
2008 Presidential Elections Results (%) - Republican Party (McCain)
2008 Presidential Elections Results (%) - Other
2012 Presidential Elections Results (%) - Democratic Party (Obama)
2012 Presidential Elections Results (%) - Republican Party (Romney)
2012 Presidential Elections Results (%) - Other
2016 Presidential Elections Results (%) - Democratic Party (Clinton)
2016 Presidential Elections Results (%) - Republican Party (Trump)
2016 Presidential Elections Results (%) - Other
2020 Presidential Elections Results (%) - Democratic Party (Biden)
2020 Presidential Elections Results (%) - Republican Party (Trump)
2020 Presidential Elections Results (%) - Other
Ancestries Reported - Arab (%)
Ancestries Reported - Czech (%)
Ancestries Reported - Danish (%)
Ancestries Reported - Dutch (%)
Ancestries Reported - English (%)
Ancestries Reported - French (%)
Ancestries Reported - French Canadian (%)
Ancestries Reported - German (%)
Ancestries Reported - Greek (%)
Ancestries Reported - Hungarian (%)
Ancestries Reported - Irish (%)
Ancestries Reported - Italian (%)
Ancestries Reported - Lithuanian (%)
Ancestries Reported - Norwegian (%)
Ancestries Reported - Polish (%)
Ancestries Reported - Portuguese (%)
Ancestries Reported - Russian (%)
Ancestries Reported - Scotch-Irish (%)
Ancestries Reported - Scottish (%)
Ancestries Reported - Slovak (%)
Ancestries Reported - Subsaharan African (%)
Ancestries Reported - Swedish (%)
Ancestries Reported - Swiss (%)
Ancestries Reported - Ukrainian (%)
Ancestries Reported - United States (%)
Ancestries Reported - Welsh (%)
Ancestries Reported - West Indian (%)
Ancestries Reported - Other (%)
Educational Attainment - No schooling completed (%)
Educational Attainment - Less than high school (%)
Educational Attainment - High school or equivalent (%)
Educational Attainment - Less than 1 year of college (%)
Educational Attainment - 1 or more years of college (%)
Educational Attainment - Associate degree (%)
Educational Attainment - Bachelor's degree (%)
Educational Attainment - Master's degree (%)
Educational Attainment - Professional school degree (%)
Educational Attainment - Doctorate degree (%)
School Enrollment - Nursery, preschool (%)
School Enrollment - Kindergarten (%)
School Enrollment - Grade 1 to 4 (%)
School Enrollment - Grade 5 to 8 (%)
School Enrollment - Grade 9 to 12 (%)
School Enrollment - College undergrad (%)
School Enrollment - Graduate or professional (%)
School Enrollment - Not enrolled in school (%)
School enrollment - Public schools (%)
School enrollment - Private schools (%)
School enrollment - Not enrolled (%)
Median number of rooms in houses and condos
Median number of rooms in apartments
Housing units lacking complete plumbing facilities (%)
Housing units lacking complete kitchen facilities (%)
Density of houses
Urban houses (%)
Rural houses (%)
Households with people 60 years and over (%)
Households with people 65 years and over (%)
Households with people 75 years and over (%)
Households with one or more nonrelatives (%)
Households with no nonrelatives (%)
Population in households (%)
Family households (%)
Nonfamily households (%)
Population in families (%)
Family households with own children (%)
Median number of bedrooms in owner occupied houses
Mean number of bedrooms in owner occupied houses
Median number of bedrooms in renter occupied houses
Mean number of bedrooms in renter occupied houses
Median number of vehichles in owner occupied houses
Mean number of vehichles in owner occupied houses
Median number of vehichles in renter occupied houses
Mean number of vehichles in renter occupied houses
Mortgage status - with mortgage (%)
Mortgage status - with second mortgage (%)
Mortgage status - with home equity loan (%)
Mortgage status - with both second mortgage and home equity loan (%)
Mortgage status - without a mortgage (%)
Average family size
Average family size - White
Average family size - Black or African American
Average family size - Asian
Average family size - Hispanic or Latino
Average family size - American Indian and Alaska Native
Average family size - Multirace
Average family size - Other Race
Geographical mobility - Same house 1 year ago (%)
Geographical mobility - Moved within same county (%)
Geographical mobility - Moved from different county within same state (%)
Geographical mobility - Moved from different state (%)
Geographical mobility - Moved from abroad (%)
Place of birth - Born in state of residence (%)
Place of birth - Born in other state (%)
Place of birth - Native, outside of US (%)
Place of birth - Foreign born (%)
Housing units in structures - 1, detached (%)
Housing units in structures - 1, attached (%)
Housing units in structures - 2 (%)
Housing units in structures - 3 or 4 (%)
Housing units in structures - 5 to 9 (%)
Housing units in structures - 10 to 19 (%)
Housing units in structures - 20 to 49 (%)
Housing units in structures - 50 or more (%)
Housing units in structures - Mobile home (%)
Housing units in structures - Boat, RV, van, etc. (%)
House/condo owner moved in on average (years ago)
Renter moved in on average (years ago)
Year householder moved into unit - Moved in 1999 to March 2000 (%)
Year householder moved into unit - Moved in 1995 to 1998 (%)
Year householder moved into unit - Moved in 1990 to 1994 (%)
Year householder moved into unit - Moved in 1980 to 1989 (%)
Year householder moved into unit - Moved in 1970 to 1979 (%)
Year householder moved into unit - Moved in 1969 or earlier (%)
Means of transportation to work - Drove car alone (%)
Means of transportation to work - Carpooled (%)
Means of transportation to work - Public transportation (%)
Means of transportation to work - Bus or trolley bus (%)
Means of transportation to work - Streetcar or trolley car (%)
Means of transportation to work - Subway or elevated (%)
Means of transportation to work - Railroad (%)
Means of transportation to work - Ferryboat (%)
Means of transportation to work - Taxicab (%)
Means of transportation to work - Motorcycle (%)
Means of transportation to work - Bicycle (%)
Means of transportation to work - Walked (%)
Means of transportation to work - Other means (%)
Working at home (%)
Industry diversity
Most Common Industries - Agriculture, forestry, fishing and hunting, and mining (%)
Most Common Industries - Agriculture, forestry, fishing and hunting (%)
Most Common Industries - Mining, quarrying, and oil and gas extraction (%)
Most Common Industries - Construction (%)
Most Common Industries - Manufacturing (%)
Most Common Industries - Wholesale trade (%)
Most Common Industries - Retail trade (%)
Most Common Industries - Transportation and warehousing, and utilities (%)
Most Common Industries - Transportation and warehousing (%)
Most Common Industries - Utilities (%)
Most Common Industries - Information (%)
Most Common Industries - Finance and insurance, and real estate and rental and leasing (%)
Most Common Industries - Finance and insurance (%)
Most Common Industries - Real estate and rental and leasing (%)
Most Common Industries - Professional, scientific, and management, and administrative and waste management services (%)
Most Common Industries - Professional, scientific, and technical services (%)
Most Common Industries - Management of companies and enterprises (%)
Most Common Industries - Administrative and support and waste management services (%)
Most Common Industries - Educational services, and health care and social assistance (%)
Most Common Industries - Educational services (%)
Most Common Industries - Health care and social assistance (%)
Most Common Industries - Arts, entertainment, and recreation, and accommodation and food services (%)
Most Common Industries - Arts, entertainment, and recreation (%)
Most Common Industries - Accommodation and food services (%)
Most Common Industries - Other services, except public administration (%)
Most Common Industries - Public administration (%)
Occupation diversity
Most Common Occupations - Management, business, science, and arts occupations (%)
Most Common Occupations - Management, business, and financial occupations (%)
Most Common Occupations - Management occupations (%)
Most Common Occupations - Business and financial operations occupations (%)
Most Common Occupations - Computer, engineering, and science occupations (%)
Most Common Occupations - Computer and mathematical occupations (%)
Most Common Occupations - Architecture and engineering occupations (%)
Most Common Occupations - Life, physical, and social science occupations (%)
Most Common Occupations - Education, legal, community service, arts, and media occupations (%)
Most Common Occupations - Community and social service occupations (%)
Most Common Occupations - Legal occupations (%)
Most Common Occupations - Education, training, and library occupations (%)
Most Common Occupations - Arts, design, entertainment, sports, and media occupations (%)
Most Common Occupations - Healthcare practitioners and technical occupations (%)
Most Common Occupations - Health diagnosing and treating practitioners and other technical occupations (%)
Most Common Occupations - Health technologists and technicians (%)
Most Common Occupations - Service occupations (%)
Most Common Occupations - Healthcare support occupations (%)
Most Common Occupations - Protective service occupations (%)
Most Common Occupations - Fire fighting and prevention, and other protective service workers including supervisors (%)
Most Common Occupations - Law enforcement workers including supervisors (%)
Most Common Occupations - Food preparation and serving related occupations (%)
Most Common Occupations - Building and grounds cleaning and maintenance occupations (%)
Most Common Occupations - Personal care and service occupations (%)
Most Common Occupations - Sales and office occupations (%)
Most Common Occupations - Sales and related occupations (%)
Most Common Occupations - Office and administrative support occupations (%)
Most Common Occupations - Natural resources, construction, and maintenance occupations (%)
Most Common Occupations - Farming, fishing, and forestry occupations (%)
Most Common Occupations - Construction and extraction occupations (%)
Most Common Occupations - Installation, maintenance, and repair occupations (%)
Most Common Occupations - Production, transportation, and material moving occupations (%)
Most Common Occupations - Production occupations (%)
Most Common Occupations - Transportation occupations (%)
Most Common Occupations - Material moving occupations (%)
People in Group quarters - Institutionalized population (%)
People in Group quarters - Correctional institutions (%)
People in Group quarters - Federal prisons and detention centers (%)
People in Group quarters - Halfway houses (%)
People in Group quarters - Local jails and other confinement facilities (including police lockups) (%)
People in Group quarters - Military disciplinary barracks (%)
People in Group quarters - State prisons (%)
People in Group quarters - Other types of correctional institutions (%)
People in Group quarters - Nursing homes (%)
People in Group quarters - Hospitals/wards, hospices, and schools for the handicapped (%)
People in Group quarters - Hospitals/wards and hospices for chronically ill (%)
People in Group quarters - Hospices or homes for chronically ill (%)
People in Group quarters - Military hospitals or wards for chronically ill (%)
People in Group quarters - Other hospitals or wards for chronically ill (%)
People in Group quarters - Hospitals or wards for drug/alcohol abuse (%)
People in Group quarters - Mental (Psychiatric) hospitals or wards (%)
People in Group quarters - Schools, hospitals, or wards for the mentally retarded (%)
People in Group quarters - Schools, hospitals, or wards for the physically handicapped (%)
People in Group quarters - Institutions for the deaf (%)
People in Group quarters - Institutions for the blind (%)
People in Group quarters - Orthopedic wards and institutions for the physically handicapped (%)
People in Group quarters - Wards in general hospitals for patients who have no usual home elsewhere (%)
People in Group quarters - Wards in military hospitals for patients who have no usual home elsewhere (%)
People in Group quarters - Juvenile institutions (%)
People in Group quarters - Long-term care (%)
People in Group quarters - Homes for abused, dependent, and neglected children (%)
People in Group quarters - Residential treatment centers for emotionally disturbed children (%)
People in Group quarters - Training schools for juvenile delinquents (%)
People in Group quarters - Short-term care, detention or diagnostic centers for delinquent children (%)
People in Group quarters - Type of juvenile institution unknown (%)
People in Group quarters - Noninstitutionalized population (%)
People in Group quarters - College dormitories (includes college quarters off campus) (%)
People in Group quarters - Military quarters (%)
People in Group quarters - On base (%)
People in Group quarters - Barracks, unaccompanied personnel housing (UPH), (Enlisted/Officer), ;and similar group living quarters for military personnel (%)
People in Group quarters - Transient quarters for temporary residents (%)
People in Group quarters - Military ships (%)
People in Group quarters - Group homes (%)
People in Group quarters - Homes or halfway houses for drug/alcohol abuse (%)
People in Group quarters - Homes for the mentally ill (%)
People in Group quarters - Homes for the mentally retarded (%)
People in Group quarters - Homes for the physically handicapped (%)
People in Group quarters - Other group homes (%)
People in Group quarters - Religious group quarters (%)
People in Group quarters - Dormitories (%)
People in Group quarters - Agriculture workers' dormitories on farms (%)
People in Group quarters - Job Corps and vocational training facilities (%)
People in Group quarters - Other workers' dormitories (%)
People in Group quarters - Crews of maritime vessels (%)
People in Group quarters - Other nonhousehold living situations (%)
People in Group quarters - Other noninstitutional group quarters (%)
Residents speaking English at home (%)
Residents speaking English at home - Born in the United States (%)
Residents speaking English at home - Native, born elsewhere (%)
Residents speaking English at home - Foreign born (%)
Residents speaking Spanish at home (%)
Residents speaking Spanish at home - Born in the United States (%)
Residents speaking Spanish at home - Native, born elsewhere (%)
Residents speaking Spanish at home - Foreign born (%)
Residents speaking other language at home (%)
Residents speaking other language at home - Born in the United States (%)
Residents speaking other language at home - Native, born elsewhere (%)
Residents speaking other language at home - Foreign born (%)
Class of Workers - Employee of private company (%)
Class of Workers - Self-employed in own incorporated business (%)
Class of Workers - Private not-for-profit wage and salary workers (%)
Class of Workers - Local government workers (%)
Class of Workers - State government workers (%)
Class of Workers - Federal government workers (%)
Class of Workers - Self-employed workers in own not incorporated business and Unpaid family workers (%)
House heating fuel used in houses and condos - Utility gas (%)
House heating fuel used in houses and condos - Bottled, tank, or LP gas (%)
House heating fuel used in houses and condos - Electricity (%)
House heating fuel used in houses and condos - Fuel oil, kerosene, etc. (%)
House heating fuel used in houses and condos - Coal or coke (%)
House heating fuel used in houses and condos - Wood (%)
House heating fuel used in houses and condos - Solar energy (%)
House heating fuel used in houses and condos - Other fuel (%)
House heating fuel used in houses and condos - No fuel used (%)
House heating fuel used in apartments - Utility gas (%)
House heating fuel used in apartments - Bottled, tank, or LP gas (%)
House heating fuel used in apartments - Electricity (%)
House heating fuel used in apartments - Fuel oil, kerosene, etc. (%)
House heating fuel used in apartments - Coal or coke (%)
House heating fuel used in apartments - Wood (%)
House heating fuel used in apartments - Solar energy (%)
House heating fuel used in apartments - Other fuel (%)
House heating fuel used in apartments - No fuel used (%)
Armed forces status - In Armed Forces (%)
Armed forces status - Civilian (%)
Armed forces status - Civilian - Veteran (%)
Armed forces status - Civilian - Nonveteran (%)
Fatal accidents locations in years 2005-2021
Fatal accidents locations in 2005
Fatal accidents locations in 2006
Fatal accidents locations in 2007
Fatal accidents locations in 2008
Fatal accidents locations in 2009
Fatal accidents locations in 2010
Fatal accidents locations in 2011
Fatal accidents locations in 2012
Fatal accidents locations in 2013
Fatal accidents locations in 2014
Fatal accidents locations in 2015
Fatal accidents locations in 2016
Fatal accidents locations in 2017
Fatal accidents locations in 2018
Fatal accidents locations in 2019
Fatal accidents locations in 2020
Fatal accidents locations in 2021
Alcohol use - People drinking some alcohol every month (%)
Alcohol use - People not drinking at all (%)
Alcohol use - Average days/month drinking alcohol
Alcohol use - Average drinks/week
Alcohol use - Average days/year people drink much
Audiometry - Average condition of hearing (%)
Audiometry - People that can hear a whisper from across a quiet room (%)
Audiometry - People that can hear normal voice from across a quiet room (%)
Audiometry - Ears ringing, roaring, buzzing (%)
Audiometry - Had a job exposure to loud noise (%)
Audiometry - Had off-work exposure to loud noise (%)
Blood Pressure & Cholesterol - Has high blood pressure (%)
Blood Pressure & Cholesterol - Checking blood pressure at home (%)
Blood Pressure & Cholesterol - Frequently checking blood cholesterol (%)
Blood Pressure & Cholesterol - Has high cholesterol level (%)
Consumer Behavior - Money monthly spent on food at supermarket/grocery store
Consumer Behavior - Money monthly spent on food at other stores
Consumer Behavior - Money monthly spent on eating out
Consumer Behavior - Money monthly spent on carryout/delivered foods
Consumer Behavior - Income spent on food at supermarket/grocery store (%)
Consumer Behavior - Income spent on food at other stores (%)
Consumer Behavior - Income spent on eating out (%)
Consumer Behavior - Income spent on carryout/delivered foods (%)
Current Health Status - General health condition (%)
Current Health Status - Blood donors (%)
Current Health Status - Has blood ever tested for HIV virus (%)
Current Health Status - Left-handed people (%)
Dermatology - People using sunscreen (%)
Diabetes - Diabetics (%)
Diabetes - Had a blood test for high blood sugar (%)
Diabetes - People taking insulin (%)
Diet Behavior & Nutrition - Diet health (%)
Diet Behavior & Nutrition - Milk product consumption (# of products/month)
Diet Behavior & Nutrition - Meals not home prepared (#/week)
Diet Behavior & Nutrition - Meals from fast food or pizza place (#/week)
Diet Behavior & Nutrition - Ready-to-eat foods (#/month)
Diet Behavior & Nutrition - Frozen meals/pizza (#/month)
Drug Use - People that ever used marijuana or hashish (%)
Drug Use - Ever used hard drugs (%)
Drug Use - Ever used any form of cocaine (%)
Drug Use - Ever used heroin (%)
Drug Use - Ever used methamphetamine (%)
Health Insurance - People covered by health insurance (%)
Kidney Conditions-Urology - Avg. # of times urinating at night
Medical Conditions - People with asthma (%)
Medical Conditions - People with anemia (%)
Medical Conditions - People with psoriasis (%)
Medical Conditions - People with overweight (%)
Medical Conditions - Elderly people having difficulties in thinking or remembering (%)
Medical Conditions - People who ever received blood transfusion (%)
Medical Conditions - People having trouble seeing even with glass/contacts (%)
Medical Conditions - People with arthritis (%)
Medical Conditions - People with gout (%)
Medical Conditions - People with congestive heart failure (%)
Medical Conditions - People with coronary heart disease (%)
Medical Conditions - People with angina pectoris (%)
Medical Conditions - People who ever had heart attack (%)
Medical Conditions - People who ever had stroke (%)
Medical Conditions - People with emphysema (%)
Medical Conditions - People with thyroid problem (%)
Medical Conditions - People with chronic bronchitis (%)
Medical Conditions - People with any liver condition (%)
Medical Conditions - People who ever had cancer or malignancy (%)
Mental Health - People who have little interest in doing things (%)
Mental Health - People feeling down, depressed, or hopeless (%)
Mental Health - People who have trouble sleeping or sleeping too much (%)
Mental Health - People feeling tired or having little energy (%)
Mental Health - People with poor appetite or overeating (%)
Mental Health - People feeling bad about themself (%)
Mental Health - People who have trouble concentrating on things (%)
Mental Health - People moving or speaking slowly or too fast (%)
Mental Health - People having thoughts they would be better off dead (%)
Oral Health - Average years since last visit a dentist
Oral Health - People embarrassed because of mouth (%)
Oral Health - People with gum disease (%)
Oral Health - General health of teeth and gums (%)
Oral Health - Average days a week using dental floss/device
Oral Health - Average days a week using mouthwash for dental problem
Oral Health - Average number of teeth
Pesticide Use - Households using pesticides to control insects (%)
Pesticide Use - Households using pesticides to kill weeds (%)
Physical Activity - People doing vigorous-intensity work activities (%)
Physical Activity - People doing moderate-intensity work activities (%)
Physical Activity - People walking or bicycling (%)
Physical Activity - People doing vigorous-intensity recreational activities (%)
Physical Activity - People doing moderate-intensity recreational activities (%)
Physical Activity - Average hours a day doing sedentary activities
Physical Activity - Average hours a day watching TV or videos
Physical Activity - Average hours a day using computer
Physical Functioning - People having limitations keeping them from working (%)
Physical Functioning - People limited in amount of work they can do (%)
Physical Functioning - People that need special equipment to walk (%)
Physical Functioning - People experiencing confusion/memory problems (%)
Physical Functioning - People requiring special healthcare equipment (%)
Prescription Medications - Average number of prescription medicines taking
Preventive Aspirin Use - Adults 40+ taking low-dose aspirin (%)
Reproductive Health - Vaginal deliveries (%)
Reproductive Health - Cesarean deliveries (%)
Reproductive Health - Deliveries resulted in a live birth (%)
Reproductive Health - Pregnancies resulted in a delivery (%)
Reproductive Health - Women breastfeeding newborns (%)
Reproductive Health - Women that had a hysterectomy (%)
Reproductive Health - Women that had both ovaries removed (%)
Reproductive Health - Women that have ever taken birth control pills (%)
Reproductive Health - Women taking birth control pills (%)
Reproductive Health - Women that have ever used Depo-Provera or injectables (%)
Reproductive Health - Women that have ever used female hormones (%)
Sexual Behavior - People 18+ that ever had sex (vaginal, anal, or oral) (%)
Sexual Behavior - Males 18+ that ever had vaginal sex with a woman (%)
Sexual Behavior - Males 18+ that ever performed oral sex on a woman (%)
Sexual Behavior - Males 18+ that ever had anal sex with a woman (%)
Sexual Behavior - Males 18+ that ever had any sex with a man (%)
Sexual Behavior - Females 18+ that ever had vaginal sex with a man (%)
Sexual Behavior - Females 18+ that ever performed oral sex on a man (%)
Sexual Behavior - Females 18+ that ever had anal sex with a man (%)
Sexual Behavior - Females 18+ that ever had any kind of sex with a woman (%)
Sexual Behavior - Average age people first had sex
Sexual Behavior - Average number of female sex partners in lifetime (males 18+)
Sexual Behavior - Average number of female vaginal sex partners in lifetime (males 18+)
Sexual Behavior - Average age people first performed oral sex on a woman (18+)
Sexual Behavior - Average number of woman performed oral sex on in lifetime (18+)
Sexual Behavior - Average number of male sex partners in lifetime (males 18+)
Sexual Behavior - Average number of male anal sex partners in lifetime (males 18+)
Sexual Behavior - Average age people first performed oral sex on a man (18+)
Sexual Behavior - Average number of male oral sex partners in lifetime (18+)
Sexual Behavior - People using protection when performing oral sex (%)
Sexual Behavior - Average number of times people have vaginal or anal sex a year
Sexual Behavior - People having sex without condom (%)
Sexual Behavior - Average number of male sex partners in lifetime (females 18+)
Sexual Behavior - Average number of male vaginal sex partners in lifetime (females 18+)
Sexual Behavior - Average number of female sex partners in lifetime (females 18+)
Sexual Behavior - Circumcised males 18+ (%)
Sleep Disorders - Average hours sleeping at night
Sleep Disorders - People that has trouble sleeping (%)
Smoking-Cigarette Use - People smoking cigarettes (%)
Taste & Smell - People 40+ having problems with smell (%)
Taste & Smell - People 40+ having problems with taste (%)
Taste & Smell - People 40+ that ever had wisdom teeth removed (%)
Taste & Smell - People 40+ that ever had tonsils teeth removed (%)
Taste & Smell - People 40+ that ever had a loss of consciousness because of a head injury (%)
Taste & Smell - People 40+ that ever had a broken nose or other serious injury to face or skull (%)
Taste & Smell - People 40+ that ever had two or more sinus infections (%)
Weight - Average height (inches)
Weight - Average weight (pounds)
Weight - Average BMI
Weight - People that are obese (%)
Weight - People that ever were obese (%)
Weight - People trying to lose weight (%)
100%
urban population.
Estimated median house/condo value in 2022: $366,257
92405:
$366,257California:
$715,900
Median resident age: This zip code:
30.4 yearsCalifornia median age:
37.9 years
Average household size: This zip code:
3.3 peopleCalifornia:
2.8 people
Averages for the 2020 tax year for zip code 92405, filed in 2021:
Average Adjusted Gross Income (AGI) in 2020: $39,403 (Individual Income Tax Returns) Here:
$39,403State:
$95,910
Salary/wage: $36,850 (reported on 85.9% of returns )Here:
$36,850State:
$77,331
(% of AGI for various income ranges: 1193.6% for AGIs below $25k , 4002.3% for AGIs $25k-50k , 7403.2% for AGIs $50k-75k , 10495.5% for AGIs $75k-100k , 17974.6% for AGIs $100k-200k ) Taxable interest for individuals: $361 (reported on 19.1% of returns )This zip code:
$361California:
$2,294
(% of AGI for various income ranges: 2.5% for AGIs below $25k , 4.3% for AGIs $25k-50k , 12.3% for AGIs $50k-75k , 17.7% for AGIs $75k-100k , 73.4% for AGIs $100k-200k ) Ordinary dividends: $2,738 (reported on 3.4% of returns )(% of AGI for various income ranges: 3.7% for AGIs below $25k , 4.9% for AGIs $25k-50k , 10.8% for AGIs $50k-75k , 13.6% for AGIs $75k-100k , 208.6% for AGIs $100k-200k ) Net capital gain/loss in AGI: +$6,907 (reported on 4.0% of returns )Here:
+$6,907State:
+$49,306
(% of AGI for various income ranges: 1.8% for AGIs below $25k , 3.7% for AGIs $25k-50k , 10.2% for AGIs $50k-75k , 14.5% for AGIs $75k-100k , 354.3% for AGIs $100k-200k ) Profit/loss from business: +$6,909 (reported on 15.3% of returns )Here:
+$6,909State:
+$15,671
(% of AGI for various income ranges: 158.5% for AGIs below $25k , 101.6% for AGIs $25k-50k , 137.6% for AGIs $50k-75k , 158.5% for AGIs $75k-100k , 377.7% for AGIs $100k-200k ) Taxable individual retirement arrangement distribution: $12,844 (reported on 1.9% of returns )92405:
$12,844California:
$23,505
(% of AGI for various income ranges: 10.4% for AGIs below $25k , 17.4% for AGIs $25k-50k , 38.1% for AGIs $50k-75k , 69.5% for AGIs $75k-100k , 392.0% for AGIs $100k-200k ) Total itemized deductions: $24,423 (reported on 6.9% of returns )Here:
$24,423State:
$39,517
(% of AGI for various income ranges: 28.4% for AGIs below $25k , 137.2% for AGIs $25k-50k , 474.1% for AGIs $50k-75k , 743.6% for AGIs $75k-100k , 1354.3% for AGIs $100k-200k ) Charity contributions: $5,105 (reported on 5.2% of returns )(% of AGI for various income ranges: 3.4% for AGIs below $25k , 15.6% for AGIs $25k-50k , 61.4% for AGIs $50k-75k , 114.2% for AGIs $75k-100k , 312.9% for AGIs $100k-200k ) Taxes paid: $7,500 (reported on 6.8% of returns )(% of AGI for various income ranges: 5.6% for AGIs below $25k , 37.2% for AGIs $25k-50k , 143.4% for AGIs $50k-75k , 236.8% for AGIs $75k-100k , 490.9% for AGIs $100k-200k ) Earned income credit: $2,478 (reported on 28.4% of returns )(% of AGI for various income ranges: 146.3% for AGIs below $25k , 97.7% for AGIs $25k-50k , 1.9% for AGIs $50k-75k ) Percentage of individuals using paid preparers for their 2020 taxes: 92.7%(% for various income ranges: 91.6% for AGIs below $25k , 93.5% for AGIs $25k-50k , 93.6% for AGIs $50k-75k , 92.7% for AGIs $75k-100k , 93.9% for AGIs $100k-200k , 83.3% for AGIs over 200k )
Averages for the 2012 tax year for zip code 92405, filed in 2013:
Average Adjusted Gross Income (AGI) in 2012: $31,029 (Individual Income Tax Returns) Here:
$31,029State:
$72,726
Salary/wage: $29,321 (reported on 84.0% of returns )Here:
$29,321State:
$59,079
(% of AGI for various income ranges: 74.7% for AGIs below $25k , 85.6% for AGIs $25k-50k , 83.8% for AGIs $50k-75k , 79.3% for AGIs $75k-100k , 80.8% for AGIs $100k-200k ) Taxable interest for individuals: $530 (reported on 18.8% of returns )This zip code:
$530California:
$2,146
(% of AGI for various income ranges: 0.2% for AGIs below $25k , 0.2% for AGIs $25k-50k , 0.5% for AGIs $50k-75k , 0.3% for AGIs $75k-100k , 0.7% for AGIs $100k-200k ) Ordinary dividends: $2,794 (reported on 4.5% of returns )(% of AGI for various income ranges: 0.2% for AGIs below $25k , 0.3% for AGIs $25k-50k , 0.4% for AGIs $50k-75k , 0.4% for AGIs $75k-100k , 1.3% for AGIs $100k-200k ) Net capital gain/loss in AGI: +$924 (reported on 3.1% of returns )(% of AGI for various income ranges: 1.0% for AGIs $100k-200k ) Profit/loss from business: +$8,621 (reported on 17.4% of returns )Here:
+$8,621State:
+$17,064
(% of AGI for various income ranges: 15.7% for AGIs below $25k , 1.9% for AGIs $25k-50k , 1.2% for AGIs $50k-75k , 1.5% for AGIs $75k-100k , 1.2% for AGIs $100k-200k ) Taxable individual retirement arrangement distribution: $10,135 (reported on 3.1% of returns )92405:
$10,135California:
$19,557
(% of AGI for various income ranges: 0.6% for AGIs below $25k , 0.9% for AGIs $25k-50k , 0.8% for AGIs $50k-75k , 1.5% for AGIs $75k-100k , 2.3% for AGIs $100k-200k ) Total itemized deductions: $18,748 (31% of AGI, reported on 20.4% of returns )Here:
$18,748State:
$34,004
Here:
30.6% of AGIState:
22.7% of AGI
(% of AGI for various income ranges: 4.1% for AGIs below $25k , 11.2% for AGIs $25k-50k , 15.3% for AGIs $50k-75k , 18.0% for AGIs $75k-100k , 24.1% for AGIs $100k-200k ) Charity contributions: $2,804 (reported on 16.3% of returns )(% of AGI for various income ranges: 0.3% for AGIs below $25k , 1.3% for AGIs $25k-50k , 1.9% for AGIs $50k-75k , 2.3% for AGIs $75k-100k , 3.0% for AGIs $100k-200k ) Taxes paid: $4,282 (reported on 20.3% of returns )92405:
$4,282State:
$14,448
(% of AGI for various income ranges: 0.7% for AGIs below $25k , 2.1% for AGIs $25k-50k , 3.4% for AGIs $50k-75k , 4.6% for AGIs $75k-100k , 6.9% for AGIs $100k-200k ) Earned income credit: $2,884 (reported on 40.8% of returns )(% of AGI for various income ranges: 13.5% for AGIs below $25k , 1.9% for AGIs $25k-50k ) Percentage of individuals using paid preparers for their 2012 taxes: 68.0%(% for various income ranges: 65.6% for AGIs below $25k , 70.4% for AGIs $25k-50k , 72.2% for AGIs $50k-75k , 71.7% for AGIs $75k-100k , 76.7% for AGIs $100k-200k )
Averages for the 2004 tax year for zip code 92405, filed in 2005:
Average Adjusted Gross Income (AGI) in 2004: $31,034 (Individual Income Tax Returns) Here:
$31,034State:
$58,600
Salary/wage: $29,588 (reported on 88.5% of returns )Here:
$29,588State:
$49,455
(% of AGI for various income ranges: 89.3% for AGIs below $10k , 83.6% for AGIs $10k-25k , 89.4% for AGIs $25k-50k , 88.0% for AGIs $50k-75k , 85.4% for AGIs $75k-100k , 60.4% for AGIs over 100k ) Taxable interest for individuals: $919 (reported on 25.6% of returns )This zip code:
$919California:
$2,365
(% of AGI for various income ranges: 1.5% for AGIs below $10k , 0.8% for AGIs $10k-25k , 0.6% for AGIs $25k-50k , 0.6% for AGIs $50k-75k , 0.6% for AGIs $75k-100k , 1.5% for AGIs over 100k ) Taxable dividends: $2,115 (reported on 7.0% of returns )(% of AGI for various income ranges: 0.5% for AGIs below $10k , 0.4% for AGIs $10k-25k , 0.2% for AGIs $25k-50k , 0.5% for AGIs $50k-75k , 0.3% for AGIs $75k-100k , 1.5% for AGIs over 100k ) Net capital gain/loss: +$6,512 (reported on 5.4% of returns )Here:
+$6,512State:
+$23,418
(% of AGI for various income ranges: -0.6% for AGIs below $10k , -0.1% for AGIs $10k-25k , 0.2% for AGIs $25k-50k , 0.5% for AGIs $50k-75k , 1.7% for AGIs $75k-100k , 7.3% for AGIs over 100k ) Profit/loss from business: +$7,293 (reported on 13.1% of returns )Here:
+$7,293State:
+$16,826
(% of AGI for various income ranges: 8.7% for AGIs below $10k , 6.6% for AGIs $10k-25k , 1.9% for AGIs $25k-50k , 0.7% for AGIs $50k-75k , 1.0% for AGIs $75k-100k , 6.5% for AGIs over 100k ) IRA payment deduction: $2,344 (reported on 1.2% of returns )92405:
$2,344California:
$3,192
(% of AGI for various income ranges: 0.1% for AGIs $10k-25k , 0.1% for AGIs $25k-50k , 0.1% for AGIs $50k-75k , 0.1% for AGIs $75k-100k , 0.1% for AGIs over 100k ) Self-employed pension: $13,909 (reported on 0.1% of returns )Here:
$13,909California:
$17,688
Total itemized deductions: $17,420 (32% of AGI, reported on 30.5% of returns )Here:
$17,420State:
$28,113
Here:
32.3% of AGIState:
25.3% of AGI
(% of AGI for various income ranges: 6.1% for AGIs below $10k , 8.4% for AGIs $10k-25k , 17.6% for AGIs $25k-50k , 21.9% for AGIs $50k-75k , 20.6% for AGIs $75k-100k , 19.1% for AGIs over 100k ) Charity contributions deductions: $2,555 (5% of AGI, reported on 26.7% of returns )Here:
4.6% of AGIState:
3.3% of AGI
(% of AGI for various income ranges: 0.3% for AGIs below $10k , 0.9% for AGIs $10k-25k , 2.1% for AGIs $25k-50k , 2.5% for AGIs $50k-75k , 3.1% for AGIs $75k-100k , 3.5% for AGIs over 100k ) Total tax: $3,499 (reported on 59.9% of returns )92405:
$3,499State:
$10,761
(% of AGI for various income ranges: 3.1% for AGIs below $10k , 3.0% for AGIs $10k-25k , 4.7% for AGIs $25k-50k , 7.3% for AGIs $50k-75k , 9.4% for AGIs $75k-100k , 16.4% for AGIs over 100k ) Earned income credit: $2,070 (reported on 32.9% of returns )Percentage of individuals using paid preparers for their 2004 taxes: 74.5%(% for various income ranges: 71.3% for AGIs below $10k , 77.1% for AGIs $10k-25k , 74.0% for AGIs $25k-50k , 73.3% for AGIs $50k-75k , 75.2% for AGIs $75k-100k , 77.4% for AGIs over 100k )
Estimated median household income in 2022: This zip code:
$55,069California:
$91,551
Nearest zip codes: 92411 ,
92410 ,
92401 ,
92404 ,
92408 ,
92376 .
San Bernardino Zip Code Map
Percentage of family households: This zip code:
57.1%California:
46.8%
Percentage of households with unmarried partners: This zip code:
6.9%California:
48.1%
No gay or lesbian households reported
Household received Food Stamps/SNAP in the past 12 months: 3,136Household did not receive Food Stamps/SNAP in the past 12 months: 6,815
Women who had a birth in the past 12 months: 424 (187 now married , 240 unmarried) Women who did not have a birth in the past 12 months: 7,379 (2,750 now married , 4,636 unmarried)
Housing units in zip code 92405 with a mortgage: 3,410 (164
second mortgage , 69
both second mortgage and home equity loan )
Houses without a mortgage: 10
Median monthly owner costs for units with a mortgage: $1,856
Median monthly owner costs for units without a mortgage: $409
Residents with income below the poverty level in 2022:
This zip code:
22.5%Whole state:
12.2%
Residents with income below 50% of the poverty level in 2022:
This zip code:
7.0%Whole state:
6.2%
Median number of rooms in houses and condos: Median number of rooms in apartments: Notable locations in this zip code not listed on our city pages
Click to draw/clear zip code borders Notable locations in zip code 92405: (A) , San Bernardino City Fire Department Station 224 (B) , California State Forestry and Fire Protection Department (C) . Display/hide their locations on the map
Shopping Center: (1) . Display/hide its location on the map
Churches in zip code 92405 include: (A) , Vineyard Christian Fellowship (B) , Twice Called Christian Center (C) , Trinity Lutheran Church (D) , Trinity Fellowship Church (E) , Running Water Christian Center (F) , Presbytery of Riverside (G) , Pan de Vida Iglesia (H) , Mission Africa 2000 (I) . Display/hide their locations on the map
Cemetery: (1) . Display/hide its location on the map
Reservoir: (A) . Display/hide its location on the map
Parks in zip code 92405 include: (1) , Harper Field (2) . Display/hide their locations on the map
Year house built (houses)
0 2020 or later170 2010 to 2019468 2000 to 2009404 1990 to 1999879 1980 to 19891,121 1970 to 19791,229 1960 to 19691,701 1950 to 19591,883 1940 to 19491,834 1939 or earlier
Zip code 92405 household income distribution in 2022 989 Less than $10,000325 $10,000 to $14,999292 $15,000 to $19,999423 $20,000 to $24,999411 $25,000 to $29,999545 $30,000 to $34,999576 $35,000 to $39,999547 $40,000 to $44,999436 $45,000 to $49,999622 $50,000 to $59,999926 $60,000 to $74,9991,421 $75,000 to $99,999969 $100,000 to $124,999484 $125,000 to $149,999409 $150,000 to $199,999183 $200,000 or moreEstimate of home value of owner-occupied houses/condos in 2022 in zip code 92405 20 Less than $10,0007 $20,000 to $24,99943 $25,000 to $29,99916 $30,000 to $34,99944 $40,000 to $49,99912 $60,000 to $69,99918 $80,000 to $89,99970 $100,000 to $124,99918 $125,000 to $149,9997 $150,000 to $174,99988 $175,000 to $199,999365 $200,000 to $249,999557 $250,000 to $299,9991,309 $300,000 to $399,999912 $400,000 to $499,999300 $500,000 to $749,99934 $750,000 to $999,999Rent paid by renters in 2022 in zip code 92405 15 $200 to $24912 $250 to $29917 $350 to $39916 $450 to $4992 $500 to $54944 $550 to $59962 $600 to $649104 $650 to $699112 $700 to $74981 $750 to $799406 $800 to $899414 $900 to $9991,253 $1,000 to $1,2491,003 $1,250 to $1,499781 $1,500 to $1,999139 $2,000 to $2,49930 $2,500 to $2,999166 No cash rent
Median gross rent in 2022: $1,391.
Median price asked for vacant for-sale houses and condos in 2022: $357,239.
Estimated median house (or condo) value in 2022 for: White Non-Hispanic householders: $374,450Black or African American householders: $376,908American Indian or Alaska Native householders: $497,355Asian householders: $490,800Native Hawaiian and other Pacific Islander householders: $737,429Some other race householders: $347,001Two or more races householders: $377,318Hispanic or Latino householders: $352,737Estimated median house or condo value in 2022: $366,257
92405:
$366,257California:
$715,900
Lower value quartile - upper value quartile: $293,330 - $457,006
Mean price in 2022: Detached houses: $457,462Here:
$457,462State:
$988,808
Townhouses or other attached units: $523,893Here:
$523,893State:
$838,546
In 3-to-4-unit structures: $301,033Here:
$301,033State:
$824,253
In 5-or-more-unit structures: $718,662Here:
$718,662State:
$730,996
Mobile homes: $73,194Here:
$73,194State:
$184,506
Housing units in structures:
One, detached: 6,656One, attached: 400Two: 3113 or 4: 7205 to 9: 48810 to 19: 42420 to 49: 44550 or more: 411Mobile homes: 11Boats, RVs, vans, etc.: 2Unemployment : 7.1%
Means of transportation to work in zip code 92405 76.1% 9,909 Drove a car alone14.0% 1,827 Carpooled1.0% 124 Bus or trolley bus0.1% 10 Streetcar or trolley car0.3% 33 Subway or elevated1.0% 124 Walked0.9% 121 Other means4.0% 527 Worked at homeTravel time to work (commute) in zip code 92405 276 Less than 5 minutes686 5 to 9 minutes1,415 10 to 14 minutes2,437 15 to 19 minutes1,872 20 to 24 minutes768 25 to 29 minutes1,944 30 to 34 minutes148 35 to 39 minutes404 40 to 44 minutes484 45 to 59 minutes1,065 60 to 89 minutes571 90 or more minutes
Neighborhoods in zip code 92405: Percentage of zip code residents living and working in this county: 79.8%
Household type by relationship:
Households: 31,288
Male householders: 4,266 (1,248 living alone ), Female householders: 5,288 (846 living alone )3,562 spouses (3,398 opposite-sex spouses ), 945 unmarried partners , (858 opposite-sex unmarried partners ), 11,141 children (10,529 natural , 197 adopted , 413 stepchildren ), 1,420 grandchildren , 758 brothers or sisters , 761 parents , 215 foster children , 1,498 other relatives , 1,200 non-relatives In group quarters: 115 (-1 institutionalized population )
Size of family households: 1,632 2-persons , 1,360 3-persons , 1,874 4-persons , 764 5-persons , 564 6-persons , 588 7-or-more-persons
Size of nonfamily households: 2,087 1-person , 529 2-persons , 13 3-persons , 25 4-persons , 24 5-persons , 25 6-persons
3,396 married couples with children. single-parent households (435 men , 3,596 women ).
49.9% of residents of 92405 zip code speak English at home. of residents speak Spanish at home (72% very well, 11% well, 11% not well, 6% not at all ).of residents speak other Indo-European language at home (69% very well, 6% well, 25% not well ).of residents speak Asian or Pacific Island language at home (46% very well, 37% well, 11% not well, 7% not at all ).of residents speak other language at home (78% very well, 22% not well ).
Foreign born population: 5,617 (18.0%)
(33.9%
of them are naturalized citizens )
This zip code:
18.0%Whole state:
26.7%
69% Honduras 7% Costa Rica 4% El Salvador 3% Malaysia 2% Israel 2% Mexico 1% Burma (Myanmar) 3% African 2% Irish 1% Italian 1% American 1% English 1% Arab 0% German
Year of entry for the foreign-born population
744 2010 or later 1,490 2000 to 2009 1,494 1990 to 1999 2,308 Before 1990
There are
130 Medical Specialists in Zip Code 92405 .
Major facilities with environmental interests located in this zip code:
HOME DEPOT #683 THE (1055 W 21ST ST in SAN BERNARDINO, CA)
STATE MASTER (California - Hazardous Waste Tracking) - HAZARDOU WASTE PROGRAM Small Quantity Generators, between 100 kg and 1000 kg of hazardous waste/month (Resource Conservation and Recovery Act (tracking hazardous waste)) - notification Organizations: HOME DEPOT USA (CONTACT/OPERATOR)
LINCOLN ELEMENTARY (255 W. 13TH ST. in SAN BERNARDINO, CA)
(National Center for Education Statistics) - STATE ID-6036958 Organizations: SAN BERNARDINO CITY UNIFIED (SCHOOL DISTRICT)
MARSHALL ELEMENTARY (3288 G ST. in SAN BERNARDINO, CA)
(National Center for Education Statistics) - STATE ID-6036982 Organizations: SAN BERNARDINO CITY UNIFIED (SCHOOL DISTRICT)
MUSCOY ELEMENTARY (2119 W. BLAKE ST. in SAN BERNARDINO, CA)
(National Center for Education Statistics) - STATE ID-6037048 Organizations: SAN BERNARDINO CITY UNIFIED (SCHOOL DISTRICT)
CALIFORNIA ELEMENTARY (2699 CALIFORNIA ST. in SAN BERNARDINO, CA)
(National Center for Education Statistics) - STATE ID-6036826 Organizations: SAN BERNARDINO CITY UNIFIED (SCHOOL DISTRICT)
MORRIS A BUNOW (431 W HIGHLAND AVE in SAN BERNARDINO, CA)
Small Quantity Generators, between 100 kg and 1000 kg of hazardous waste/month (Resource Conservation and Recovery Act (tracking hazardous waste)) - notification Organizations: MORRIS A BUNOW MANAGING PARTNER (CONTACT/OWNER)
, PARK JIN BANG (CONTACT/OWNER)
H STREET AUTO BODY (1228 N H ST in SAN BERNARDINO, CA)
Small Quantity Generators, between 100 kg and 1000 kg of hazardous waste/month (Resource Conservation and Recovery Act (tracking hazardous waste)) - notification Business NAICS classification: AUTOMOTIVE BODY, PAINT, AND INTERIOR REPAIR AND MAINTENANCE.Organizations: GALE BIGARTE & WHITEBREAD (CONTACT/OWNER)
INLAND EMPIRE SUSUKI (1248 N H ST in SAN BERNARDINO, CA)
Small Quantity Generators, between 100 kg and 1000 kg of hazardous waste/month (Resource Conservation and Recovery Act (tracking hazardous waste)) - notification Organizations: CARL FRIESEN (CONTACT/OWNER)
LOTZ QUALITY DRAPERY CLEANERS (1269 N D ST in SAN BERNARDINO, CA)
Small Quantity Generators, between 100 kg and 1000 kg of hazardous waste/month (Resource Conservation and Recovery Act (tracking hazardous waste)) Organizations: MALCOLM WARM (CONTACT/OWNER)
NORMS AUTOMOTIVE (635 W HIGHLAND in SAN BERNARDINO, CA)
Small Quantity Generators, between 100 kg and 1000 kg of hazardous waste/month (Resource Conservation and Recovery Act (tracking hazardous waste)) Organizations: NORM LUBINSKY (CONTACT/OWNER)
NORTHEND CHEVRON (3197 N E ST in SAN BERNARDINO, CA)
Small Quantity Generators, between 100 kg and 1000 kg of hazardous waste/month (Resource Conservation and Recovery Act (tracking hazardous waste)) - notification Organizations: JIM MACDONALD (CONTACT/OWNER)
C W HAYES TRANSP (2590 SECOND AVE in SAN BERNARDINO, CA)
TRANSPORTER (Resource Conservation and Recovery Act (tracking hazardous waste))
EL DORADO CLEANERS (1357 KENDALL UNIT 11 in SAN BERNARDINO, CA)
Small Quantity Generators, between 100 kg and 1000 kg of hazardous waste/month (Resource Conservation and Recovery Act (tracking hazardous waste)) - notification Organizations: CARL SHELTON (CONTACT/OWNER)
Housing units lacking complete plumbing facilities: 0.4%
Housing units lacking complete kitchen facilities: 4.1%
66.2% Utility gas 28.9% Electricity 3.0% No fuel used 1.1% Solar energy
Population in 1990: 35,583.
Place of birth for U.S.-born residents:
This state: 22,554Northeast: 423Midwest: 730South: 893West: 591
43% of the 92405 zip code residents lived in the same house 5 years ago.
Out of people who lived in different houses, 71% lived in this county.
Out of people who lived in different counties, 50% lived in California.
90% of the 92405 zip code residents lived in the same house 1 year ago.
Out of people who lived in different houses, 64% moved from this county.
Out of people who lived in different houses, 30% moved from different county within same state.
Out of people who lived in different houses, 2% moved from different state.
Out of people who lived in different houses, 2% moved from abroad.
Private vs. public school enrollment:
Students in private schools in grades 1 to 8 (elementary and middle school): 175
Here:
3.5%California:
10.5%
Students in private schools in grades 9 to 12 (high school): 47
Students in private undergraduate colleges: 281
Here:
17.5%California:
15.9%
Occupation by median earnings in the past 12 months ($)
140,398 Computer and mathematical occupations 70,429 Arts, design, entertainment, sports, and media occupations 68,133 Community and social service occupations 56,030 Construction and extraction occupations 51,574 Management occupations 48,888 Transportation occupations
Companies with federal contracts located in this zip code:
ALLIED PACIFIC INDUSTRIES, LLC (2700 LITTLE MOUNTAIN DR in SAN BERNARDINO, CA; small business) employees , $0 revenue . : $1,127,757 in 28 contracts from 2003 to 2006
Contracts for Launchers, Guided Missile, Guided Missile Remote Control Systems, Guns, 75 mm through 125 mm, Guns, through 30 mm, and more by Army, Defense Logistics AgencySigned by year: 2000: $0; 2001: $0; 2002: $0; 2003: $108,619; 2004: $248,685; 2005: $726,268; 2006: $44,185.
Biggest contracts: with Army for Launchers, Guided Missile. Signed on 2005-02-04. Completion date: 2010-01-31.
with Army for Guided Missile Remote Control Systems. Signed on 2005-07-13. Completion date: 2006-09-30.
with Defense Logistics Agency for Guns, 75 mm through 125 mm. Signed on 2004-03-04. Completion date: 2005-01-09.
with Defense Logistics Agency for Guns, through 30 mm. Signed on 2003-11-05. Completion date: 2004-01-04.
AIRE-VAK CLEANING SYSTEMS, INC (2334 N. SIERRA WAY in SAN BERNARDINO, CA) in 2 contracts in 1999
$250,000 with Army for Motor Pool Operations. Signed on 1999-11-24. Completion date: 2001-09-30.
, same as above. Signed on 1999-11-08. Completion date: 2001-09-30.
INOTECH (724 W 26TH ST in SAN BERNARDINO, CA; small business) in 2 contracts from 2004 to 2005
$64,170 with Navy for Electrical and Electronic assemblies, Boards, Cards, and Associated Hardware. Signed on 2005-05-18. Completion date: 2005-06-22.
, same as above. Signed on 2004-06-15. Completion date: 2004-08-10.
Top industries in this zip code by the number of employees in 2005:
Accommodation and Food Services: Limited-Service Restaurants (50-99 employees: 1 establishment, 20-49 employees: 6 establishments, 10-19 employees: 3 establishments, 5-9 employees: 2 establishments, 1-4 employees: 2 establishments)Other Services (except Public Administration): Religious Organizations (50-99: 2, 20-49: 1, 10-19: 2, 5-9: 3, 1-4: 6)Accommodation and Food Services: Full-Service Restaurants (100-249: 1, 5-9: 3, 1-4: 4)Health Care and Social Assistance: Services for the Elderly and Persons with Disabilities (100-249: 1, 10-19: 1, 1-4: 1)Information: Wired Telecommunications Carriers (100-249: 1, 5-9: 1, 1-4: 4)Health Care and Social Assistance: Vocational Rehabilitation Services (100-249: 1, 1-4: 1)Other Services (except Public Administration): Industrial Launderers (100-249: 1)
People in group quarters in 2010:
85 people in group homes intended for adults
42 people in emergency and transitional shelters (with sleeping facilities) for people experiencing homelessness
24 people in other noninstitutional facilities
5 people in workers' group living quarters and job corps centers
People in group quarters in 2000:
79 people in other noninstitutional group quarters
37 people in homes for the mentally retarded
34 people in other group homes
12 people in halfway houses
11 people in homes or halfway houses for drug/alcohol abuse
7 people in homes for the mentally ill
2 people in religious group quarters
Fatal accident statistics in 2014:
Fatal accident count: 7Vehicles involved in fatal accidents: 8Fatal accidents caused by drunken drivers: 3Fatalities: 8Persons involved in fatal accidents: 12Pedestrians involved in fatal accidents: 3
Fatal accident statistics in 2013:
Fatal accident count: 4Vehicles involved in fatal accidents: 7Fatal accidents caused by drunken drivers: 1Fatalities: 4Persons involved in fatal accidents: 12Pedestrians involved in fatal accidents: 1
Home Mortgage Disclosure Act Aggregated Statistics For Year 2009(Based on 14 partial tracts) A) FHA, FSA/RHS & VA B) Conventional C) Refinancings D) Home Improvement Loans E) Loans on Dwellings For 5+ Families F) Non-occupant Loans on G) Loans On Manufactured Number Average Value Number Average Value Number Average Value Number Average Value Number Average Value Number Average Value Number Average Value
LOANS ORIGINATED 244 $136,599 158 $94,428 166 $153,356 12 $66,882 1 $314,230 121 $79,271 0 $0 APPLICATIONS APPROVED, NOT ACCEPTED 20 $158,768 48 $151,351 35 $153,447 2 $44,075 1 $4,536,970 31 $146,035 0 $0 APPLICATIONS DENIED 63 $134,537 96 $169,558 143 $156,360 24 $54,350 2 $10,262,965 79 $132,799 1 $46,010 APPLICATIONS WITHDRAWN 60 $128,466 51 $144,396 84 $160,201 4 $42,798 2 $472,440 33 $107,893 0 $0 FILES CLOSED FOR INCOMPLETENESS 20 $150,218 10 $175,774 31 $130,250 2 $60,205 1 $891,860 7 $94,087 0 $0
Aggregated Statistics For Year 2008(Based on 14 partial tracts) A) FHA, FSA/RHS & VA B) Conventional C) Refinancings D) Home Improvement Loans E) Loans on Dwellings For 5+ Families F) Non-occupant Loans on G) Loans On Manufactured Number Average Value Number Average Value Number Average Value Number Average Value Number Average Value Number Average Value Number Average Value
LOANS ORIGINATED 174 $160,541 200 $139,842 261 $171,719 40 $87,244 10 $447,687 143 $142,396 4 $98,318 APPLICATIONS APPROVED, NOT ACCEPTED 12 $166,205 62 $164,287 88 $206,761 10 $111,724 0 $0 39 $155,817 2 $89,595 APPLICATIONS DENIED 46 $195,151 157 $192,625 490 $224,271 108 $127,911 3 $322,483 140 $170,856 4 $61,052 APPLICATIONS WITHDRAWN 25 $169,298 49 $172,227 128 $204,555 12 $127,307 1 $337,940 46 $157,659 0 $0 FILES CLOSED FOR INCOMPLETENESS 4 $206,078 19 $201,006 44 $212,829 8 $199,922 0 $0 17 $209,831 0 $0
Aggregated Statistics For Year 2007(Based on 14 partial tracts) A) FHA, FSA/RHS & VA B) Conventional C) Refinancings D) Home Improvement Loans E) Loans on Dwellings For 5+ Families F) Non-occupant Loans on G) Loans On Manufactured Number Average Value Number Average Value Number Average Value Number Average Value Number Average Value Number Average Value Number Average Value
LOANS ORIGINATED 9 $250,201 543 $206,497 1,160 $218,227 194 $143,435 25 $746,039 293 $214,201 0 $0 APPLICATIONS APPROVED, NOT ACCEPTED 0 $0 193 $221,735 375 $225,019 38 $97,542 6 $347,082 63 $222,300 5 $61,186 APPLICATIONS DENIED 7 $275,861 472 $224,327 1,186 $245,910 212 $136,542 4 $411,495 187 $252,398 5 $60,994 APPLICATIONS WITHDRAWN 5 $209,938 146 $217,100 408 $238,106 42 $218,485 6 $673,898 53 $247,474 2 $68,030 FILES CLOSED FOR INCOMPLETENESS 1 $217,140 51 $231,521 150 $244,828 20 $127,836 0 $0 20 $181,956 0 $0
Aggregated Statistics For Year 2006(Based on 14 partial tracts) A) FHA, FSA/RHS & VA B) Conventional C) Refinancings D) Home Improvement Loans E) Loans on Dwellings For 5+ Families F) Non-occupant Loans on G) Loans On Manufactured Number Average Value Number Average Value Number Average Value Number Average Value Number Average Value Number Average Value Number Average Value
LOANS ORIGINATED 12 $280,424 1,579 $182,670 2,265 $216,695 353 $137,575 18 $2,799,675 523 $213,824 7 $53,979 APPLICATIONS APPROVED, NOT ACCEPTED 0 $0 340 $176,459 501 $227,911 55 $130,756 0 $0 142 $207,880 8 $50,549 APPLICATIONS DENIED 5 $275,444 853 $189,697 1,282 $230,743 238 $118,966 4 $370,238 237 $226,042 12 $57,702 APPLICATIONS WITHDRAWN 3 $206,853 408 $189,340 792 $231,448 76 $146,923 3 $544,553 125 $216,190 6 $172,648 FILES CLOSED FOR INCOMPLETENESS 0 $0 81 $204,550 198 $219,584 7 $110,550 0 $0 24 $216,234 0 $0
Aggregated Statistics For Year 2005(Based on 14 partial tracts) A) FHA, FSA/RHS & VA B) Conventional C) Refinancings D) Home Improvement Loans E) Loans on Dwellings For 5+ Families F) Non-occupant Loans on G) Loans On Manufactured Number Average Value Number Average Value Number Average Value Number Average Value Number Average Value Number Average Value Number Average Value
LOANS ORIGINATED 21 $213,554 1,848 $159,754 2,600 $180,811 308 $143,080 46 $824,247 538 $186,217 6 $94,458 APPLICATIONS APPROVED, NOT ACCEPTED 1 $95,530 406 $165,604 471 $177,954 54 $83,166 0 $0 131 $188,975 12 $74,878 APPLICATIONS DENIED 10 $215,956 790 $172,606 1,146 $188,986 225 $108,748 9 $366,547 264 $190,664 10 $80,093 APPLICATIONS WITHDRAWN 5 $193,604 441 $180,193 940 $187,826 123 $138,702 1 $629,930 118 $182,211 2 $289,115 FILES CLOSED FOR INCOMPLETENESS 1 $189,110 103 $170,101 292 $174,042 14 $120,908 0 $0 42 $152,404 0 $0
Aggregated Statistics For Year 2004(Based on 14 partial tracts) A) FHA, FSA/RHS & VA B) Conventional C) Refinancings D) Home Improvement Loans E) Loans on Dwellings For 5+ Families F) Non-occupant Loans on G) Loans On Manufactured Number Average Value Number Average Value Number Average Value Number Average Value Number Average Value Number Average Value Number Average Value
LOANS ORIGINATED 112 $164,299 1,728 $127,533 2,588 $138,954 236 $108,029 51 $765,508 552 $145,231 8 $58,536 APPLICATIONS APPROVED, NOT ACCEPTED 26 $128,409 370 $139,187 536 $134,696 44 $105,202 2 $149,670 99 $137,329 9 $79,533 APPLICATIONS DENIED 18 $158,378 608 $130,722 1,085 $138,254 270 $86,331 22 $358,905 190 $143,737 6 $56,703 APPLICATIONS WITHDRAWN 24 $178,236 266 $126,552 743 $139,045 110 $95,830 2 $270,610 94 $142,435 0 $0 FILES CLOSED FOR INCOMPLETENESS 7 $166,973 54 $124,428 229 $143,841 10 $97,541 0 $0 32 $113,870 0 $0
Aggregated Statistics For Year 2003(Based on 14 partial tracts) A) FHA, FSA/RHS & VA B) Conventional C) Refinancings D) Home Improvement Loans E) Loans on Dwellings For 5+ Families F) Non-occupant Loans on Number Average Value Number Average Value Number Average Value Number Average Value Number Average Value Number Average Value
LOANS ORIGINATED 348 $125,299 1,028 $103,302 2,361 $108,603 74 $41,951 55 $374,487 439 $102,624 APPLICATIONS APPROVED, NOT ACCEPTED 27 $116,684 208 $107,485 442 $109,812 18 $35,128 3 $219,510 110 $111,966 APPLICATIONS DENIED 59 $134,770 382 $104,195 1,010 $107,140 131 $36,182 7 $629,491 160 $107,325 APPLICATIONS WITHDRAWN 49 $123,294 155 $105,968 721 $116,531 54 $49,273 6 $223,702 76 $110,747 FILES CLOSED FOR INCOMPLETENESS 18 $92,053 51 $104,636 154 $109,810 6 $67,152 1 $435,060 22 $101,146
Aggregated Statistics For Year 2002(Based on 14 partial tracts) A) FHA, FSA/RHS & VA B) Conventional C) Refinancings D) Home Improvement Loans E) Loans on Dwellings For 5+ Families F) Non-occupant Loans on Number Average Value Number Average Value Number Average Value Number Average Value Number Average Value Number Average Value
LOANS ORIGINATED 532 $107,644 772 $85,482 1,182 $97,902 59 $18,521 38 $657,509 296 $86,490 APPLICATIONS APPROVED, NOT ACCEPTED 33 $111,696 144 $89,303 244 $104,238 24 $30,552 3 $162,053 62 $93,087 APPLICATIONS DENIED 54 $107,138 280 $87,120 664 $90,559 133 $22,619 12 $348,107 95 $89,470 APPLICATIONS WITHDRAWN 73 $101,869 142 $86,920 414 $98,274 36 $38,376 0 $0 46 $96,098 FILES CLOSED FOR INCOMPLETENESS 20 $86,692 38 $85,523 154 $99,318 0 $0 3 $877,587 21 $78,574
Aggregated Statistics For Year 2001(Based on 14 partial tracts) A) FHA, FSA/RHS & VA B) Conventional C) Refinancings D) Home Improvement Loans E) Loans on Dwellings For 5+ Families F) Non-occupant Loans on Number Average Value Number Average Value Number Average Value Number Average Value Number Average Value Number Average Value
LOANS ORIGINATED 561 $96,278 361 $80,549 789 $93,224 50 $17,088 15 $501,557 196 $83,789 APPLICATIONS APPROVED, NOT ACCEPTED 31 $91,540 52 $90,173 139 $89,532 11 $17,699 5 $160,554 34 $78,689 APPLICATIONS DENIED 66 $102,750 145 $89,349 560 $78,754 113 $15,061 11 $641,110 100 $87,828 APPLICATIONS WITHDRAWN 76 $102,637 71 $82,344 344 $89,848 38 $22,894 3 $190,407 44 $88,027 FILES CLOSED FOR INCOMPLETENESS 9 $106,538 10 $69,418 75 $90,757 6 $36,827 5 $1,544,062 15 $67,225
Aggregated Statistics For Year 2000(Based on 14 partial tracts) A) FHA, FSA/RHS & VA B) Conventional C) Refinancings D) Home Improvement Loans E) Loans on Dwellings For 5+ Families F) Non-occupant Loans on Number Average Value Number Average Value Number Average Value Number Average Value Number Average Value Number Average Value
LOANS ORIGINATED 575 $92,528 295 $83,009 250 $80,719 47 $34,297 7 $307,336 98 $69,650 APPLICATIONS APPROVED, NOT ACCEPTED 46 $94,006 44 $103,655 66 $81,245 53 $25,636 0 $0 20 $79,696 APPLICATIONS DENIED 83 $90,968 168 $85,304 371 $70,389 128 $25,802 20 $500,035 72 $77,886 APPLICATIONS WITHDRAWN 79 $100,812 66 $79,030 204 $68,374 27 $27,043 3 $254,320 32 $95,934 FILES CLOSED FOR INCOMPLETENESS 23 $105,455 14 $97,186 39 $72,854 1 $26,600 3 $804,810 3 $125,057
Aggregated Statistics For Year 1999(Based on 7 partial tracts) A) FHA, FSA/RHS & VA B) Conventional C) Refinancings D) Home Improvement Loans E) Loans on Dwellings For 5+ Families F) Non-occupant Loans on Number Average Value Number Average Value Number Average Value Number Average Value Number Average Value Number Average Value
LOANS ORIGINATED 231 $86,794 92 $117,997 212 $78,691 29 $20,362 13 $569,053 60 $67,630 APPLICATIONS APPROVED, NOT ACCEPTED 14 $93,156 16 $95,755 46 $87,177 20 $20,366 1 $75,210 14 $80,909 APPLICATIONS DENIED 37 $87,539 58 $83,927 212 $72,323 63 $19,623 5 $162,360 43 $105,559 APPLICATIONS WITHDRAWN 41 $84,644 36 $86,794 103 $76,333 5 $36,574 3 $458,037 16 $73,006 FILES CLOSED FOR INCOMPLETENESS 5 $100,428 6 $65,755 34 $80,277 0 $0 1 $687,660 4 $72,182
Private Mortgage Insurance Companies Aggregated Statistics For Year 2009(Based on 14 partial tracts) A) Conventional B) Refinancings Number Average Value Number Average Value
LOANS ORIGINATED 20 $153,919 2 $148,825 APPLICATIONS APPROVED, NOT ACCEPTED 36 $250,747 1 $142,760 APPLICATIONS DENIED 3 $220,290 1 $227,500 APPLICATIONS WITHDRAWN 2 $169,810 1 $71,150 FILES CLOSED FOR INCOMPLETENESS 0 $0 0 $0
Aggregated Statistics For Year 2008(Based on 14 partial tracts) A) Conventional B) Refinancings C) Non-occupant Loans on Number Average Value Number Average Value Number Average Value
LOANS ORIGINATED 65 $195,980 26 $273,517 8 $169,712 APPLICATIONS APPROVED, NOT ACCEPTED 70 $267,270 55 $306,418 4 $255,408 APPLICATIONS DENIED 26 $216,608 6 $260,572 8 $210,125 APPLICATIONS WITHDRAWN 10 $269,060 1 $464,060 4 $257,870 FILES CLOSED FOR INCOMPLETENESS 4 $228,385 4 $310,345 3 $239,380
Aggregated Statistics For Year 2007(Based on 14 partial tracts) A) Conventional B) Refinancings C) Non-occupant Loans on Number Average Value Number Average Value Number Average Value
LOANS ORIGINATED 106 $257,518 68 $299,794 9 $245,811 APPLICATIONS APPROVED, NOT ACCEPTED 18 $269,825 34 $295,804 3 $245,350 APPLICATIONS DENIED 14 $281,708 7 $268,996 6 $228,745 APPLICATIONS WITHDRAWN 7 $250,613 13 $293,956 2 $222,590 FILES CLOSED FOR INCOMPLETENESS 0 $0 2 $242,645 0 $0
Aggregated Statistics For Year 2006(Based on 14 partial tracts) A) Conventional B) Refinancings C) Non-occupant Loans on Number Average Value Number Average Value Number Average Value
LOANS ORIGINATED 19 $276,300 49 $282,854 3 $252,897 APPLICATIONS APPROVED, NOT ACCEPTED 9 $294,763 18 $281,148 5 $354,368 APPLICATIONS DENIED 1 $691,750 5 $320,134 3 $402,023 APPLICATIONS WITHDRAWN 2 $244,185 12 $298,443 1 $404,350 FILES CLOSED FOR INCOMPLETENESS 1 $222,330 0 $0 0 $0
Aggregated Statistics For Year 2005(Based on 14 partial tracts) A) Conventional B) Refinancings C) Non-occupant Loans on Number Average Value Number Average Value Number Average Value
LOANS ORIGINATED 45 $236,146 52 $225,683 8 $211,345 APPLICATIONS APPROVED, NOT ACCEPTED 12 $192,505 16 $213,468 7 $198,330 APPLICATIONS DENIED 0 $0 2 $296,120 0 $0 APPLICATIONS WITHDRAWN 7 $193,804 2 $240,220 3 $178,607 FILES CLOSED FOR INCOMPLETENESS 1 $256,270 0 $0 1 $154,020
Aggregated Statistics For Year 2004(Based on 14 partial tracts) A) Conventional B) Refinancings C) Non-occupant Loans on Number Average Value Number Average Value Number Average Value
LOANS ORIGINATED 164 $163,655 61 $165,303 37 $171,825 APPLICATIONS APPROVED, NOT ACCEPTED 28 $147,130 22 $152,995 5 $129,980 APPLICATIONS DENIED 8 $217,946 2 $123,040 5 $217,474 APPLICATIONS WITHDRAWN 4 $154,058 1 $164,020 0 $0 FILES CLOSED FOR INCOMPLETENESS 0 $0 0 $0 0 $0
Aggregated Statistics For Year 2003(Based on 14 partial tracts) A) Conventional B) Refinancings C) Non-occupant Loans on Number Average Value Number Average Value Number Average Value
LOANS ORIGINATED 196 $133,217 143 $124,735 36 $118,616 APPLICATIONS APPROVED, NOT ACCEPTED 36 $110,133 44 $139,731 6 $91,333 APPLICATIONS DENIED 9 $160,790 3 $151,140 5 $156,772 APPLICATIONS WITHDRAWN 8 $141,500 6 $123,403 4 $130,667 FILES CLOSED FOR INCOMPLETENESS 1 $69,310 0 $0 1 $69,310
Aggregated Statistics For Year 2002(Based on 14 partial tracts) A) Conventional B) Refinancings C) Non-occupant Loans on Number Average Value Number Average Value Number Average Value
LOANS ORIGINATED 182 $110,820 91 $120,836 38 $107,667 APPLICATIONS APPROVED, NOT ACCEPTED 34 $96,242 25 $117,186 8 $98,002 APPLICATIONS DENIED 6 $91,265 4 $113,760 4 $116,938 APPLICATIONS WITHDRAWN 8 $97,455 2 $152,975 1 $87,730 FILES CLOSED FOR INCOMPLETENESS 1 $85,560 0 $0 0 $0
Aggregated Statistics For Year 2001(Based on 14 partial tracts) A) Conventional B) Refinancings C) Non-occupant Loans on Number Average Value Number Average Value Number Average Value
LOANS ORIGINATED 109 $103,200 52 $114,627 22 $84,068 APPLICATIONS APPROVED, NOT ACCEPTED 24 $97,556 12 $124,071 5 $118,096 APPLICATIONS DENIED 3 $45,463 1 $164,360 0 $0 APPLICATIONS WITHDRAWN 5 $100,500 0 $0 0 $0 FILES CLOSED FOR INCOMPLETENESS 0 $0 1 $237,150 0 $0
Aggregated Statistics For Year 2000(Based on 14 partial tracts) A) Conventional B) Refinancings C) Non-occupant Loans on Number Average Value Number Average Value Number Average Value
LOANS ORIGINATED 90 $92,907 22 $107,058 21 $71,220 APPLICATIONS APPROVED, NOT ACCEPTED 18 $80,493 5 $148,440 4 $46,360 APPLICATIONS DENIED 6 $111,570 2 $110,240 1 $94,780 APPLICATIONS WITHDRAWN 2 $74,835 0 $0 2 $74,835 FILES CLOSED FOR INCOMPLETENESS 1 $75,060 1 $77,900 0 $0
Aggregated Statistics For Year 1999(Based on 7 partial tracts) A) Conventional B) Refinancings C) Non-occupant Loans on Number Average Value Number Average Value Number Average Value
LOANS ORIGINATED 16 $91,852 18 $115,983 6 $67,493 APPLICATIONS APPROVED, NOT ACCEPTED 2 $49,745 3 $100,530 2 $43,980 APPLICATIONS DENIED 2 $84,645 2 $95,210 2 $59,770 APPLICATIONS WITHDRAWN 0 $0 1 $87,360 0 $0 FILES CLOSED FOR INCOMPLETENESS 0 $0 0 $0 0 $0
2002 - 2018 National Fire Incident Reporting System (NFIRS) incidents See full 2006 National Fire Incident Reporting System statistics for zip code 92405, California
Most common first names in zip code 92405 among deceased individuals Name Count Lived (average)
John 202 76.1 years William 184 74.8 years Mary 170 77.0 years James 141 70.9 years Robert 127 69.9 years George 112 74.3 years Charles 108 73.9 years Joseph 77 74.3 years Helen 76 80.6 years Frank 75 77.5 years
Most common last names in zip code 92405 among deceased individuals Last name Count Lived (average)
Smith 75 73.4 years Williams 58 69.6 years Jones 49 67.1 years Miller 47 73.8 years Johnson 47 76.1 years Davis 37 75.8 years Anderson 37 75.8 years Brown 37 73.7 years Martin 33 72.6 years Moore 32 72.1 years
Businesses in zip code 92405
Name Count Name Count
7-Eleven 2 KFC 1 AutoZone 1 Little Caesars Pizza 1 Burger King 1 McDonald's 1 Chevrolet 1 Payless 1 Circle K 1 Subway 1 El Pollo Loco 1 T-Mobile 1 FedEx 1 Taco Bell 1 H&R Block 1 U-Haul 1 Home Depot 1

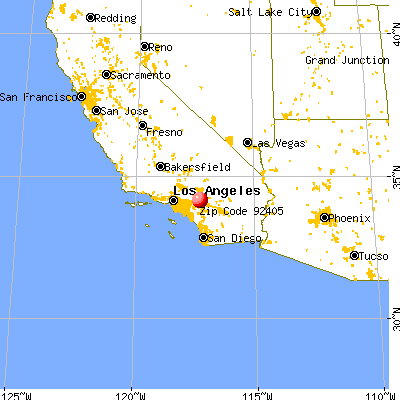


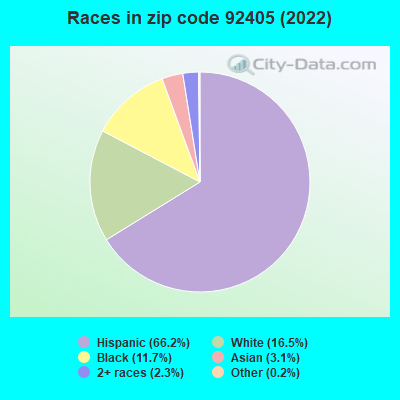


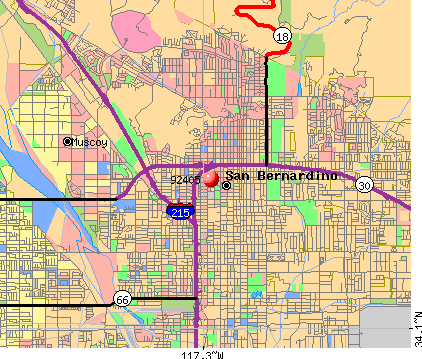 Nearest zip codes: 92411, 92410, 92401, 92404, 92408, 92376.
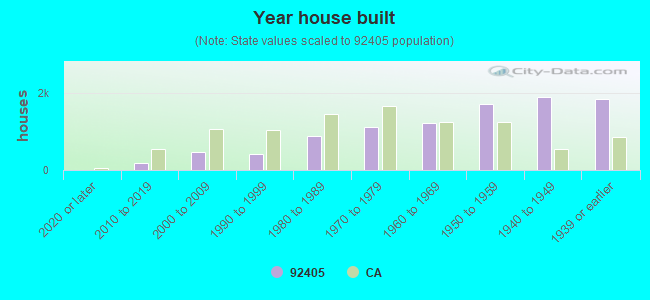

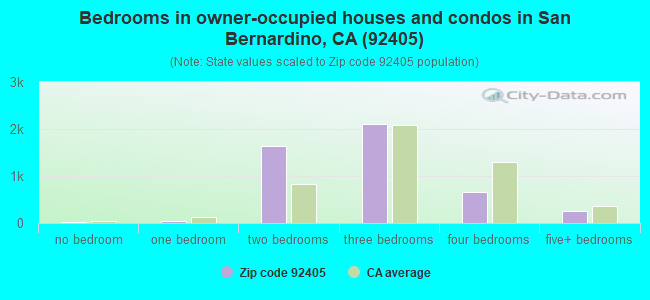
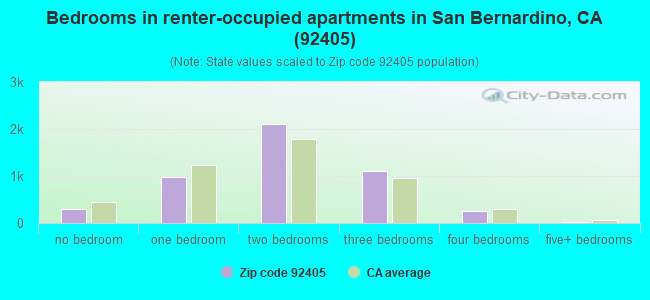
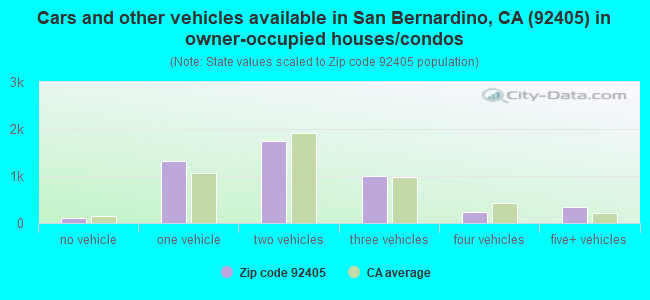


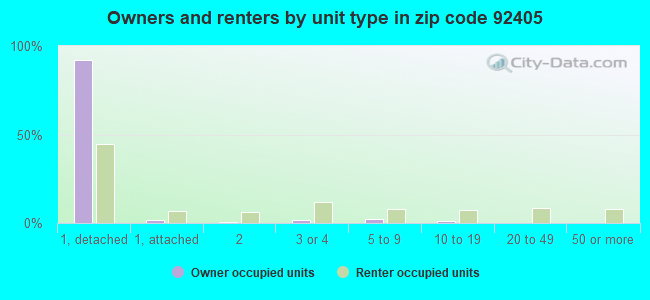
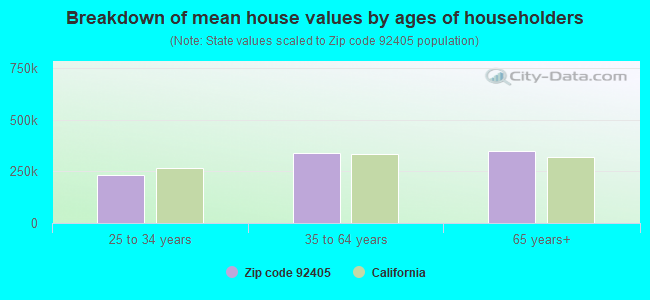


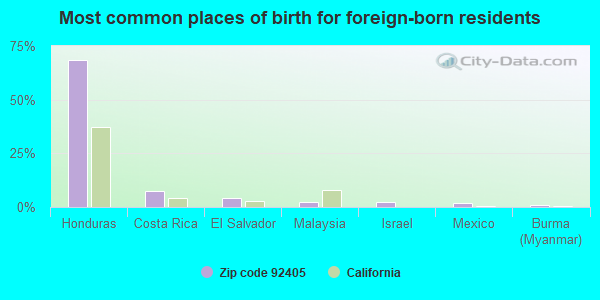
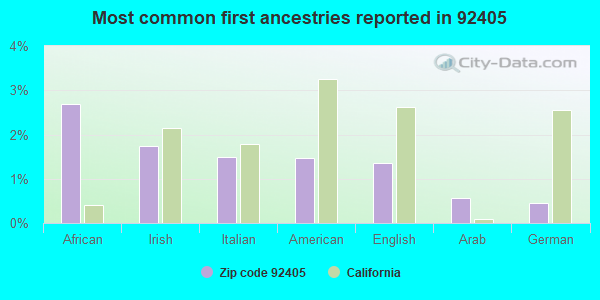
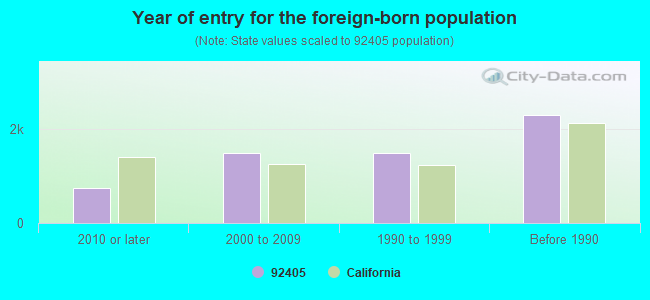


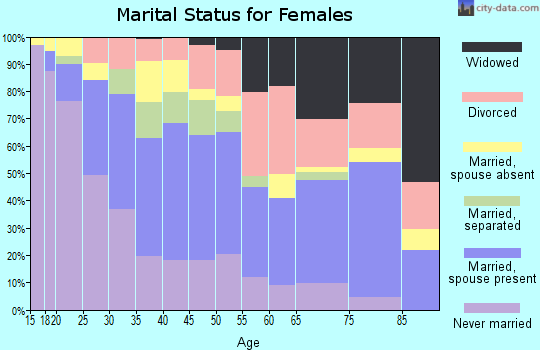
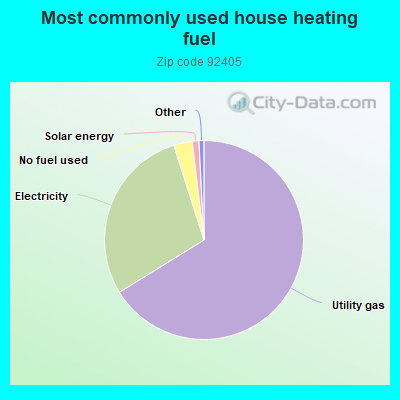
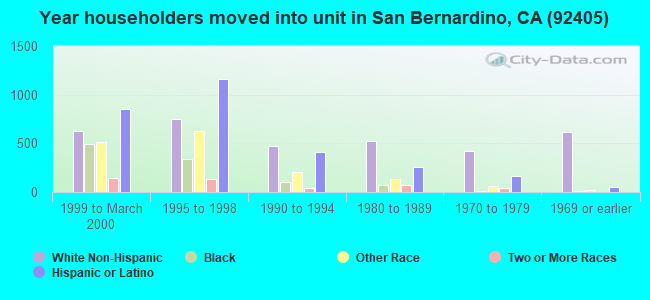
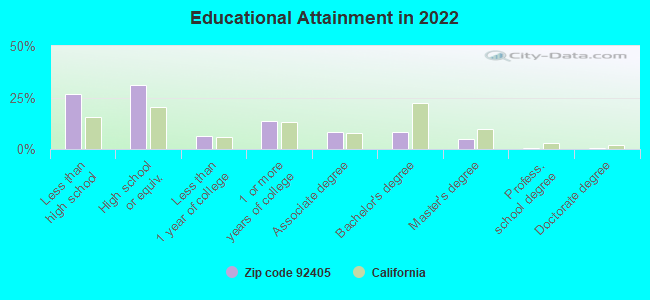
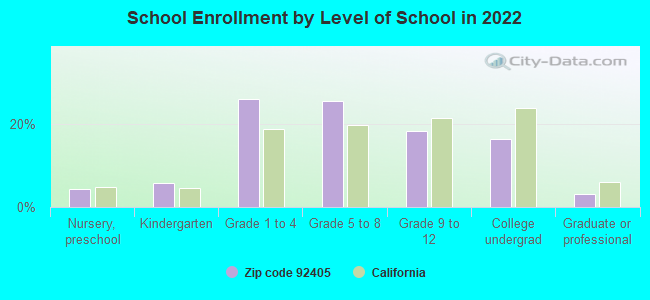
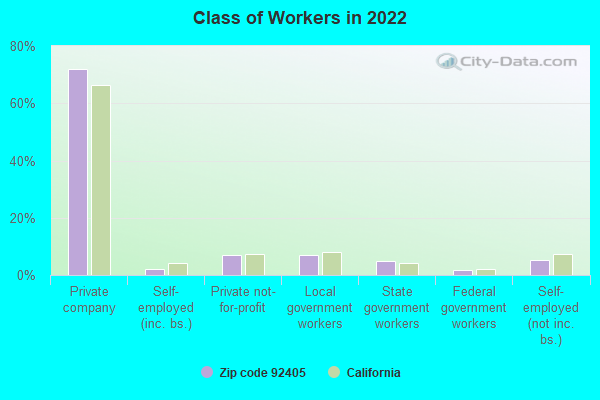
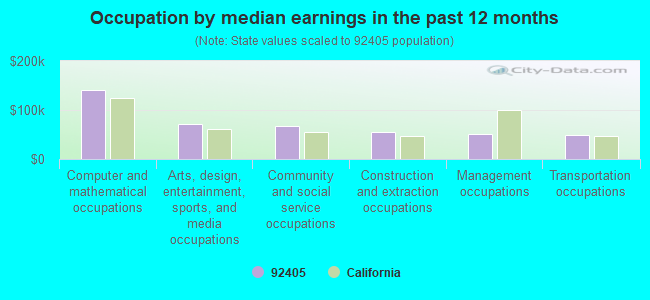
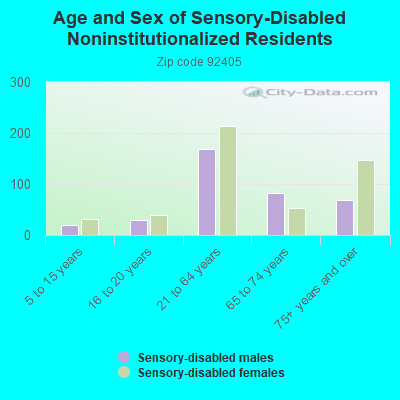
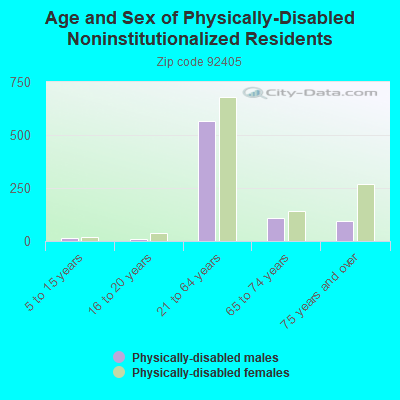
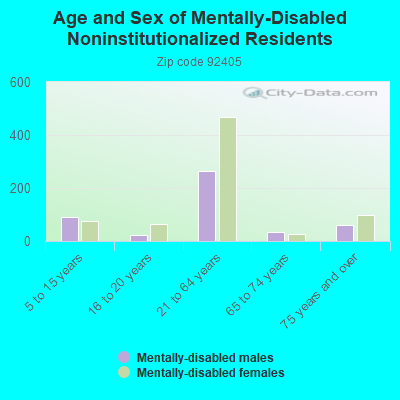
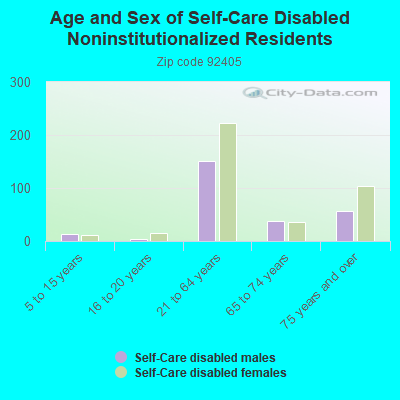
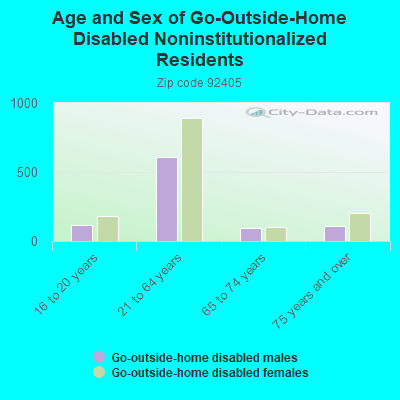
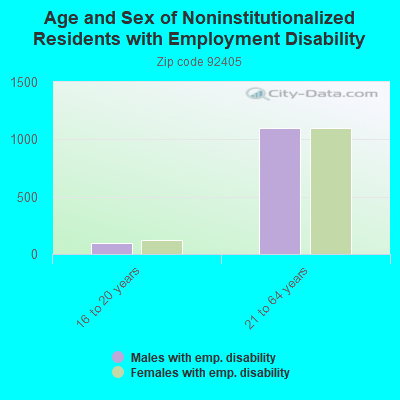
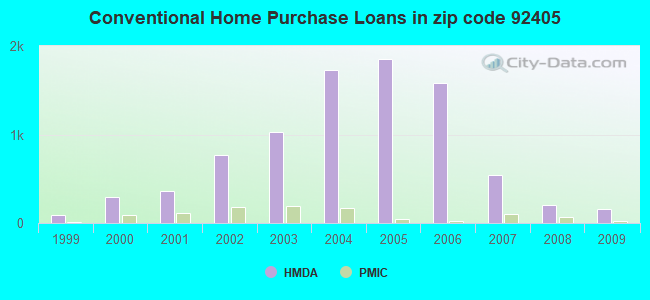
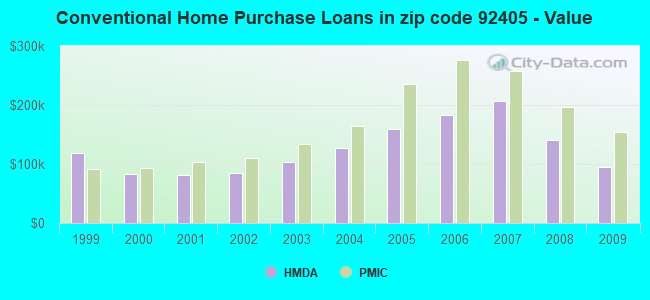
 According to the data from the years 2002 - 2018 the average number of fires per year is 14. The highest number of reported fire incidents - 116 took place in 2018, and the least - 0 in 2006. The data has a growing trend.
 When looking into fire subcategories, the most reports belonged to: Outside Fires (48.7%), and Structure Fires (26.2%).