Estimated zip code population in 2022: 85,015 Zip code population in 2010: 81,516 Zip code population in 2000: 75,875
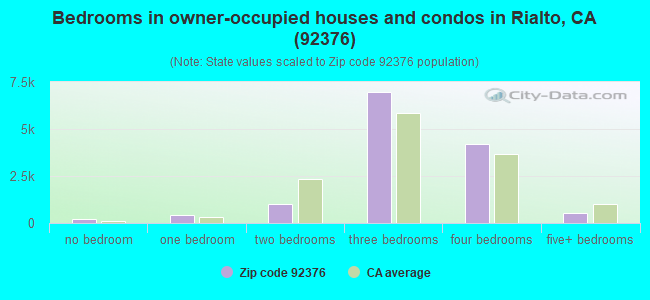
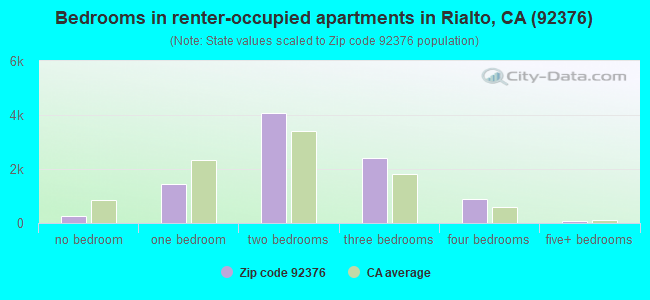
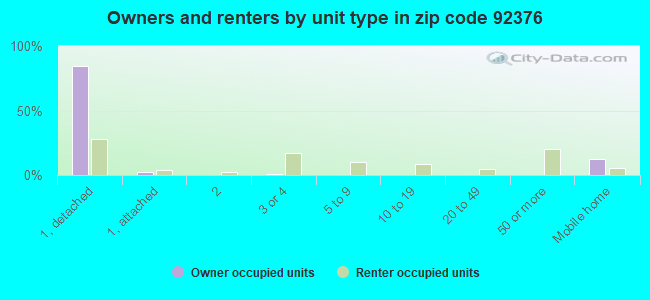
Houses and condos: 23,282 Renter-occupied apartments: 9,163
% of renters here:
41%
State:
44%
March 2022 cost of living index in zip code 92376: 81.9 (low, U.S. average is 100)
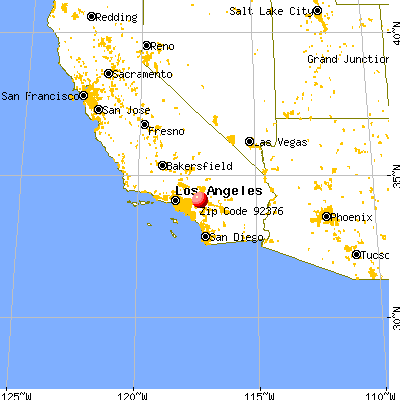
Land area: 13.5 sq. mi. Water area: 0.1 sq. mi.
Population density: 6,289 people per square mile
(high).
OSM Map
General Map
Google Map
MSN Map
OSM Map
General Map
Google Map
MSN Map
OSM Map
General Map
Google Map
MSN Map
OSM Map
General Map
Google Map
MSN Map
Please wait while loading the map...
Real estate property taxes paid for housing units in 2022:
This zip code:
0.6% ($2,680)
California:
0.7% ($4,831)
Median real estate property taxes paid for housing units with mortgages in 2022: $2,997 (0.7%) Median real estate property taxes paid for housing units with no mortgage in 2022: $1,572 (0.4%)
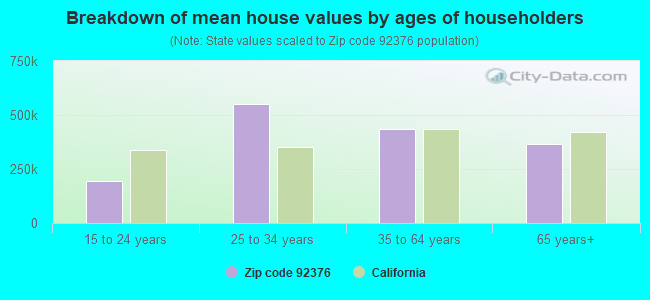
Estimated median house/condo value in 2022: $421,418
92376:
$421,418
California:
$715,900
According to our research of California and other state lists, there were 116 registered sex offenders living in 92376 zip code as of April 27, 2024. The ratio of all residents to sex offenders in zip code 92376 is 751 to 1. The ratio of registered sex offenders to all residents in this zip code is near the state average.
Median resident age:
This zip code:
30.8 years
California median age:
37.9 years
Average household size:
This zip code:
3.8 people
California:
2.8 people
Averages for the 2020 tax year for zip code 92376, filed in 2021:
Average Adjusted Gross Income (AGI) in 2020: $40,760 (Individual Income Tax Returns)
Here:
$40,760
State:
$95,910
Salary/wage: $38,899 (reported on 86.9% of returns)
Here:
$38,899
State:
$77,331
(% of AGI for various income ranges: 1239.6% for AGIs below $25k, 3927.6% for AGIs $25k-50k, 7550.6% for AGIs $50k-75k, 11459.0% for AGIs $75k-100k, 18484.2% for AGIs $100k-200k, 49377.5% for AGIs over 200k)
Taxable interest for individuals: $193 (reported on 18.9% of returns)
This zip code:
$193
California:
$2,294
(% of AGI for various income ranges: 1.6% for AGIs below $25k, 3.2% for AGIs $25k-50k, 7.5% for AGIs $50k-75k, 10.4% for AGIs $75k-100k, 20.4% for AGIs $100k-200k, 397.5% for AGIs over 200k)
Ordinary dividends: $1,139 (reported on 2.9% of returns)
Here:
$1,139
State:
$10,949
(% of AGI for various income ranges: 1.5% for AGIs below $25k, 2.4% for AGIs $25k-50k, 4.6% for AGIs $50k-75k, 15.7% for AGIs $75k-100k, 22.4% for AGIs $100k-200k, 287.5% for AGIs over 200k)
Net capital gain/loss in AGI: +$3,177 (reported on 3.8% of returns)
Here:
+$3,177
State:
+$49,306
(% of AGI for various income ranges: 1.1% for AGIs $25k-50k, 8.7% for AGIs $50k-75k, 26.2% for AGIs $75k-100k, 142.3% for AGIs $100k-200k, 5307.5% for AGIs over 200k)
Profit/loss from business: +$7,265 (reported on 15.9% of returns)
Here:
+$7,265
State:
+$15,671
(% of AGI for various income ranges: 155.7% for AGIs below $25k, 129.9% for AGIs $25k-50k, 165.7% for AGIs $50k-75k, 174.6% for AGIs $75k-100k, 305.5% for AGIs $100k-200k, 977.5% for AGIs over 200k)
Taxable individual retirement arrangement distribution: $13,899 (reported on 1.8% of returns)
92376:
$13,899
California:
$23,505
(% of AGI for various income ranges: 11.1% for AGIs below $25k, 16.8% for AGIs $25k-50k, 37.0% for AGIs $50k-75k, 119.4% for AGIs $75k-100k, 245.2% for AGIs $100k-200k)
Total itemized deductions: $26,764 (reported on 7.7% of returns)
Here:
$26,764
State:
$39,517
(% of AGI for various income ranges: 29.8% for AGIs below $25k, 139.2% for AGIs $25k-50k, 495.5% for AGIs $50k-75k, 967.9% for AGIs $75k-100k, 1657.5% for AGIs $100k-200k, 10995.0% for AGIs over 200k)
Charity contributions: $4,977 (reported on 6.2% of returns)
Here:
$4,977
State:
$12,598
(% of AGI for various income ranges: 2.1% for AGIs below $25k, 17.7% for AGIs $25k-50k, 69.2% for AGIs $50k-75k, 147.8% for AGIs $75k-100k, 311.8% for AGIs $100k-200k, 1392.5% for AGIs over 200k)
Taxes paid: $7,844 (reported on 7.7% of returns)
92376:
$7,844
State:
$8,807
(% of AGI for various income ranges: 7.3% for AGIs below $25k, 38.4% for AGIs $25k-50k, 149.5% for AGIs $50k-75k, 315.1% for AGIs $75k-100k, 508.0% for AGIs $100k-200k, 1415.0% for AGIs over 200k)
Earned income credit: $2,336 (reported on 24.7% of returns)
Here:
$2,336
State:
$2,074
(% of AGI for various income ranges: 123.3% for AGIs below $25k, 85.6% for AGIs $25k-50k, 1.6% for AGIs $50k-75k)
Percentage of individuals using paid preparers for their 2020 taxes: 92.7%
Here:
93%
State:
92%
(% for various income ranges: 91.7% for AGIs below $25k, 93.3% for AGIs $25k-50k, 93.5% for AGIs $50k-75k, 92.1% for AGIs $75k-100k, 93.4% for AGIs $100k-200k, 84.6% for AGIs over 200k)
Averages for the 2012 tax year for zip code 92376, filed in 2013:
Average Adjusted Gross Income (AGI) in 2012: $32,032 (Individual Income Tax Returns)
Here:
$32,032
State:
$72,726
Salary/wage: $30,602 (reported on 86.7% of returns)
Here:
$30,602
State:
$59,079
(% of AGI for various income ranges: 76.2% for AGIs below $25k, 87.8% for AGIs $25k-50k, 87.0% for AGIs $50k-75k, 85.0% for AGIs $75k-100k, 79.1% for AGIs $100k-200k, 27.1% for AGIs over 200k)
Taxable interest for individuals: $269 (reported on 18.7% of returns)
This zip code:
$269
California:
$2,146
(% of AGI for various income ranges: 0.1% for AGIs below $25k, 0.1% for AGIs $25k-50k, 0.1% for AGIs $50k-75k, 0.1% for AGIs $75k-100k, 0.2% for AGIs $100k-200k, 1.4% for AGIs over 200k)
Ordinary dividends: $1,239 (reported on 3.0% of returns)
Here:
$1,239
State:
$9,308
(% of AGI for various income ranges: 0.1% for AGIs below $25k, 0.1% for AGIs $75k-100k, 0.4% for AGIs $100k-200k)
Net capital gain/loss in AGI: +$2,916 (reported on 2.3% of returns)
Here:
+$2,916
State:
+$30,460
(% of AGI for various income ranges: 0.6% for AGIs $100k-200k, 9.9% for AGIs over 200k)
Profit/loss from business: +$8,880 (reported on 16.2% of returns)
Here:
+$8,880
State:
+$17,064
(% of AGI for various income ranges: 13.8% for AGIs below $25k, 3.0% for AGIs $25k-50k, 1.2% for AGIs $50k-75k, 0.4% for AGIs $75k-100k, 1.8% for AGIs $100k-200k)
Taxable individual retirement arrangement distribution: $10,600 (reported on 2.4% of returns)
92376:
$10,600
California:
$19,557
(% of AGI for various income ranges: 0.5% for AGIs below $25k, 0.6% for AGIs $25k-50k, 0.9% for AGIs $50k-75k, 1.1% for AGIs $75k-100k, 1.6% for AGIs $100k-200k)
Total itemized deductions: $19,019 (32% of AGI, reported on 23.7% of returns)
Here:
$19,019
State:
$34,004
Here:
32.4% of AGI
State:
22.7% of AGI
(% of AGI for various income ranges: 5.4% for AGIs below $25k, 13.1% for AGIs $25k-50k, 18.7% for AGIs $50k-75k, 19.3% for AGIs $75k-100k, 20.0% for AGIs $100k-200k, 15.1% for AGIs over 200k)
Charity contributions: $2,578 (reported on 18.7% of returns)
Here:
$2,578
State:
$4,659
(% of AGI for various income ranges: 0.4% for AGIs below $25k, 1.2% for AGIs $25k-50k, 2.0% for AGIs $50k-75k, 2.3% for AGIs $75k-100k, 2.8% for AGIs $100k-200k, 1.8% for AGIs over 200k)
Taxes paid: $4,542 (reported on 23.6% of returns)
92376:
$4,542
State:
$14,448
(% of AGI for various income ranges: 1.0% for AGIs below $25k, 2.6% for AGIs $25k-50k, 4.3% for AGIs $50k-75k, 5.1% for AGIs $75k-100k, 6.2% for AGIs $100k-200k, 6.1% for AGIs over 200k)
Earned income credit: $2,716 (reported on 37.7% of returns)
Here:
$2,716
State:
$2,286
(% of AGI for various income ranges: 11.3% for AGIs below $25k, 2.2% for AGIs $25k-50k)
Percentage of individuals using paid preparers for their 2012 taxes: 74.3%
Here:
74%
State:
64%
(% for various income ranges: 71.9% for AGIs below $25k, 76.9% for AGIs $25k-50k, 77.8% for AGIs $50k-75k, 75.2% for AGIs $75k-100k, 74.1% for AGIs $100k-200k, 75.0% for AGIs over 200k)
Averages for the 2004 tax year for zip code 92376, filed in 2005:
Average Adjusted Gross Income (AGI) in 2004: $31,144 (Individual Income Tax Returns)
Here:
$31,144
State:
$58,600
Salary/wage: $29,932 (reported on 89.6% of returns)
Here:
$29,932
State:
$49,455
(% of AGI for various income ranges: 84.6% for AGIs below $10k, 84.2% for AGIs $10k-25k, 90.5% for AGIs $25k-50k, 90.4% for AGIs $50k-75k, 89.0% for AGIs $75k-100k, 61.3% for AGIs over 100k)
Taxable interest for individuals: $410 (reported on 24.6% of returns)
This zip code:
$410
California:
$2,365
(% of AGI for various income ranges: 0.8% for AGIs below $10k, 0.3% for AGIs $10k-25k, 0.3% for AGIs $25k-50k, 0.2% for AGIs $50k-75k, 0.3% for AGIs $75k-100k, 0.4% for AGIs over 100k)
Taxable dividends: $828 (reported on 5.0% of returns)
Here:
$828
State:
$4,746
(% of AGI for various income ranges: 0.5% for AGIs below $10k, 0.1% for AGIs $10k-25k, 0.1% for AGIs $25k-50k, 0.1% for AGIs $50k-75k, 0.1% for AGIs $75k-100k, 0.2% for AGIs over 100k)
Net capital gain/loss: +$11,573 (reported on 3.8% of returns)
Here:
+$11,573
State:
+$23,418
(% of AGI for various income ranges: -0.4% for AGIs below $10k, 0.0% for AGIs $10k-25k, 0.2% for AGIs $25k-50k, 0.4% for AGIs $50k-75k, 1.0% for AGIs $75k-100k, 11.7% for AGIs over 100k)
Profit/loss from business: +$6,911 (reported on 13.9% of returns)
Here:
+$6,911
State:
+$16,826
(% of AGI for various income ranges: 12.6% for AGIs below $10k, 7.5% for AGIs $10k-25k, 2.2% for AGIs $25k-50k, 1.2% for AGIs $50k-75k, 0.4% for AGIs $75k-100k, 2.1% for AGIs over 100k)
IRA payment deduction: $2,131 (reported on 1.1% of returns)
92376:
$2,131
California:
$3,192
(% of AGI for various income ranges: 0.0% for AGIs below $10k, 0.1% for AGIs $10k-25k, 0.1% for AGIs $25k-50k, 0.1% for AGIs $50k-75k, 0.1% for AGIs $75k-100k, 0.0% for AGIs over 100k)
Total itemized deductions: $18,720 (36% of AGI, reported on 32.9% of returns)
Here:
$18,720
State:
$28,113
Here:
36.0% of AGI
State:
25.3% of AGI
(% of AGI for various income ranges: 13.2% for AGIs below $10k, 11.2% for AGIs $10k-25k, 20.8% for AGIs $25k-50k, 24.4% for AGIs $50k-75k, 24.0% for AGIs $75k-100k, 18.6% for AGIs over 100k)
Charity contributions deductions: $2,479 (5% of AGI, reported on 28.5% of returns)
Here:
$2,479
State:
$3,923
Here:
4.6% of AGI
State:
3.3% of AGI
(% of AGI for various income ranges: 0.4% for AGIs below $10k, 0.8% for AGIs $10k-25k, 2.1% for AGIs $25k-50k, 2.8% for AGIs $50k-75k, 3.4% for AGIs $75k-100k, 3.7% for AGIs over 100k)
Total tax: $3,045 (reported on 58.0% of returns)
92376:
$3,045
State:
$10,761
(% of AGI for various income ranges: 3.0% for AGIs below $10k, 3.0% for AGIs $10k-25k, 3.8% for AGIs $25k-50k, 5.8% for AGIs $50k-75k, 8.1% for AGIs $75k-100k, 15.1% for AGIs over 100k)
Earned income credit: $2,065 (reported on 32.7% of returns)
Here:
$2,065
State:
$1,763
Percentage of individuals using paid preparers for their 2004 taxes: 78.0%
Here:
78%
State:
66%
(% for various income ranges: 72.9% for AGIs below $10k, 80.3% for AGIs $10k-25k, 79.3% for AGIs $25k-50k, 78.0% for AGIs $50k-75k, 76.1% for AGIs $75k-100k, 74.2% for AGIs over 100k)
Likely homosexual households (counted as self-reported same-sex unmarried-partner households)
Lesbian couples: 0.1% of all households
Gay men: 0.0% of all households
Household received Food Stamps/SNAP in the past 12 months: 6,177 Household did not receive Food Stamps/SNAP in the past 12 months: 16,943
Women who had a birth in the past 12 months: 974 (415 now married, 564 unmarried) Women who did not have a birth in the past 12 months: 22,186 (8,235 now married, 13,974 unmarried)
Housing units in zip code 92376 with a mortgage: 8,795 (426 second mortgage, 366 both second mortgage and home equity loan) Houses without a mortgage: 7
Median monthly owner costs for units with a mortgage: $1,881 Median monthly owner costs for units without a mortgage: $571
Residents with income below the poverty level in 2022:
This zip code:
14.3%
Whole state:
12.2%
Residents with income below 50% of the poverty level in 2022:
This zip code:
7.7%
Whole state:
6.2%
Median number of rooms in houses and condos:
Here:
5.7
State:
6.0
Median number of rooms in apartments:
Here:
4.2
State:
3.9
Notable locations in this zip code not listed on our city pages
Notable locations in zip code 92376: San Bernardino Sheriff's Aviation Division Emergency Medical Services Transport (A), Rialto Fire Department Station 202 (B), Rialto Fire Department Station 203 (C), San Bernardino City Fire Department Station 229 (D), Rialto Branch San Bernardino County Library (E), San Bernardino County Office of Emergency Services Hazardous Materials Division Building (F), San Bernardino County Hazardous Materials Division Business Office (G), Rialto Fire Department Station 201 (H). Display/hide their locations on the map
Shopping Centers: Save-A-Minit Shopping Center (1), Renaisance Shopping Center (2), Cactus Retail Shopping Center (3), Rialto Value Center Shopping Center (4), Rialto Square Shopping Center (5), Rialto Shopping Center (6), Five Points Plaza Shopping Center (7), Baseline Shopping Center (8). Display/hide their locations on the map
Churches in zip code 92376 include: Rialto Seventh Day Adventist Church (A), Bethany Presbyterian Church (B), Church of the Nazarene (C), First Christian Church (D), Memorial Baptist Church (E), Saint THomas Moore Church (F), Church of Christ (G), The Church of Jesus Christ of Latter Day Saints (H), Eastside Church of Christ (I). Display/hide their locations on the map
Parks in zip code 92376 include: Frisbie Park (1), Rialto Park (2), Sand Hills Park (3), Jerry Eaves Park (4), South Riverside Avenue Park (5). Display/hide their locations on the map
11,271 married couples with children.
6,283 single-parent households (1,814 men, 4,469 women).
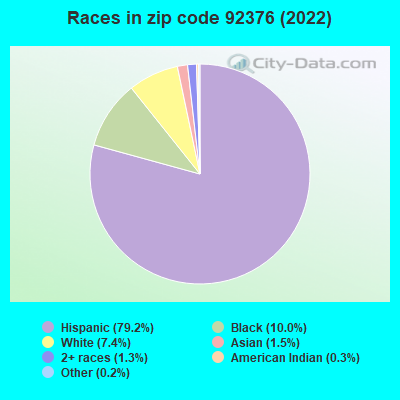
35.8% of residents of 92376 zip code speak English at home.
61.4% of residents speak Spanish at home (66% very well, 14% well, 14% not well, 6% not at all).
0.4% of residents speak other Indo-European language at home (77% very well, 15% well, 9% not well).
1.2% of residents speak Asian or Pacific Island language at home (62% very well, 29% well, 6% not well, 3% not at all).
0.9% of residents speak other language at home (28% very well, 44% well, 27% not well, 1% not at all).
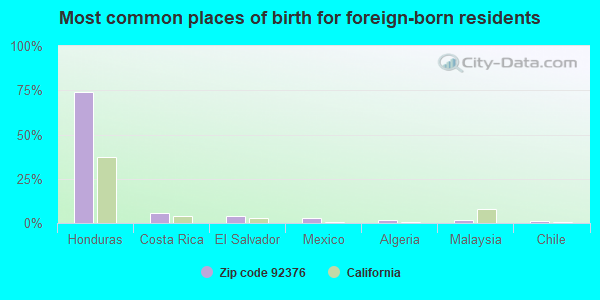
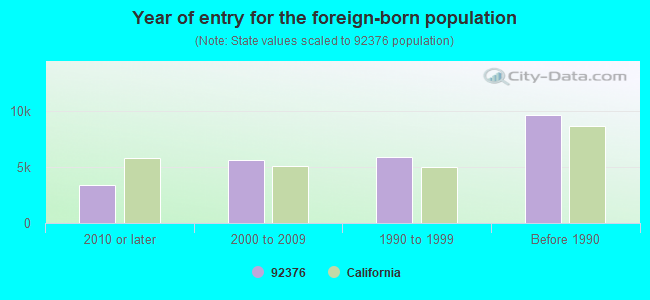
Foreign born population: 24,028 (28.3%) (46.2% of them are naturalized citizens)
Major facilities with environmental interests located in this zip code:
FILTER RECYCLING SERVICES INCORPORATED (180 WEST MONTE AVE in RIALTO, CA)
STATE MASTER (California - Hazardous Waste Tracking) - HAZARDOU WASTE PROGRAM HAZARDOUS WASTE BIENNIAL REPORTER (Resource Conservation and Recovery Act (tracking hazardous waste)) Large Quantity Generators, more that 1000 kg of hazardous waste/month (Resource Conservation and Recovery Act (tracking hazardous waste)) - notification TRANSPORTER (Resource Conservation and Recovery Act (tracking hazardous waste)) - notification USED OIL PROGRAM (Resource Conservation and Recovery Act (tracking hazardous waste)) STATE MASTER (California - Used Oil Recycling System ) - USED OIL RECYCLING Business NAICS classification: HAZARDOUS WASTE COLLECTION.; HAZARDOUS WASTE TREATMENT AND DISPOSAL. Organizations: FILTER RECYCLING SERVICES, INC. (CONTACT/OPERATOR)
, JON L. BENNETT, JR. (CONTACT/OWNER)
CHEVRON STATION NO 96969 (101 E VALLEY BLVD in RIALTO, CA)
STATE MASTER (California - Hazardous Waste Tracking) - HAZARDOU WASTE PROGRAM HAZARDOUS WASTE BIENNIAL REPORTER (Resource Conservation and Recovery Act (tracking hazardous waste)) Large Quantity Generators, more that 1000 kg of hazardous waste/month (Resource Conservation and Recovery Act (tracking hazardous waste)) Small Quantity Generators, between 100 kg and 1000 kg of hazardous waste/month (Resource Conservation and Recovery Act (tracking hazardous waste)) - notification Organizations: CHEVRON PRODUCTS CO (CONTACT/OWNER)
Alternative names: CHEVRON NO 96969
FLEETWOOD TRAVEL TRAILERS OF CALIFORNIA INCORPORATED NUMBER 15 (145 S. LARCH AVE. in RIALTO, CA)
AIR MAJOR (AIRS/AFS) STATE MASTER (California - Hazardous Waste Tracking) - HAZARDOU WASTE PROGRAM CRITERIA AND HAZARDOUS AIR POLLUTANT INVENTORY (Inventory of air pollution sources) Small Quantity Generators, between 100 kg and 1000 kg of hazardous waste/month (Resource Conservation and Recovery Act (tracking hazardous waste)) TRI REPORTER (Tracking of toxic chemicals releasing facilities) Business SIC classification: TRAVEL TRAILERS AND CAMPERS Business NAICS classification: TRAVEL TRAILER AND CAMPER MANUFACTURING. Alternative names: FLEETWOOD TRAVEL TRAILERS 15, FLEETWOOD TRAVEL TRAILERS OF CA INC
FONTANA POWERHOUSE (3165 N RIVERSIDE in RIALTO, CA)
STATE MASTER (California - Hazardous Waste Tracking) - HAZARDOU WASTE PROGRAM (Resource Conservation and Recovery Act (tracking hazardous waste)) Organizations: SOUTHERN CALIFORNIA EDISON CO (CONTACT/OWNER)
Alternative names: SO CAL EDISON- FONTANA POWER HOUSE
GLOBAL CLEANING TECHNOLOGIES (434 E MESA DR in RIALTO, CA)
STATE MASTER (California - Hazardous Waste Tracking) - HAZARDOU WASTE PROGRAM TRANSPORTER (Resource Conservation and Recovery Act (tracking hazardous waste)) USED OIL PROGRAM (Resource Conservation and Recovery Act (tracking hazardous waste)) Business NAICS classification: SOLID WASTE COLLECTION.; HAZARDOUS WASTE COLLECTION. Organizations: ART V CERBONI (CONTACT/OPERATOR)
INTEGRATED WASTE MGMT (2230 S RIVERSIDE AVE in RIALTO, CA)
STATE MASTER (California - Hazardous Waste Tracking) - HAZARDOU WASTE PROGRAM TRANSPORTER (Resource Conservation and Recovery Act (tracking hazardous waste)) - notification Organizations: JIM ARNOLD (CONTACT/OWNER)
NUCKLES OIL, INC DBA MERIT OIL CO (1020 W BLOOMINGTON AVE in RIALTO, CA)
STATE MASTER (California - Hazardous Waste Tracking) - HAZARDOU WASTE PROGRAM Small Quantity Generators, between 100 kg and 1000 kg of hazardous waste/month (Resource Conservation and Recovery Act (tracking hazardous waste))
FED EX GROUND (330 W RESOURCE DR in RIALTO, CA)
STATE MASTER (California - Hazardous Waste Tracking) - HAZARDOU WASTE PROGRAM Small Quantity Generators, between 100 kg and 1000 kg of hazardous waste/month (Resource Conservation and Recovery Act (tracking hazardous waste)) - notification
CALTRANS SLOVER MAINT STATION (451 W SLOVER RD in RIALTO, CA)
STATE MASTER (California - Hazardous Waste Tracking) - HAZARDOU WASTE PROGRAM Small Quantity Generators, between 100 kg and 1000 kg of hazardous waste/month (Resource Conservation and Recovery Act (tracking hazardous waste)) - notification Alternative names: CALTRANS DISTRICT 8
EISENHOWER SENIOR HIGH (1321 N. LILAC AVE. in RIALTO, CA)
(National Center for Education Statistics) - STATE ID-3633005 Organizations: RIALTO UNIFIED (SCHOOL DISTRICT)
MORGAN ELEMENTARY (1571 N. SYCAMORE AVE. in RIALTO, CA)
(National Center for Education Statistics) - STATE ID-6036669 Organizations: RIALTO UNIFIED (SCHOOL DISTRICT)
HENRY ELEMENTARY (470 E. ETIWANDA AVE. in RIALTO, CA)
(National Center for Education Statistics) - STATE ID-6036644 Organizations: RIALTO UNIFIED (SCHOOL DISTRICT)
MYERS ELEMENTARY (975 N. MERIDIAN AVE. in RIALTO, CA)
(National Center for Education Statistics) - STATE ID-6036677 Organizations: RIALTO UNIFIED (SCHOOL DISTRICT)
Housing units lacking complete plumbing facilities: 0.6% Housing units lacking complete kitchen facilities: 2.7%
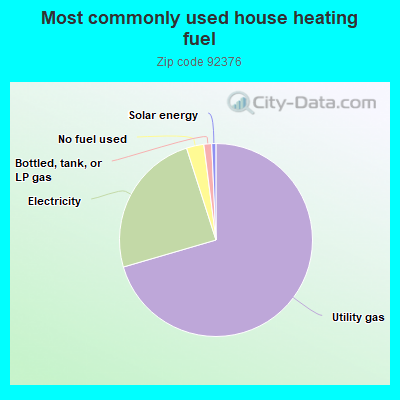
70.2%Utility gas
24.5%Electricity
2.9%No fuel used
1.3%Bottled, tank, or LP gas
0.7%Solar energy
Population in 1990: 75,341. Population change in the 1990s: +534 (+0.7%).
Place of birth for U.S.-born residents:
This state: 55,536
Northeast: 654
Midwest: 944
South: 2,389
West: 885
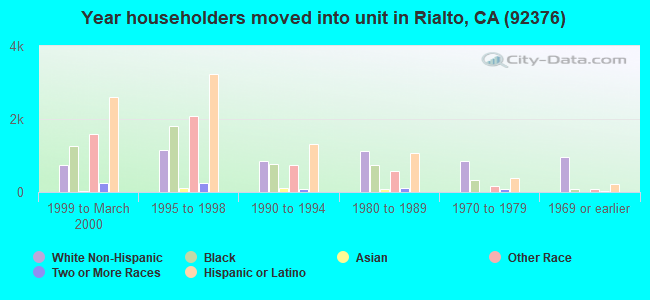
49% of the 92376 zip code residents lived in the same house 5 years ago. Out of people who lived in different houses, 66% lived in this county. Out of people who lived in different counties, 50% lived in California.
93% of the 92376 zip code residents lived in the same house 1 year ago. Out of people who lived in different houses, 67% moved from this county. Out of people who lived in different houses, 26% moved from different county within same state. Out of people who lived in different houses, 3% moved from different state. Out of people who lived in different houses, 4% moved from abroad.
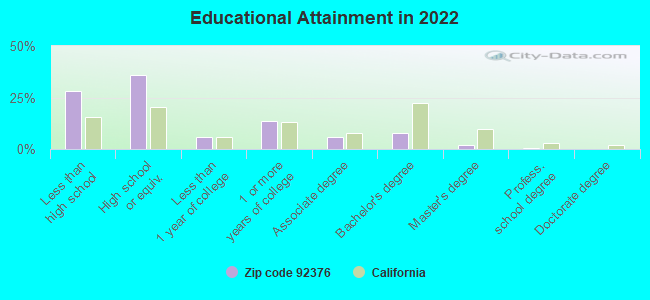
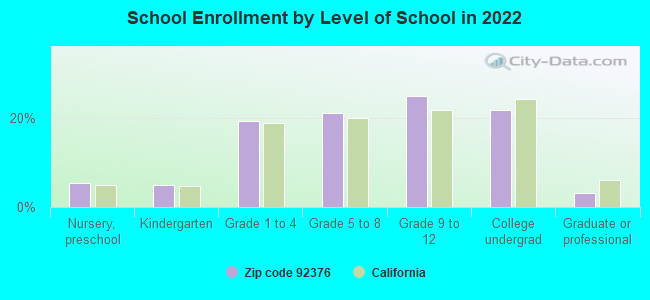
Private vs. public school enrollment:
Students in private schools in grades 1 to 8 (elementary and middle school): 184
Here:
1.8%
California:
10.5%
Students in private schools in grades 9 to 12 (high school): 163
Here:
2.6%
California:
8.5%
Students in private undergraduate colleges: 742
Here:
13.4%
California:
15.9%
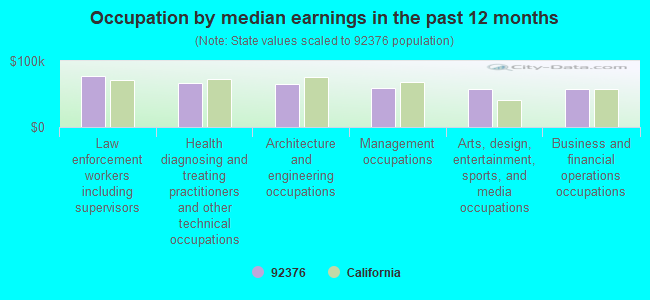
Occupation by median earnings in the past 12 months ($)
77,041Law enforcement workers including supervisors
66,004Health diagnosing and treating practitioners and other technical occupations
65,828Architecture and engineering occupations
59,828Management occupations
58,128Arts, design, entertainment, sports, and media occupations
58,012Business and financial operations occupations
Companies with federal contracts located in this zip code (RIALTO, CA):
MARTINEZ & TUREK INC (300 S CEDAR AVE; small business) : $349,954 in 6 contractsfrom 2001 to 2005
Contracts for Structural Shapes, Nonferrous Base Metal, Hardware, Commercial, Miscellaneous Vehicular Components, Other Professional Services, and moreby Navy Signed by year:2000: $0; 2001: $72,052; 2002: $0; 2003: $166,327; 2004: $25,248; 2005: $86,327; 2006: $0.
Biggest contracts:
$93,120 with Navy for Structural Shapes, Nonferrous Base Metal. Signed on 2003-05-05. Completion date: 2003-09-08.
$73,207 with Navy for Hardware, Commercial. Signed on 2003-08-12. Completion date: 2003-12-16.
$72,052 with Navy for Miscellaneous Vehicular Components. Signed on 2001-09-11. Completion date: 2001-10-31.
$51,520 with Navy for Miscellaneous Vehicular Components. Taking place in MD. Signed on 2005-04-05. Completion date: 2005-04-26.
CLARKLIFT OF CALIFORNIA, INC (1762 S SYCAMORE AVE; small business) : $86,758 in 6 contractsfrom 2003 to 2005
Contracts for Miscellaneous Materials Handling Equipment, Miscellaneous Construction Equipment, Maintenance, Repair or Alteration of Real Property -- Government-Owned Government-Operated (GOGO) R&D Facilities, Maintenance, Repair and Rebuilding of Equipment -- Special Industry Machinery, and moreby Army, Navy, Bureau of Citizenship and Immigration Signed by year:2000: $0; 2001: $0; 2002: $0; 2003: $38,607; 2004: $12,231; 2005: $35,920; 2006: $0.
Biggest contracts:
$31,461 with Army for Miscellaneous Materials Handling Equipment. Signed on 2003-09-19. Completion date: 2004-01-09.
$30,920 with Army for Miscellaneous Construction Equipment. Signed on 2005-05-16. Completion date: 2005-05-27.
$7,146 with Army for Maintenance, Repair or Alteration of Real Property -- Government-Owned Government-Operated (GOGO) R&D Facilities. Signed on 2003-01-23. Completion date: 2003-01-24.
$6,682 with Navy for Maintenance, Repair and Rebuilding of Equipment -- Special Industry Machinery. Signed on 2004-01-22. Completion date: 2004-02-13.
SPRAY ENCLOSURE TECHNOLOGIES I (1427 N LINDEN AVE # A; small business) : $59,004 in 5 contractsfrom 2005 to 2006
Contracts for Miscellaneous Maintenance and Repair Shop Specialized Equipment, Rigid Wall Shelters, Cabinets, Lockers, Bins, and Shelving by Air Force, Army Signed by year:2000: $0; 2001: $0; 2002: $0; 2003: $0; 2004: $0; 2005: $40,854; 2006: $18,150.
Biggest contracts:
$17,060 with Air Force for Miscellaneous Maintenance and Repair Shop Specialized Equipment. Signed on 2005-04-20. Completion date: 2005-05-25.
$16,092 with Air Force for Rigid Wall Shelters. Signed on 2005-03-10. Completion date: 2005-03-23.
$9,505 with Air Force for Cabinets, Lockers, Bins, and Shelving. Signed on 2006-06-27. Completion date: 2006-07-13.
$8,645 with Army for Miscellaneous Maintenance and Repair Shop Specialized Equipment. Signed on 2006-03-28. Completion date: 2006-04-25.
LANDMARK LASER PRINTER SERVICE (341 W VALLEY BLVD; small business)
$8,808 with Navy for Miscellaneous Office Machines. Signed on 2004-10-01. Completion date: 2004-10-01.
NYCO SYSTEMS INC (201 EAST SECOND ST; small business) : $4,230 in 2 contractsin 2006
$3,400 with Army for Maintenance, Repair and Rebuilding of Equipment -- Metalworking Machinery. Signed on 2006-05-16. Completion date: 2006-06-19.
$830 with Army for Maintenance, Repair and Rebuilding of Equipment -- Metalworking Machinery. Taking place in NY. Signed on 2006-06-08. Completion date: 2006-06-26.
Top industries in this zip code by the number of employees in 2005:
2005 - 2018 National Fire Incident Reporting System (NFIRS) incidents
According to the data from the years 2005 - 2018 the average number of fire incidents per year is 96. The highest number of reported fire incidents - 280 took place in 2005, and the least - 6 in 2010. The data has a decreasing trend.
When looking into fire subcategories, the most incidents belonged to: Outside Fires (44.5%), and Structure Fires (32.4%).
Fire incident types reported to NFIRS in Zip Code 92376


 Nearest zip codes: 92316, 92377, 92411, 92410, 92405, 92401.


 According to the data from the years 2005 - 2018 the average number of fire incidents per year is 96. The highest number of reported fire incidents - 280 took place in 2005, and the least - 6 in 2010. The data has a decreasing trend.
 When looking into fire subcategories, the most incidents belonged to: Outside Fires (44.5%), and Structure Fires (32.4%).