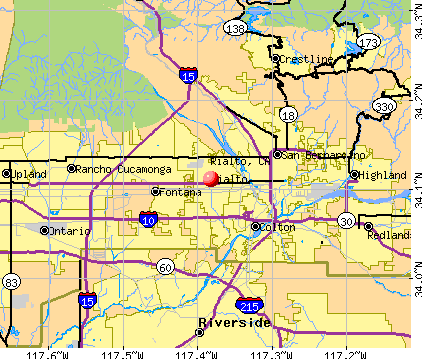
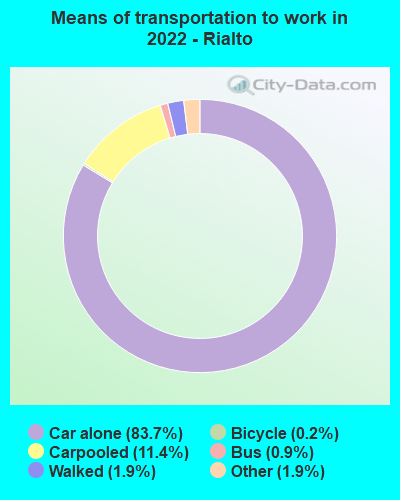
Rialto, California
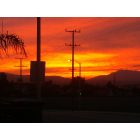
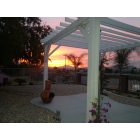
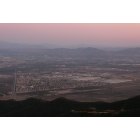
Rialto: sunrise
Rialto: Sunrise Church on the corner of Ayala Dr. and Riverside Ave. in Rialto, California
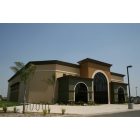
Rialto: Inland Lighthouse Church
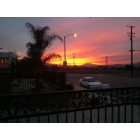
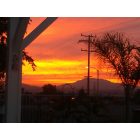
Rialto: sunrise 2
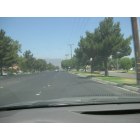
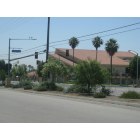
Rialto: Riverside Ave. in Rialto, California
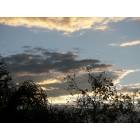
Rialto: sunrise 3
Rialto: sunrise 4
Rialto
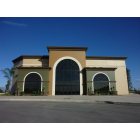
Rialto: Inland Lighthouse Church
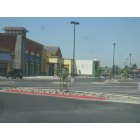
Rialto: Shopping market in Rialto
Rialto: North Rialto with Target Distribution Center on Right.
- see
15
more - add
your
Submit your own pictures of this city and show them to the world
- OSM Map
- General Map
- Google Map
- MSN Map
Population change since 2000: +12.7%
 |
| Males: 50,804 | |
| Females: 52,741 |
| Median resident age: | 33.9 years |
| California median age: | 37.9 years |
Zip codes: 92376.
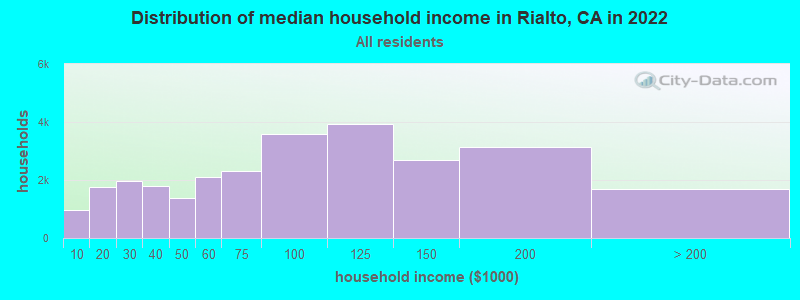
| Rialto: | $85,585 |
| CA: | $91,551 |
Estimated per capita income in 2022: $25,683 (it was $13,375 in 2000)
Rialto city income, earnings, and wages data
Estimated median house or condo value in 2022: $482,000 (it was $113,200 in 2000)
| Rialto: | $482,000 |
| CA: | $715,900 |
Mean prices in 2022: all housing units: $468,985; detached houses: $512,841; townhouses or other attached units: $457,523; in 3-to-4-unit structures: $638,427; in 5-or-more-unit structures: $441,276; mobile homes: $56,696
Median gross rent in 2022: $1,627.
(11.9% for White Non-Hispanic residents, 13.4% for Black residents, 13.0% for Hispanic or Latino residents, 3.3% for American Indian residents, 17.1% for other race residents, 11.8% for two or more races residents)
Detailed information about poverty and poor residents in Rialto, CA


Compare current foreclosures in Rialto, CA:
| Photo | Address | Area | Beds / Baths | Price | Details |
|---|---|---|---|---|---|

|
#1
S Willow Ave
Rialto, CA 92376
|
1,164 sq. feet
|
2 baths 3 beds |
show details | |

|
#2
Terrace Rd
Rialto, CA 92376
|
1,443 sq. feet
|
2 baths 4 beds |
show details | |

|
#3
N Orange Ave
Rialto, CA 92376
|
592 sq. feet
|
1 baths 2 beds |
show details | |

|
#4
N Eucalyptus Ave
Rialto, CA 92376
|
2,615 sq. feet
|
3 baths 4 beds |
show details | |

|
#5
Fernwood Ave
Rialto, CA 92377
|
1,211 sq. feet
|
2 baths 3 beds |
show details | |

|
#6
S Arrowhead Ave
Rialto, CA 92376
|
1,986 sq. feet
|
2 baths 4 beds |
show details | |

|
#7
E Mesa Dr
Rialto, CA 92376
|
1,868 sq. feet
|
2 baths 4 beds |
show details | |

|
#8
W Calle Celeste Dr
Rialto, CA 92377
|
2,240 sq. feet
|
2 baths 4 beds |
show details | |

|
#9
N Glenwood Ave
Rialto, CA 92376
|
1,721 sq. feet
|
4 baths 3 beds |
show details | |

|
#10
W Calle Celeste Dr
Rialto, CA 92377
|
2,240 sq. feet
|
2 baths 4 beds |
show details |
| Photo | Address | Area | Beds / Baths | Price | Details |
|---|---|---|---|---|---|

|
#11
E Easton St
Rialto, CA 92376
|
1,445 sq. feet
|
2 baths 4 beds |
show details | |

|
#12
N Elmwood Ave
Rialto, CA 92376
|
1,736 sq. feet
|
2 baths 4 beds |
show details | |

|
#13
W Summerset Dr
Rialto, CA 92377
|
1,503 sq. feet
|
2 baths 4 beds |
show details | |

|
#14
W Grove St
Rialto, CA 92376
|
1,359 sq. feet
|
1 baths 3 beds |
show details | |

|
#15
N Glenwood Ave
Rialto, CA 92376
|
1,765 sq. feet
|
3 baths 4 beds |
show details | |

|
#16
Verbena Dr
Rialto, CA 92377
|
2,537 sq. feet
|
3 baths 4 beds |
show details | |

|
#17
N Linden Ave Spc 275
Rialto, CA 92376
|
1,440 sq. feet
|
2 baths 3 beds |
show details | |

|
#18
N Oakdale Ave
Rialto, CA 92376
|
1,765 sq. feet
|
3 baths 4 beds |
show details | |

|
#19
E Shamrock St
Rialto, CA 92376
|
1,456 sq. feet
|
2 baths 3 beds |
show details | |

|
#20
N Linden Ave
Rialto, CA 92376
|
1,240 sq. feet
|
2 baths 3 beds |
show details |
| Photo | Address | Area | Beds / Baths | Price | Details |
|---|---|---|---|---|---|

|
#21
W Grove St
Rialto, CA 92376
|
1,074 sq. feet
|
1 baths 3 beds |
show details | |

|
#22
N Olive Ave
Rialto, CA 92376
|
1,096 sq. feet
|
2 baths 2 beds |
show details | |

|
#23
S Glenwood Ave
Rialto, CA 92376
|
1,316 sq. feet
|
2 baths 3 beds |
show details | |

|
#24
N Lancewood Ave
Rialto, CA 92376
|
1,240 sq. feet
|
2 baths 3 beds |
show details | |

|
#25
W Grove St
Rialto, CA 92376
|
1,425 sq. feet
|
2 baths 3 beds |
show details | |

|
#26
S Riverside Ave
Rialto, CA 92376
|
1,080 sq. feet
|
1 baths 3 beds |
show details | |

|
#27
N Ashford Ave
Rialto, CA 92377
|
1,758 sq. feet
|
2 baths 4 beds |
show details | |

|
#28
W Summerset Dr
Rialto, CA 92377
|
1,915 sq. feet
|
2 baths 4 beds |
show details | |

|
#29
Cedar Ave
Rialto, CA 92377
|
1,664 sq. feet
|
2 baths 3 beds |
show details | |

|
#30
W Loma Vista Dr
Rialto, CA 92377
|
2,126 sq. feet
|
2 baths 4 beds |
show details |
| Photo | Address | Area | Beds / Baths | Price | Details |
|---|---|---|---|---|---|

|
#31
W Merrill Ave
Rialto, CA 92376
|
1,153 sq. feet
|
1 baths 2 beds |
show details | |

|
#32
W Grove St
Rialto, CA 92376
|
1,172 sq. feet
|
1 baths 2 beds |
show details | |

|
#33
W Mariposa Dr
Rialto, CA 92376
|
1,459 sq. feet
|
2 baths 4 beds |
show details | |

|
#34
Terrace Rd
Rialto, CA 92376
|
1,443 sq. feet
|
2 baths 4 beds |
show details | |

|
#35
Esperanza St
Rialto, CA 92376
|
1,372 sq. feet
|
2 baths 4 beds |
show details | |

|
#36
W Victoria St
Rialto, CA 92376
|
1,074 sq. feet
|
1 baths 3 beds |
show details | |

|
#37
N Aspen Ave
Rialto, CA 92376
|
1,508 sq. feet
|
2 baths 4 beds |
show details | |

|
#38
N Pine Ave
Rialto, CA 92376
|
1,499 sq. feet
|
2 baths 3 beds |
show details | |

|
#39
W Buxton St
Rialto, CA 92377
|
1,574 sq. feet
|
2 baths 3 beds |
show details | |

|
#40
E Belmont Ave
Rialto, CA 92377
|
1,712 sq. feet
|
2 baths 4 beds |
show details |
| Photo | Address | Area | Beds / Baths | Price | Details |
|---|---|---|---|---|---|

|
#41
S Iris Ave
Rialto, CA 92376
|
1,193 sq. feet
|
2 baths 3 beds |
show details | |

|
#42
N Verde Ave
Rialto, CA 92376
|
1,765 sq. feet
|
2 baths 4 beds |
show details | |

|
#43
W Morgan St
Rialto, CA 92376
|
1,375 sq. feet
|
3 baths 4 beds |
show details | |

|
#44
W Victoria St
Rialto, CA 92376
|
1,673 sq. feet
|
2 baths 4 beds |
show details | |

|
#45
N Clifford Ave
Rialto, CA 92376
|
1,298 sq. feet
|
2 baths 3 beds |
show details | |

|
#46
Anaconda St
Rialto, CA 92376
|
1,107 sq. feet
|
2 baths 3 beds |
show details | |

|
#47
N Encina Ave
Rialto, CA 92376
|
2,056 sq. feet
|
2 baths 4 beds |
show details | |

|
#48
N Church Ave
Rialto, CA 92376
|
1,232 sq. feet
|
2 baths 3 beds |
show details | |

|
#49
W La Gloria Dr
Rialto, CA 92377
|
1,272 sq. feet
|
2 baths 3 beds |
show details | |

|
Check over 1 million property listings on Foreclosure.com!
|
browse all offers | |||


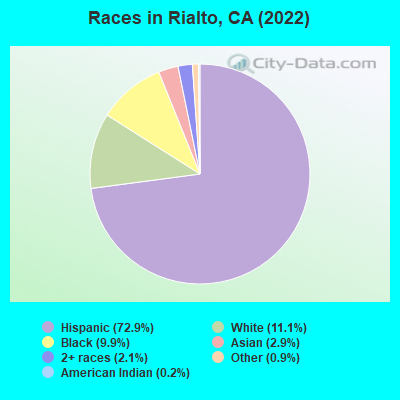
- 75,49272.9%Hispanic
- 11,51011.1%White alone
- 10,2469.9%Black alone
- 2,9842.9%Asian alone
- 2,1732.1%Two or more races
- 9290.9%Other race alone
- 2170.2%American Indian alone
- 130.01%Native Hawaiian and Other
Pacific Islander alone
According to our research of California and other state lists, there were 146 registered sex offenders living in Rialto, California as of April 27, 2024.
The ratio of all residents to sex offenders in Rialto is 708 to 1.
The ratio of registered sex offenders to all residents in this city is near the state average.
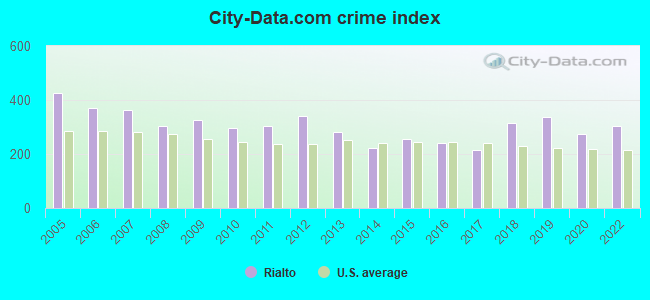
The City-Data.com crime index weighs serious crimes and violent crimes more heavily. Higher means more crime, U.S. average is 246.1. It adjusts for the number of visitors and daily workers commuting into cities.
- means the value is smaller than the state average.- means the value is about the same as the state average.
- means the value is bigger than the state average.
- means the value is much bigger than the state average.
Crime rate in Rialto detailed stats: murders, rapes, robberies, assaults, burglaries, thefts, arson
Full-time law enforcement employees in 2021, including police officers: 146 (111 officers - 92 male; 19 female).
| Officers per 1,000 residents here: | 1.06 |
| California average: | 2.30 |
 Recent articles from our blog. Our writers, many of them Ph.D. graduates or candidates, create easy-to-read articles on a wide variety of topics.

 | Relocating to Rialto- looking for recommendations on places to live outside Rialto (3 replies) |
| UT: San Diego home sales hit lowest level in 35 years. (43 replies) |
| Berkeley just down to one movie theater (31 replies) |
| Moreno Valley is so affordable. City appears ‘normal’ (47 replies) |
| Honest opinions of Rialto? (43 replies) |
| Thinking of moving to Southern California (8 replies) |
Latest news from Rialto, CA collected exclusively by city-data.com from local newspapers, TV, and radio stations
Ancestries: American (1.4%).
Current Local Time: PST time zone
Elevation: 1240 feet
Land area: 21.9 square miles.
Population density: 4,734 people per square mile (average).
26,516 residents are foreign born (22.8% Latin America).
| This city: | 25.4% |
| California: | 26.5% |
Median real estate property taxes paid for housing units with mortgages in 2022: $2,938 (0.6%)
Median real estate property taxes paid for housing units with no mortgage in 2022: $2,357 (0.5%)
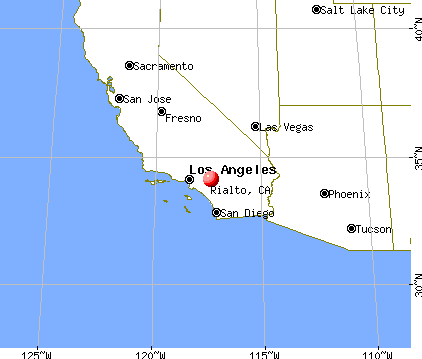
Nearest city with pop. 200,000+: Riverside, CA  (11.3 miles , pop. 255,166).
Nearest city with pop. 1,000,000+: Los Angeles, CA (56.9 miles , pop. 3,694,820).
Nearest cities:
), ), Latitude: 34.11 N, Longitude: 117.38 W
Daytime population change due to commuting: -7,266 (-7.0%)
Workers who live and work in this city: 14,308 (30.5%)
Area code: 909
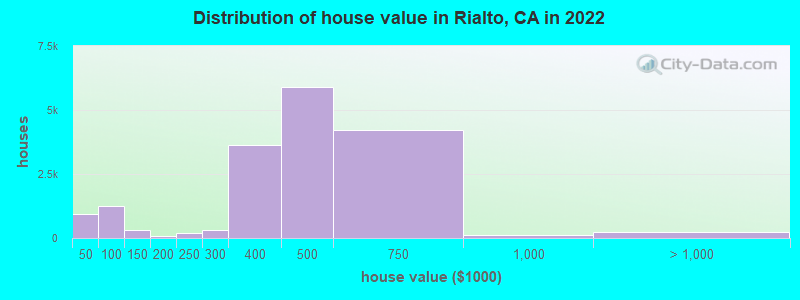
Property values in Rialto, CA

Rialto, California accommodation & food services, waste management - Economy and Business Data
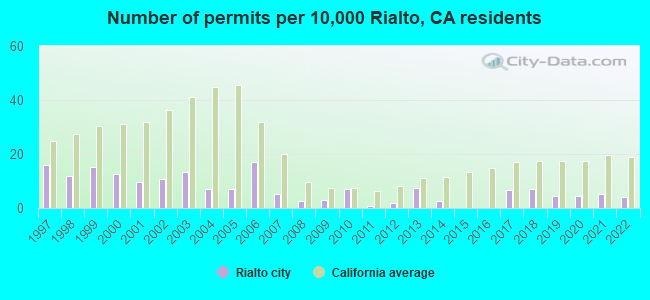
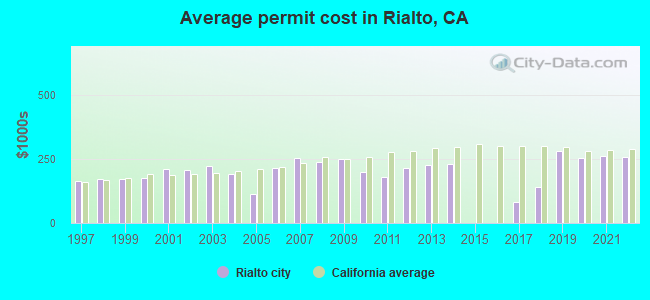
Single-family new house construction building permits:
- 2022: 36 buildings, average cost: $259,400
- 2021: 47 buildings, average cost: $261,700
- 2020: 42 buildings, average cost: $254,700
- 2019: 42 buildings, average cost: $280,100
- 2018: 65 buildings, average cost: $139,900
- 2017: 61 buildings, average cost: $84,200
- 2014: 24 buildings, average cost: $230,200
- 2013: 69 buildings, average cost: $227,800
- 2012: 16 buildings, average cost: $214,400
- 2011: 7 buildings, average cost: $181,100
- 2010: 66 buildings, average cost: $198,300
- 2009: 26 buildings, average cost: $249,700
- 2008: 23 buildings, average cost: $238,700
- 2007: 49 buildings, average cost: $254,000
- 2006: 157 buildings, average cost: $215,700
- 2005: 66 buildings, average cost: $112,000
- 2004: 63 buildings, average cost: $189,600
- 2003: 121 buildings, average cost: $222,200
- 2002: 99 buildings, average cost: $209,100
- 2001: 90 buildings, average cost: $210,100
- 2000: 115 buildings, average cost: $176,600
- 1999: 141 buildings, average cost: $173,900
- 1998: 110 buildings, average cost: $170,500
- 1997: 147 buildings, average cost: $163,000
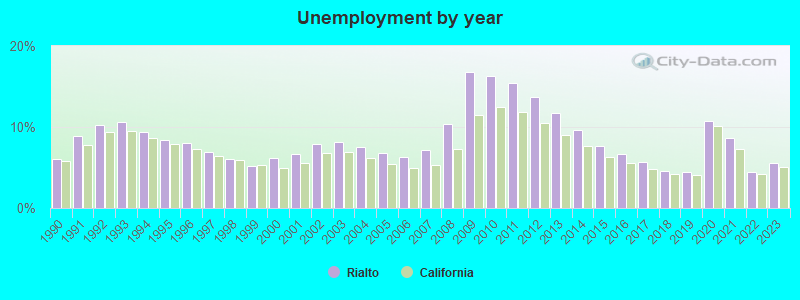
| Here: | 5.6% |
| California: | 5.1% |
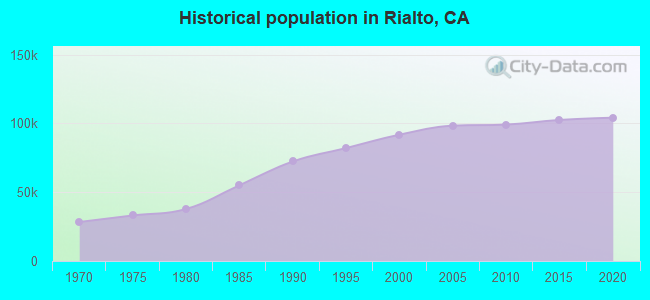
Population change in the 1990s: +18,066 (+24.5%).
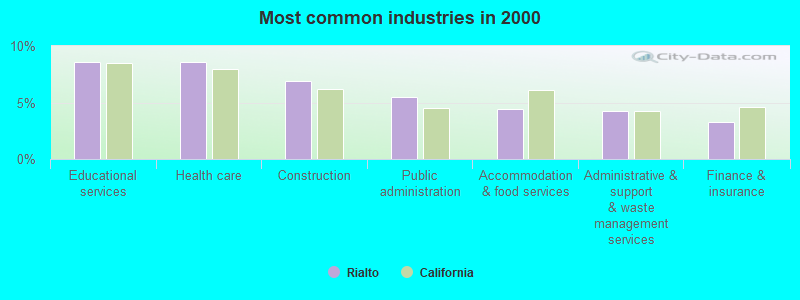
- Educational services (8.6%)
- Health care (8.5%)
- Construction (6.9%)
- Public administration (5.5%)
- Accommodation & food services (4.5%)
- Administrative & support & waste management services (4.3%)
- Finance & insurance (3.3%)

- Construction (11.5%)
- Public administration (5.0%)
- Administrative & support & waste management services (4.7%)
- Metal & metal products (4.6%)
- Educational services (4.4%)
- Truck transportation (4.1%)
- Accommodation & food services (3.7%)
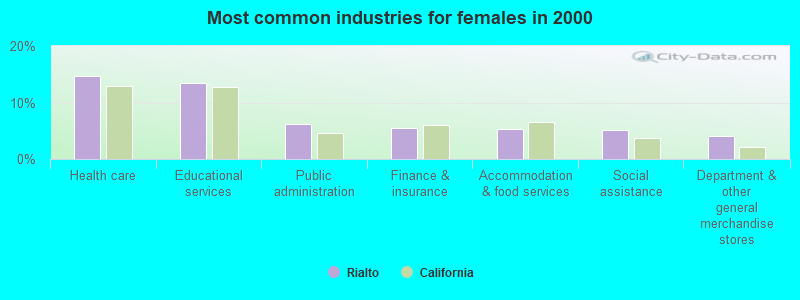
- Health care (14.7%)
- Educational services (13.5%)
- Public administration (6.2%)
- Finance & insurance (5.5%)
- Accommodation & food services (5.3%)
- Social assistance (5.1%)
- Department & other general merchandise stores (4.1%)
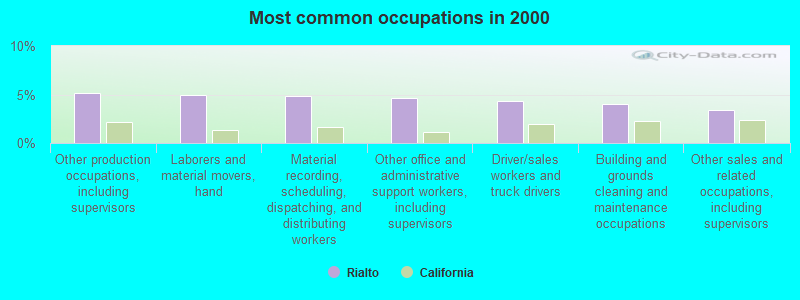
- Other production occupations, including supervisors (5.2%)
- Laborers and material movers, hand (5.0%)
- Material recording, scheduling, dispatching, and distributing workers (4.8%)
- Other office and administrative support workers, including supervisors (4.6%)
- Driver/sales workers and truck drivers (4.3%)
- Building and grounds cleaning and maintenance occupations (4.0%)
- Other sales and related occupations, including supervisors (3.5%)
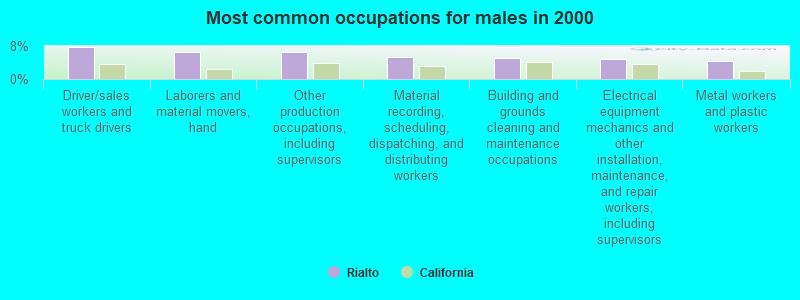
- Driver/sales workers and truck drivers (7.7%)
- Laborers and material movers, hand (6.6%)
- Other production occupations, including supervisors (6.4%)
- Material recording, scheduling, dispatching, and distributing workers (5.2%)
- Building and grounds cleaning and maintenance occupations (5.1%)
- Electrical equipment mechanics and other installation, maintenance, and repair workers, including supervisors (4.9%)
- Metal workers and plastic workers (4.4%)
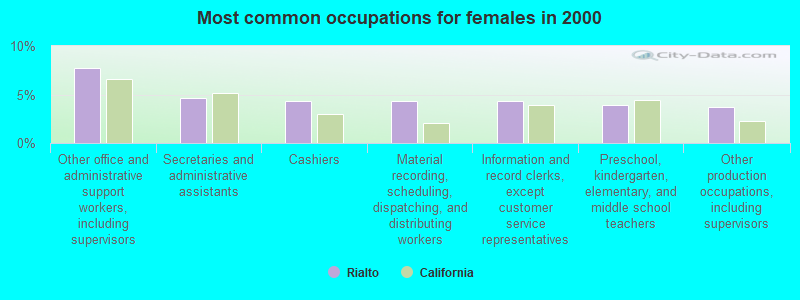
- Other office and administrative support workers, including supervisors (7.7%)
- Secretaries and administrative assistants (4.7%)
- Cashiers (4.4%)
- Material recording, scheduling, dispatching, and distributing workers (4.3%)
- Information and record clerks, except customer service representatives (4.3%)
- Preschool, kindergarten, elementary, and middle school teachers (3.9%)
- Other production occupations, including supervisors (3.7%)
Average climate in Rialto, California
Based on data reported by over 4,000 weather stations


|
|

(lower is better)
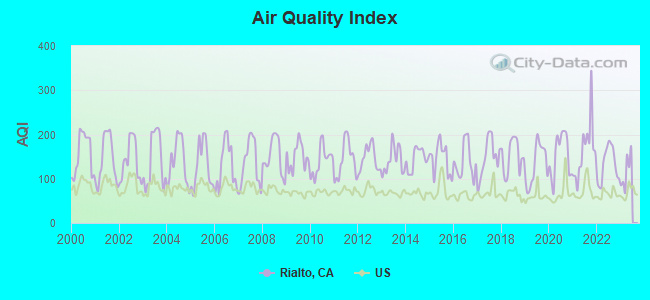
Air Quality Index (AQI) level in 2022 was 133. This is significantly worse than average.
| City: | 133 |
| U.S.: | 73 |
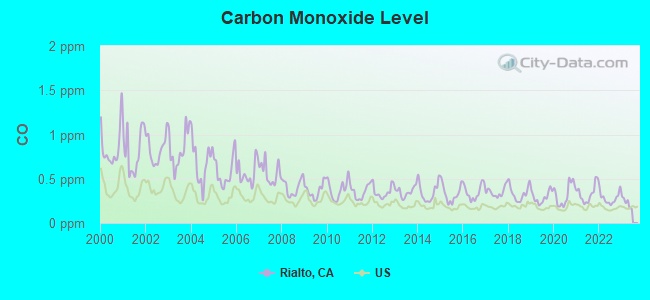
Carbon Monoxide (CO) [ppm] level in 2022 was 0.284. This is about average. Closest monitor was 4.4 miles away from the city center.
| City: | 0.284 |
| U.S.: | 0.251 |
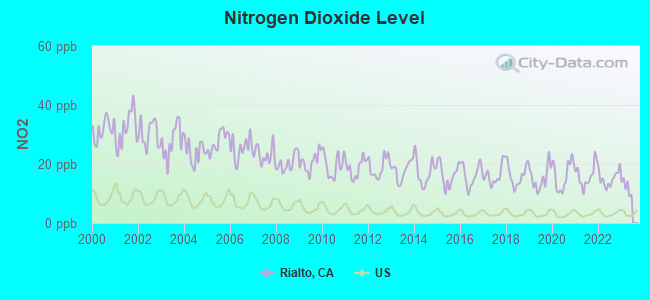
Nitrogen Dioxide (NO2) [ppb] level in 2022 was 15.1. This is significantly worse than average. Closest monitor was 5.5 miles away from the city center.
| City: | 15.1 |
| U.S.: | 5.1 |
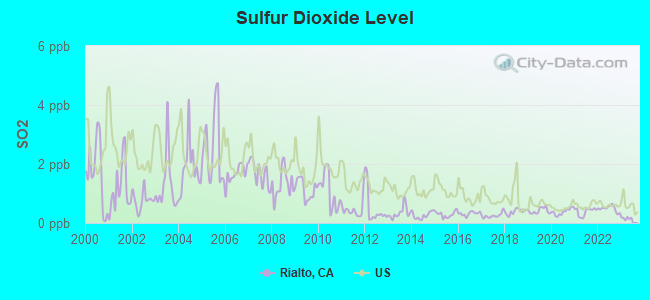
Sulfur Dioxide (SO2) [ppb] level in 2022 was 0.488. This is significantly better than average. Closest monitor was 5.5 miles away from the city center.
| City: | 0.488 |
| U.S.: | 1.515 |
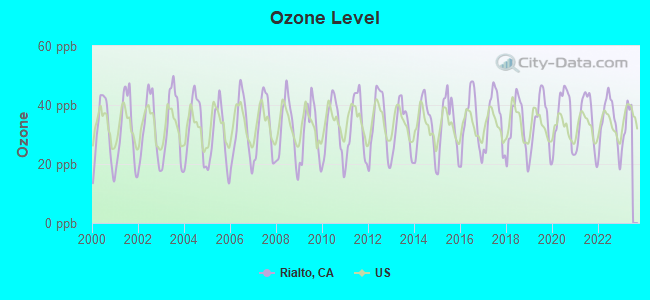
Ozone [ppb] level in 2022 was 34.3. This is about average. Closest monitor was 5.5 miles away from the city center.
| City: | 34.3 |
| U.S.: | 33.3 |
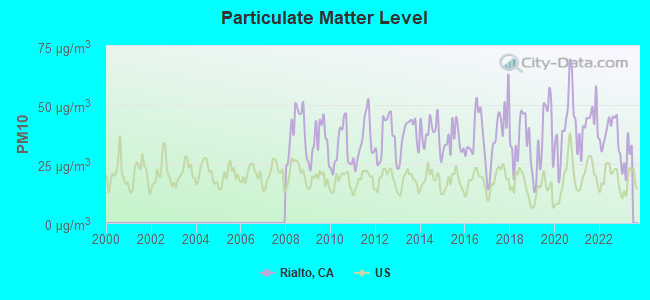
Particulate Matter (PM10) [µg/m3] level in 2022 was 38.3. This is significantly worse than average. Closest monitor was 6.2 miles away from the city center.
| City: | 38.3 |
| U.S.: | 19.2 |
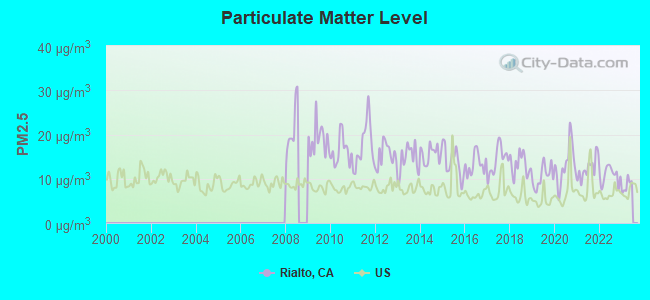
Particulate Matter (PM2.5) [µg/m3] level in 2022 was 10.8. This is worse than average. Closest monitor was 6.2 miles away from the city center.
| City: | 10.8 |
| U.S.: | 8.1 |
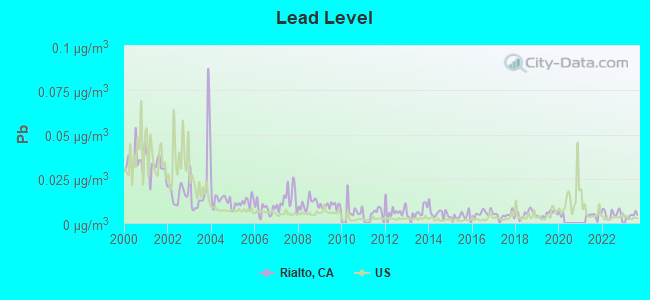
Lead (Pb) [µg/m3] level in 2023 was 0.00426. This is significantly better than average. Closest monitor was 5.5 miles away from the city center.
| City: | 0.00426 |
| U.S.: | 0.00931 |
Earthquake activity:
Rialto-area historical earthquake activity is significantly above California state average. It is 7361% greater than the overall U.S. average.On 6/28/1992 at 11:57:34, a magnitude 7.6 (6.2 MB, 7.6 MS, 7.3 MW, Depth: 0.7 mi, Class: Major, Intensity: VIII - XII) earthquake occurred 48.9 miles away from Rialto center, causing 3 deaths (1 shaking deaths, 2 other deaths) and 400 injuries, causing $100,000,000 total damage and $40,000,000 insured losses
On 7/21/1952 at 11:52:14, a magnitude 7.7 (7.7 UK) earthquake occurred 110.8 miles away from Rialto center, causing $50,000,000 total damage
On 10/16/1999 at 09:46:44, a magnitude 7.4 (6.3 MB, 7.4 MS, 7.2 MW, 7.3 ML) earthquake occurred 60.9 miles away from Rialto center
On 6/28/1992 at 15:05:30, a magnitude 6.9 (6.3 MB, 6.7 MS, 6.5 MW, 6.9 ME, Depth: 3.1 mi, Class: Strong, Intensity: VII - IX) earthquake occurred 34.6 miles away from Rialto center
On 5/19/1940 at 04:36:40, a magnitude 7.2 (7.2 UK) earthquake occurred 114.9 miles away from Rialto center, causing $33,000,000 total damage
On 4/21/1918 at 22:32:30, a magnitude 6.8 (6.8 UK) earthquake occurred 21.0 miles away from Rialto center
Magnitude types: body-wave magnitude (MB), energy magnitude (ME), local magnitude (ML), surface-wave magnitude (MS), moment magnitude (MW)
Natural disasters:
The number of natural disasters in San Bernardino County (46) is a lot greater than the US average (15).Major Disasters (Presidential) Declared: 27
Emergencies Declared: 2
Causes of natural disasters: Fires: 24, Floods: 18, Storms: 9, Winter Storms: 6, Landslides: 5, Mudslides: 4, Heavy Rains: 2, Earthquake: 1, Flash Flood: 1, Freeze: 1, Hurricane: 1, Snow: 1, Tornado: 1, Tropical Storm: 1, Wind: 1, Other: 1 (Note: some incidents may be assigned to more than one category).

Hospitals and medical centers in Rialto:
Amtrak stations near Rialto:
- 5 miles: SAN BERNADINO (SAN BERNARDINO, 1170 W. 3RD ST.) . Services: ticket office, partially wheelchair accessible, public payphones, free short-term parking, free long-term parking.
- 10 miles: RIVERSIDE (4066 VINE ST.) - Bus Station . Services: fully wheelchair accessible, public payphones, full-service food facilities, free short-term parking, free long-term parking, call for car rental service, call for taxi service, public transit connection.
- 15 miles: MORENO VALLEY (ARCO MINI MART, 2624 E. ALESSANDRO BLVD.) - Bus Station . Services: public payphones.
Colleges/universities with over 2000 students nearest to Rialto:
- San Bernardino Valley College (about 5 miles; San Bernardino, CA; Full-time enrollment: 7,444)
- California State University-San Bernardino (about 7 miles; San Bernardino, CA; FT enrollment: 15,748)
- The Art Institute of California-Argosy University Inland Empire (about 7 miles; San Bernardino, CA; FT enrollment: 2,238)
- Loma Linda University (about 9 miles; Loma Linda, CA; FT enrollment: 2,839)
- Riverside City College (about 10 miles; Riverside, CA; FT enrollment: 10,661)
- University of California-Riverside (about 10 miles; Riverside, CA; FT enrollment: 20,647)
- Chaffey College (about 12 miles; Rancho Cucamonga, CA; FT enrollment: 10,496)
Public high schools in Rialto:
- RIALTO HIGH (Students: 2,212, Location: 595 S. EUCALYPTUS AVE., Grades: 9-12)
- WILMER AMINA CARTER HIGH (Students: 1,775, Location: 2630 N. LINDEN AVE., Grades: 9-12)
- EISENHOWER SENIOR HIGH (Students: 1,491, Location: 1321 N. LILAC AVE., Grades: 9-12)
- MILOR CONTINUATION HIGH (Students: 36, Location: 266 W. RANDALL, Grades: 9-12)
- ZUPANIC HIGH (Students: 36, Location: 266 W. RANDALL AVE., Grades: 9-12)
- BOB MURPHY COMMUNITY (Location: 149 N. ARROWHEAD AVE., Grades: 7-12)
Private high schools in Rialto:
Biggest public elementary/middle schools in Rialto:
- ETHEL KUCERA MIDDLE (Students: 1,182, Location: 2140 W. BUENA VISTA DR., Grades: 6-8)
- FRISBIE MIDDLE (Students: 1,125, Location: 1442 N. EUCALYPTUS AVE., Grades: 6-8)
- RIALTO MIDDLE (Students: 1,117, Location: 1262 W. RIALTO AVE., Grades: 6-8)
- KOLB MIDDLE (Students: 1,024, Location: 2351 N. SPRUCE ST., Grades: 6-8)
- CASEY ELEMENTARY (Students: 525, Location: 219 N. EUCALYPTUS AVE., Grades: KG-5)
- TRAPP ELEMENTARY (Students: 482, Location: 2750 N. RIVERSIDE AVE., Grades: KG-5)
- SAMUEL W. SIMPSON ELEMENTARY (Students: 471, Location: 1050 S. LILAC AVE., Grades: KG-5)
- ELIZABETH T. HUGHBANKS ELEMENTARY (Students: 456, Location: 2241 N. APPLE AVE., Grades: KG-5)
- EDWARD FITZGERALD ELEMENTARY (Students: 450, Location: 2568 W. TERRA VISTA DR., Grades: KG-5)
- CHARLOTTE N. WERNER ELEMENTARY (Students: 446, Location: 1050 W. RIALTO AVE., Grades: KG-5)
Private elementary/middle schools in Rialto:
Points of interest:
Notable locations in Rialto: Rialto Wastewater Treatment Plant (A), Southern Pacific Classification Yards (B), Agua Mansa Rest Area (C), Fontana Power Plant (D), San Bernardino Sheriff's Aviation Division Emergency Medical Services Transport (E), Rialto Fire Department Station 204 (F), Rialto Fire Department Station 202 (G), Rialto Fire Department Station 203 (H), Rialto Branch San Bernardino County Library (I), San Bernardino County Office of Emergency Services Hazardous Materials Division Building (J), San Bernardino County Hazardous Materials Division Business Office (K), Rialto Fire Department Station 201 (L). Display/hide their locations on the map
Shopping Centers: Renaisance Shopping Center (1), Cactus Retail Shopping Center (2), Rialto Value Center Shopping Center (3), Rialto Square Shopping Center (4), Rialto Shopping Center (5), Five Points Plaza Shopping Center (6), Baseline Shopping Center (7). Display/hide their locations on the map
Churches in Rialto include: Rialto Seventh Day Adventist Church (A), Bethany Presbyterian Church (B), Church of the Nazarene (C), First Christian Church (D), Memorial Baptist Church (E), Saint THomas Moore Church (F), Church of Christ (G), The Church of Jesus Christ of Latter Day Saints (H), Eastside Church of Christ (I). Display/hide their locations on the map
Cemetery: Agua Mansa Cemetery (1). Display/hide its location on the map
Parks in Rialto include: Frisbie Park (1), Rialto Park (2), Jerry Eaves Park (3), South Riverside Avenue Park (4). Display/hide their locations on the map
Hotel: Best Western Empire Inn (475 West Valley Boulevard) (1). Display/hide its approximate location on the map
Court: San Bernardino County - Behavioral Health Dept- Mental Health Counselor-Superior C (850 East Foothill Boulevard) (1). Display/hide its approximate location on the map
Birthplace of: R. Jay Soward - Football player, Ryan Grice-Mullen - Player of and football, Davonte Stewart - Sprinter, Sean Marshall - College basketball player (Boston College Eagles), Sean Marshall (basketball) - Basketball player, Will Funn - College basketball player (Portland State Vikings), Nick Theodorou - Baseball player.
| This city: | 3.9 people |
| California: | 2.9 people |
| This city: | 84.0% |
| Whole state: | 68.7% |
| This city: | 7.7% |
| Whole state: | 7.2% |
Likely homosexual households (counted as self-reported same-sex unmarried-partner households)
- Lesbian couples: 0.4% of all households
- Gay men: 0.2% of all households
People in group quarters in Rialto in 2010:
- 153 people in nursing facilities/skilled-nursing facilities
- 146 people in group homes intended for adults
- 45 people in workers' group living quarters and job corps centers
- 40 people in group homes for juveniles (non-correctional)
- 34 people in residential treatment centers for adults
- 29 people in other noninstitutional facilities
People in group quarters in Rialto in 2000:
- 249 people in homes for the mentally retarded
- 248 people in nursing homes
- 182 people in other group homes
- 55 people in other noninstitutional group quarters
- 24 people in homes or halfway houses for drug/alcohol abuse
- 23 people in homes for the mentally ill
- 17 people in other types of correctional institutions
- 6 people in other nonhousehold living situations
Banks with branches in Rialto (2011 data):
- Bank of America, National Association: Rialto Branch at 170 East Base Line, branch established on 1962/10/15; Rialto-Foothill Branch at 409 East Foothill Boulevard, branch established on 1958/03/24. Info updated 2009/11/18: Bank assets: $1,451,969.3 mil, Deposits: $1,077,176.8 mil, headquarters in Charlotte, NC, positive income, 5782 total offices, Holding Company: Bank Of America Corporation
- Wells Fargo Bank, National Association: Rialto Branch at 190 West Foothill Boulevard, branch established on 1963/08/15; Rialto Superior Branch at 151 West Base Line Road, branch established on 2006/11/06. Info updated 2011/04/05: Bank assets: $1,161,490.0 mil, Deposits: $905,653.0 mil, headquarters in Sioux Falls, SD, positive income, 6395 total offices, Holding Company: Wells Fargo & Company
- JPMorgan Chase Bank, National Association: Rialto Branch at 101 East Foothill Boulevard, branch established on 1889/01/01. Info updated 2011/11/10: Bank assets: $1,811,678.0 mil, Deposits: $1,190,738.0 mil, headquarters in Columbus, OH, positive income, International Specialization, 5577 total offices, Holding Company: Jpmorgan Chase & Co.
- Inland Community Bank, National Association: at 255 South Riverside Avenue, branch established on 1990/04/12. Info updated 2006/09/19: Bank assets: $223.2 mil, Deposits: $194.4 mil, local headquarters, negative income in the last year, Commercial Lending Specialization, 5 total offices, Holding Company: Fa Capital, Llc
For population 15 years and over in Rialto:
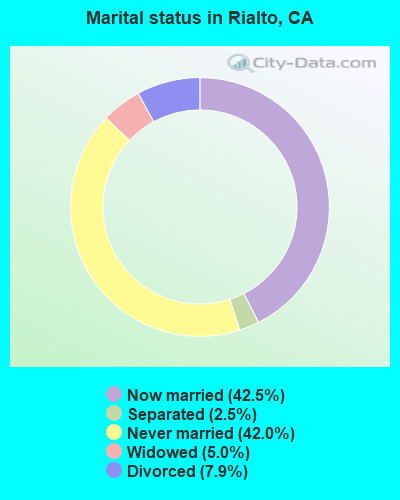
- Never married: 42.0%
- Now married: 42.5%
- Separated: 2.5%
- Widowed: 5.0%
- Divorced: 7.9%
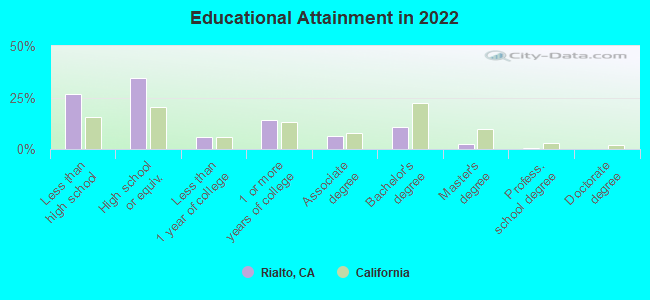
For population 25 years and over in Rialto:
- High school or higher: 73.3%
- Bachelor's degree or higher: 13.3%
- Graduate or professional degree: 2.8%
- Unemployed: 6.4%
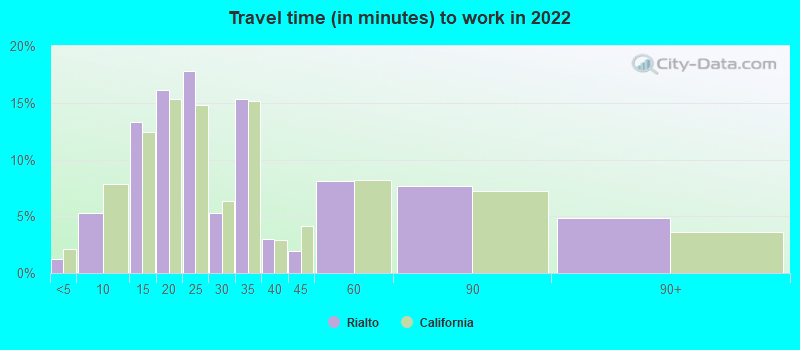
- Mean travel time to work (commute): 31.5 minutes
| Here: | 17.5 |
| California average: | 15.5 |
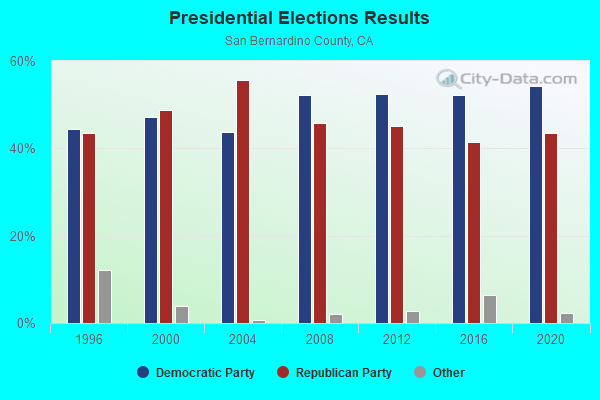
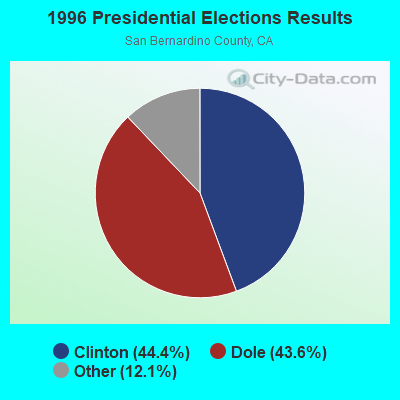
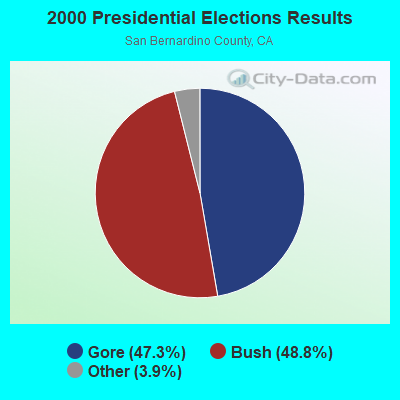
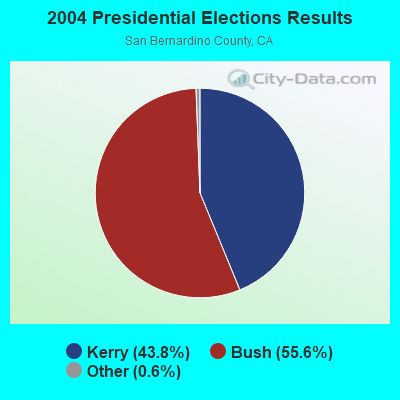
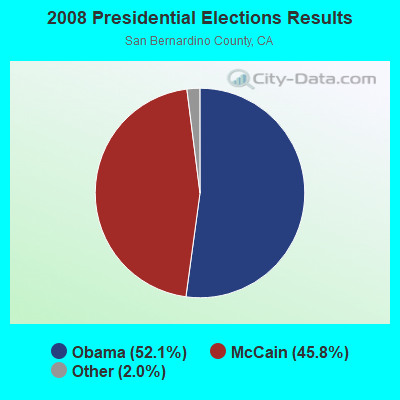
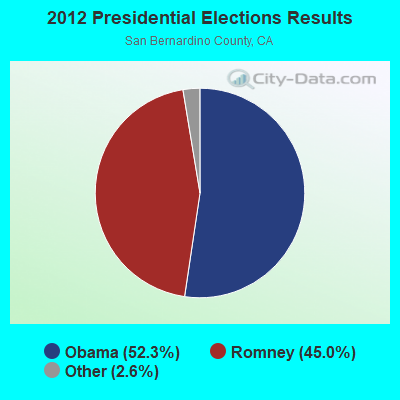
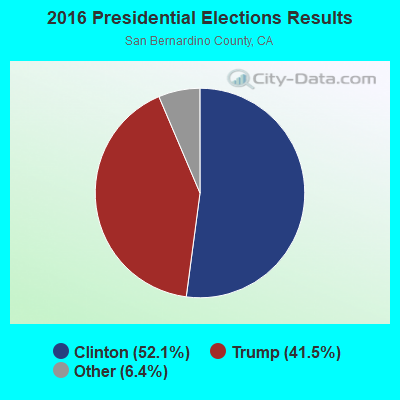
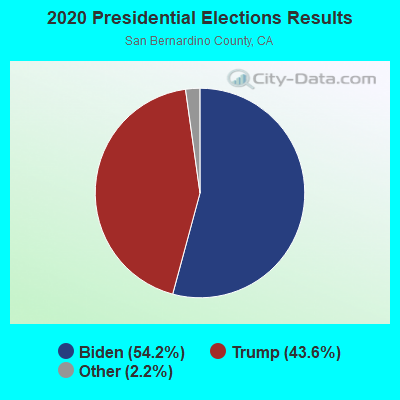
Graphs represent county-level data. Detailed 2008 Election Results
Neighborhoods in Rialto:
(Rialto, California Neighborhood Map)Religion statistics for Rialto, CA (based on San Bernardino County data)
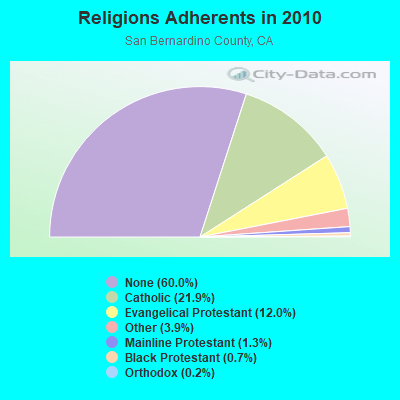
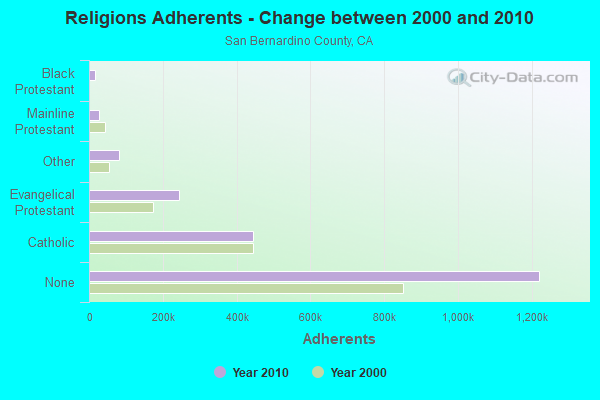
| Religion | Adherents | Congregations |
|---|---|---|
| Catholic | 445,334 | 55 |
| Evangelical Protestant | 243,524 | 832 |
| Other | 80,047 | 205 |
| Mainline Protestant | 26,062 | 135 |
| Black Protestant | 14,969 | 37 |
| Orthodox | 3,868 | 10 |
| None | 1,221,406 | - |
Food Environment Statistics:
| Here: | 1.50 / 10,000 pop. |
| California: | 2.14 / 10,000 pop. |
| This county: | 0.05 / 10,000 pop. |
| California: | 0.04 / 10,000 pop. |
| This county: | 0.57 / 10,000 pop. |
| California: | 0.62 / 10,000 pop. |
| San Bernardino County: | 1.60 / 10,000 pop. |
| California: | 1.49 / 10,000 pop. |
| San Bernardino County: | 4.69 / 10,000 pop. |
| California: | 7.42 / 10,000 pop. |
| This county: | 7.4% |
| State: | 7.3% |
| San Bernardino County: | 27.1% |
| California: | 21.3% |
| San Bernardino County: | 16.2% |
| California: | 17.9% |
Health and Nutrition:
| Rialto: | 46.4% |
| State: | 49.4% |
| Rialto: | 45.5% |
| California: | 48.0% |
| This city: | 28.9 |
| California: | 28.1 |
| Rialto: | 21.7% |
| California: | 20.2% |
| Here: | 11.1% |
| California: | 11.2% |
| Rialto: | 6.7 |
| State: | 6.8 |
| Here: | 32.5% |
| California: | 31.5% |
| Rialto: | 54.3% |
| California: | 56.4% |
| Rialto: | 82.0% |
| State: | 80.9% |
More about Health and Nutrition of Rialto, CA Residents
| Local government employment and payroll (March 2022) | |||||
| Function | Full-time employees | Monthly full-time payroll | Average yearly full-time wage | Part-time employees | Monthly part-time payroll |
|---|---|---|---|---|---|
| Police Protection - Officers | 112 | $1,320,830 | $141,518 | 0 | $0 |
| Firefighters | 60 | $922,206 | $184,441 | 0 | $0 |
| Streets and Highways | 32 | $282,189 | $105,821 | 3 | $9,238 |
| Police - Other | 31 | $238,246 | $92,224 | 14 | $17,302 |
| Other and Unallocable | 26 | $223,222 | $103,026 | 1 | $663 |
| Other Government Administration | 26 | $217,717 | $100,485 | 3 | $7,316 |
| Financial Administration | 25 | $206,287 | $99,018 | 6 | $19,929 |
| Fire - Other | 21 | $159,814 | $91,322 | 0 | $0 |
| Parks and Recreation | 11 | $83,051 | $90,601 | 70 | $89,625 |
| Health | 7 | $54,939 | $94,181 | 0 | $0 |
| Housing and Community Development (Local) | 2 | $16,954 | $101,724 | 3 | $3,669 |
| Solid Waste Management | 2 | $17,980 | $107,880 | 0 | $0 |
| Totals for Government | 355 | $3,743,435 | $126,539 | 100 | $147,743 |
Rialto government finances - Expenditure in 2017 (per resident):
- Current Operations - Police Protection: $31,957,000 ($308.63)
Central Staff Services: $24,895,000 ($240.43)
Local Fire Protection: $17,232,000 ($166.42)
Sewerage: $11,988,000 ($115.78)
Water Utilities: $10,250,000 ($98.99)
Parks and Recreation: $6,011,000 ($58.05)
Regular Highways: $5,612,000 ($54.20)
Health - Other: $3,808,000 ($36.78)
Financial Administration: $2,129,000 ($20.56)
Solid Waste Management: $691,000 ($6.67)
Protective Inspection and Regulation - Other: $427,000 ($4.12)
Housing and Community Development: $328,000 ($3.17)
Miscellaneous Commercial Activities - Other: $81,000 ($0.78)
Air Transportation: $11,000 ($0.11)
- General - Interest on Debt: $19,289,000 ($186.29)
- Intergovernmental to Local - Other - General - Other: $1,427,000 ($13.78)
Other - Health - Other: $292,000 ($2.82)
Other - Water Utilities: $292,000 ($2.82)
Other - Police Protection: $159,000 ($1.54)
- Other Capital Outlay - Sewerage: $63,000 ($0.61)
- Water Utilities - Interest on Debt: $2,285,000 ($22.07)
Rialto government finances - Revenue in 2017 (per resident):
- Charges - Sewerage: $25,955,000 ($250.66)
Other: $4,751,000 ($45.88)
Parks and Recreation: $895,000 ($8.64)
Regular Highways: $840,000 ($8.11)
Housing and Community Development: $298,000 ($2.88)
Miscellaneous Commercial Activities: $66,000 ($0.64)
Air Transportation: $33,000 ($0.32)
Solid Waste Management: $15,000 ($0.14)
- Federal Intergovernmental - Housing and Community Development: $1,225,000 ($11.83)
- Miscellaneous - Special Assessments: $47,779,000 ($461.43)
General Revenue - Other: $24,258,000 ($234.27)
Interest Earnings: $3,664,000 ($35.39)
Fines and Forfeits: $752,000 ($7.26)
Rents: $264,000 ($2.55)
Sale of Property: $146,000 ($1.41)
- Revenue - Water Utilities: $13,120,000 ($126.71)
- State Intergovernmental - Other: $10,622,000 ($102.58)
Highways: $1,901,000 ($18.36)
General Local Government Support: $60,000 ($0.58)
- Tax - Property: $32,666,000 ($315.48)
Public Utilities Sales: $16,081,000 ($155.30)
General Sales and Gross Receipts: $16,069,000 ($155.19)
Occupation and Business License - Other: $2,480,000 ($23.95)
Other License: $367,000 ($3.54)
Other Selective Sales: $333,000 ($3.22)
Documentary and Stock Transfer: $310,000 ($2.99)
Rialto government finances - Debt in 2017 (per resident):
- Long Term Debt - Beginning Outstanding - Unspecified Public Purpose: $316,593,000 ($3057.54)
Outstanding Unspecified Public Purpose: $310,255,000 ($2996.33)
Retired Unspecified Public Purpose: $6,338,000 ($61.21)
Beginning Outstanding - Public Debt for Private Purpose: $1,913,000 ($18.48)
Outstanding Nonguaranteed - Industrial Revenue: $1,848,000 ($17.85)
Retired Nonguaranteed - Public Debt for Private Purpose: $65,000 ($0.63)
Rialto government finances - Cash and Securities in 2017 (per resident):
- Bond Funds - Cash and Securities: $42,369,000 ($409.18)
- Other Funds - Cash and Securities: $223,258,000 ($2156.14)
- Sinking Funds - Cash and Securities: $20,047,000 ($193.61)
6.45% of this county's 2021 resident taxpayers lived in other counties in 2020 ($54,954 average adjusted gross income)
| Here: | 6.45% |
| California average: | 5.19% |
0.03% of residents moved from foreign countries ($259 average AGI)
San Bernardino County: 0.03% California average: 0.03%
Top counties from which taxpayers relocated into this county between 2020 and 2021:
| from Los Angeles County, CA | |
| from Riverside County, CA | |
| from Orange County, CA |
6.46% of this county's 2020 resident taxpayers moved to other counties in 2021 ($59,647 average adjusted gross income)
| Here: | 6.46% |
| California average: | 6.14% |
0.03% of residents moved to foreign countries ($253 average AGI)
San Bernardino County: 0.03% California average: 0.02%
Top counties to which taxpayers relocated from this county between 2020 and 2021:
| to Riverside County, CA | |
| to Los Angeles County, CA | |
| to Orange County, CA |
| Businesses in Rialto, CA | ||||
| Name | Count | Name | Count | |
|---|---|---|---|---|
| 7-Eleven | 4 | Jack In The Box | 4 | |
| 99 Cents Only Stores | 2 | KFC | 1 | |
| AutoZone | 2 | Kroger | 2 | |
| Baskin-Robbins | 1 | Little Caesars Pizza | 1 | |
| Burger King | 3 | McDonald's | 4 | |
| CVS | 1 | Nike | 1 | |
| Carl\s Jr. | 2 | Papa John's Pizza | 1 | |
| Church's Chicken | 1 | Payless | 1 | |
| Circle K | 2 | Pizza Hut | 2 | |
| Curves | 1 | Popeyes | 1 | |
| DHL | 1 | RadioShack | 1 | |
| Dairy Queen | 1 | Rite Aid | 2 | |
| Days Inn | 1 | Sprint Nextel | 1 | |
| Dennys | 1 | Starbucks | 2 | |
| Domino's Pizza | 1 | Subway | 5 | |
| El Pollo Loco | 2 | T-Mobile | 3 | |
| FedEx | 2 | Taco Bell | 1 | |
| GNC | 2 | U-Haul | 4 | |
| GameStop | 1 | UPS | 3 | |
| Goodwill | 1 | Verizon Wireless | 1 | |
| H&R Block | 4 | Walgreens | 4 | |
| Home Depot | 1 | Walmart | 1 | |
| HomeTown Buffet | 1 | Wendy's | 2 | |
Strongest AM radio stations in Rialto:
- KPLS (830 AM; 50 kW; ORANGE, CA; Owner: CRN LICENSES, LLC)
- KTDD (1350 AM; 5 kW; SAN BERNARDINO, CA)
- KRLH (590 AM; 2 kW; SAN BERNARDINO, CA; Owner: CARON BROADCASTING, INC.)
- KLAC (570 AM; 50 kW; LOS ANGELES, CA; Owner: AMFM RADIO LICENSES, L.L.C.)
- KKDD (1290 AM; 5 kW; SAN BERNARDINO, CA; Owner: AMFM RADIO LICENSES, L.L.C.)
- KFI (640 AM; 50 kW; LOS ANGELES, CA; Owner: CAPSTAR TX LIMITED PARTNERSHIP)
- KTNQ (1020 AM; 50 kW; LOS ANGELES, CA; Owner: KTNQ-AM LICENSE CORP.)
- KSPA (1510 AM; 10 kW; ONTARIO, CA; Owner: ONTARIO BROADCASTING, LLC)
- KDIS (1110 AM; 50 kW; PASADENA, CA; Owner: ABC,INC.)
- KXTA (1150 AM; 50 kW; LOS ANGELES, CA; Owner: CITICASTERS LICENSES, L.P.)
- KHPY (1670 AM; 10 kW; MORENO VALLEY, CA; Owner: DELBERT L. VAN VOORHIS)
- KEZY (1240 AM; 1 kW; SAN BERNARDINO, CA; Owner: HI-FAVOR BROADCASTING, LLC)
- KCAL (1410 AM; 5 kW; REDLANDS, CA; Owner: LAZER BROADCASTING CORPORATION)
Strongest FM radio stations in Rialto:
- K295AI (106.9 FM; MUSCOY, CA; Owner: ASSOCIATION FOR COMMUNITY EDUCATION, INC.)
- KUOR-FM (89.1 FM; REDLANDS, CA; Owner: UNIVERSITY OF REDLANDS)
- KOLA (99.9 FM; SAN BERNARDINO, CA; Owner: INLAND EMPIRE BROADCASTING CORP.)
- KUCR (88.3 FM; RIVERSIDE, CA; Owner: THE REGENTS OF THE UNIV. OF CA)
- KVCR (91.9 FM; SAN BERNARDINO, CA; Owner: SAN BERNARDINO COMMUNITY COLLEGE DISTRICT)
- KCXX (103.9 FM; LAKE ARROWHEAD, CA; Owner: ALL-PRO BROADCASTING, INC.)
- KLRD (90.1 FM; YUCAIPA, CA; Owner: EDUCATIONAL MEDIA FOUNDATION)
- KGGI (99.1 FM; RIVERSIDE, CA; Owner: AMFM RADIO LICENSES, L.L.C.)
- KLYY (97.5 FM; RIVERSIDE, CA; Owner: ENTRAVISION HOLDINGS, LLC)
- K201CD (88.1 FM; VICTORVILLE, CA; Owner: SAN BERNARDINO COMMNTY COLLEGE DIST.)
- K264AF (100.7 FM; GUASTI, CA; Owner: EDUCATIONAL MEDIA FOUNDATION)
- KFRG (95.1 FM; SAN BERNARDINO, CA; Owner: INFINITY RADIO OPERATIONS INC.)
- KCBS-FM (93.1 FM; LOS ANGELES, CA; Owner: INFINITY BROADCASTING OPERATIONS, INC.)
- K201AR (88.1 FM; BANNING, CA; Owner: KSGN, INC.)
- K232CX (94.3 FM; DESERT HOT SPRINGS, CA; Owner: MCC RADIO, LLC)
- KCAL-FM (96.7 FM; REDLANDS, CA; Owner: SBR BROADCASTING CORPORATION)
- KSCA (101.9 FM; GLENDALE, CA; Owner: HBC LICENSE CORPORATION)
- KLOS (95.5 FM; LOS ANGELES, CA; Owner: KLOS-FM RADIO, INC.)
- K212FA (90.3 FM; TEMPLE CITY, CA; Owner: EDUCATIONAL MEDIA FOUNDATION)
- KOST (103.5 FM; LOS ANGELES, CA; Owner: CAPSTAR TX LIMITED PARTNERSHIP)
TV broadcast stations around Rialto:
- KHIZ (Channel 64; BARSTOW, CA; Owner: SUNBELT TELEVISION, INC.)
- KTRO-LP (Channel 50; LANCASTER, CA; Owner: ROBERT D. ADELMAN)
- KVCR-TV (Channel 24; SAN BERNARDINO, CA; Owner: SAN BERNARDINO COMMUNITY COLLEGE DISTRICT)
- KCBS-TV (Channel 2; LOS ANGELES, CA; Owner: CBS BROADCASTING INC.)
- KSGA-LP (Channel 59; SANTA BARBARA, CA; Owner: KJLA, LLC)
- KRCA (Channel 62; RIVERSIDE, CA; Owner: KRCA LICENSE CORP.)
- KBLM-LP (Channel 25; RIVERSIDE/PERRIS, CA; Owner: LOUIS MARTINEZ FAMILY GROUP, LLC)
- National Bridge Inventory (NBI) Statistics
- 34Number of bridges
- 784ft / 239mTotal length
- 1,997,232Total average daily traffic
- 110,805Total average daily truck traffic
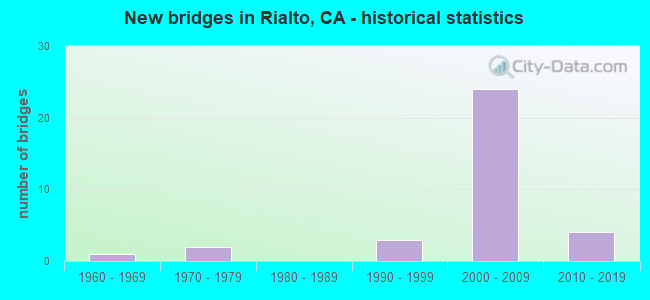
- New bridges - historical statistics
- 11960-1969
- 21970-1979
- 31990-1999
- 242000-2009
- 42010-2019
FCC Registered Broadcast Land Mobile Towers: 47 (See the full list of FCC Registered Broadcast Land Mobile Towers in Rialto, CA)
FCC Registered Microwave Towers: 35 (See the full list of FCC Registered Microwave Towers in this town)
FCC Registered Maritime Coast & Aviation Ground Towers: 2 (See the full list of FCC Registered Maritime Coast & Aviation Ground Towers)
FCC Registered Amateur Radio Licenses: 311 (See the full list of FCC Registered Amateur Radio Licenses in Rialto)
FAA Registered Aircraft Manufacturers and Dealers: 1 (See the full list of FAA Registered Manufacturers and Dealers in Rialto)
FAA Registered Aircraft: 14 (See the full list of FAA Registered Aircraft)
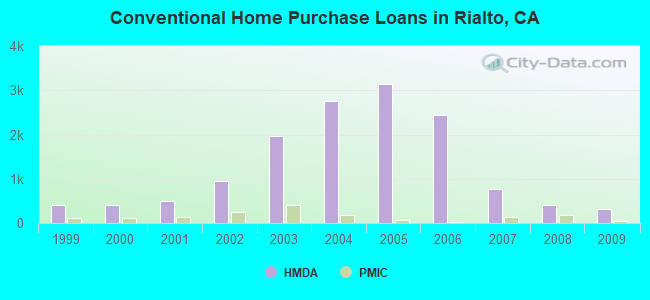
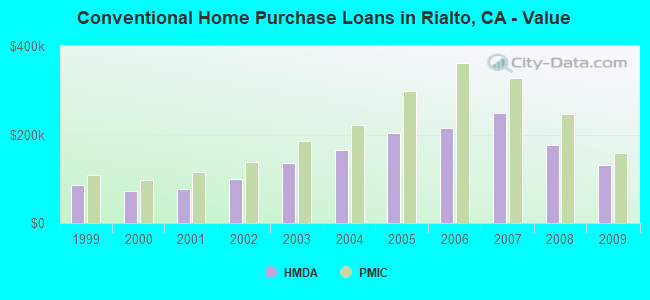
| Home Mortgage Disclosure Act Aggregated Statistics For Year 2009 (Based on 4 full and 9 partial tracts) | ||||||||||||
| A) FHA, FSA/RHS & VA Home Purchase Loans | B) Conventional Home Purchase Loans | C) Refinancings | D) Home Improvement Loans | F) Non-occupant Loans on < 5 Family Dwellings (A B C & D) | G) Loans On Manufactured Home Dwelling (A B C & D) | |||||||
|---|---|---|---|---|---|---|---|---|---|---|---|---|
| Number | Average Value | Number | Average Value | Number | Average Value | Number | Average Value | Number | Average Value | Number | Average Value | |
| LOANS ORIGINATED | 866 | $166,200 | 312 | $131,425 | 423 | $168,986 | 21 | $59,837 | 155 | $113,769 | 3 | $25,750 |
| APPLICATIONS APPROVED, NOT ACCEPTED | 99 | $164,533 | 68 | $140,705 | 92 | $178,185 | 5 | $75,472 | 28 | $118,638 | 2 | $30,630 |
| APPLICATIONS DENIED | 194 | $167,196 | 108 | $128,573 | 396 | $192,960 | 49 | $65,180 | 66 | $135,277 | 8 | $77,549 |
| APPLICATIONS WITHDRAWN | 171 | $164,572 | 74 | $126,034 | 155 | $180,823 | 17 | $55,805 | 42 | $122,225 | 0 | $0 |
| FILES CLOSED FOR INCOMPLETENESS | 42 | $172,154 | 14 | $142,633 | 58 | $170,719 | 2 | $20,060 | 9 | $106,509 | 0 | $0 |
Detailed mortgage data for all 13 tracts in Rialto, CA
| Private Mortgage Insurance Companies Aggregated Statistics For Year 2009 (Based on 4 full and 9 partial tracts) | ||||||
| A) Conventional Home Purchase Loans | B) Refinancings | C) Non-occupant Loans on < 5 Family Dwellings (A & B) | ||||
|---|---|---|---|---|---|---|
| Number | Average Value | Number | Average Value | Number | Average Value | |
| LOANS ORIGINATED | 53 | $158,466 | 3 | $155,900 | 1 | $152,850 |
| APPLICATIONS APPROVED, NOT ACCEPTED | 36 | $200,029 | 5 | $400,588 | 0 | $0 |
| APPLICATIONS DENIED | 10 | $146,553 | 3 | $185,127 | 0 | $0 |
| APPLICATIONS WITHDRAWN | 2 | $199,765 | 0 | $0 | 0 | $0 |
| FILES CLOSED FOR INCOMPLETENESS | 8 | $251,914 | 3 | $267,557 | 1 | $87,130 |
2005 - 2018 National Fire Incident Reporting System (NFIRS) incidents
- Fire incident types reported to NFIRS in Rialto, CA
- 23637.4%Outside Fires
- 22435.5%Structure Fires
- 14923.6%Mobile Property/Vehicle Fires
- 223.5%Other
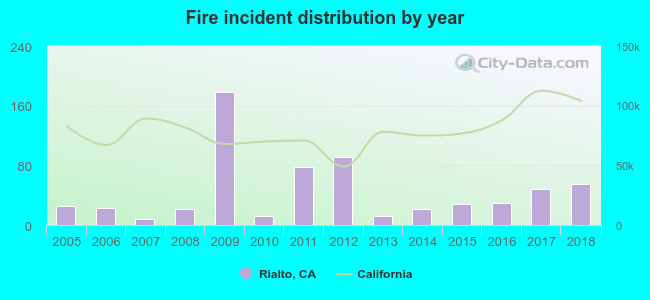 Based on the data from the years 2005 - 2018 the average number of fires per year is 45. The highest number of reported fire incidents - 178 took place in 2009, and the least - 8 in 2007. The data has an increasing trend.
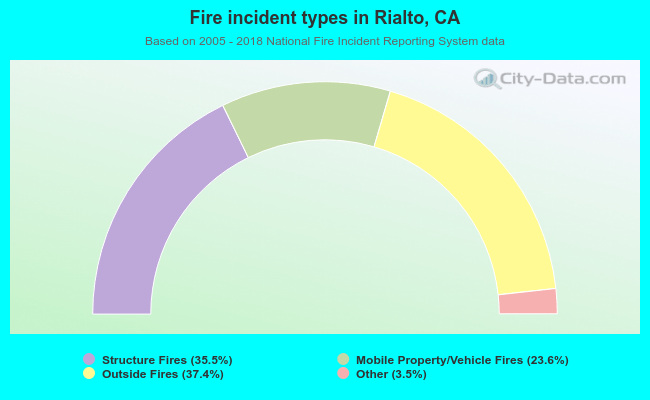 When looking into fire subcategories, the most incidents belonged to: Outside Fires (37.4%), and Structure Fires (35.5%).
| Most common first names in Rialto, CA among deceased individuals | ||
| Name | Count | Lived (average) |
|---|---|---|
| John | 250 | 73.0 years |
| Mary | 229 | 78.4 years |
| William | 204 | 72.0 years |
| Robert | 194 | 67.1 years |
| James | 171 | 69.5 years |
| Charles | 130 | 71.0 years |
| George | 126 | 74.5 years |
| Richard | 106 | 65.6 years |
| Dorothy | 103 | 74.7 years |
| Frank | 102 | 74.9 years |
| Most common last names in Rialto, CA among deceased individuals | ||
| Last name | Count | Lived (average) |
|---|---|---|
| Smith | 119 | 73.2 years |
| Johnson | 95 | 71.5 years |
| Williams | 86 | 74.3 years |
| Jones | 73 | 71.4 years |
| Brown | 69 | 74.9 years |
| Davis | 54 | 68.2 years |
| Anderson | 47 | 76.8 years |
| Allen | 45 | 74.8 years |
| Miller | 44 | 71.8 years |
| Martin | 42 | 72.3 years |
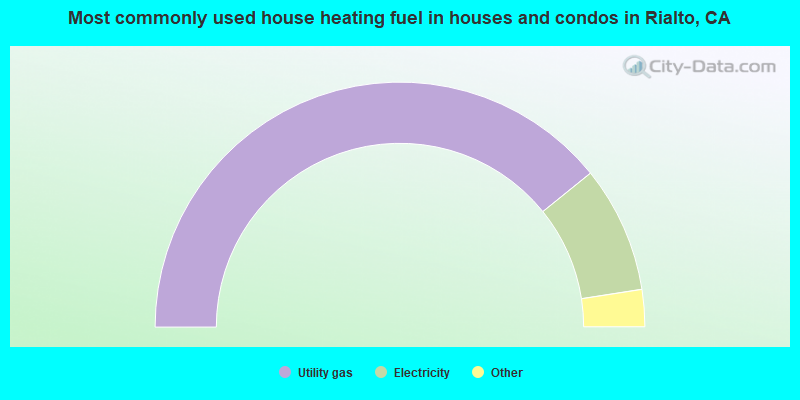
- 78.4%Utility gas
- 16.7%Electricity
- 1.9%No fuel used
- 1.6%Bottled, tank, or LP gas
- 1.0%Solar energy
- 0.5%Wood
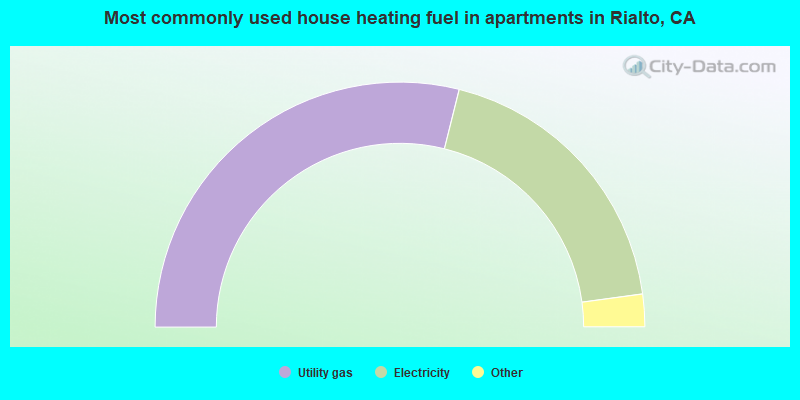
- 57.8%Utility gas
- 37.9%Electricity
- 2.6%No fuel used
- 1.5%Bottled, tank, or LP gas
- 0.2%Solar energy
Rialto compared to California state average:
- Unemployed percentage below state average.
- Black race population percentage above state average.
- Hispanic race population percentage above state average.
- Percentage of population with a bachelor's degree or higher below state average.
Rialto, CA compared to other similar cities:
Rialto on our top lists:
- #2 on the list of "Top 101 cities with the highest percentage of family households, population 100,000+"
- #10 on the list of "Top 101 cities with largest percentage of females in occupations: office and administrative support occupations (population 50,000+)"
- #10 on the list of "Top 101 cities with largest percentage of males in industries: transportation and warehousing (population 50,000+)"
- #14 on the list of "Top 101 cities with largest percentage of males in occupations: material moving occupations (population 50,000+)"
- #19 on the list of "Top 101 cities with largest percentage of females in occupations: personal care and service occupations (population 50,000+)"
- #20 on the list of "Top 101 cities with largest percentage of males in occupations: office and administrative support occupations (population 50,000+)"
- #22 on the list of "Top 101 cities with largest percentage of females in occupations: material moving occupations (population 50,000+)"
- #22 on the list of "Top 101 cities with largest percentage of females in occupations: transportation occupations (population 50,000+)"
- #23 on the list of "Top 101 cities with largest percentage of males in industries: wholesale trade (population 50,000+)"
- #25 on the list of "Top 101 cities with the largest city-data.com crime index per police officer (population 50,000+)"
- #29 on the list of "Top 101 cities with largest percentage of females in industries: retail trade (population 50,000+)"
- #32 on the list of "Top 101 cities with the lowest number of police officers per 1000 residents (population 50,000+)"
- #35 on the list of "Top 100 least-educated cities (pop. 50,000+)"
- #37 on the list of "Top 101 cities with the highest number of auto thefts per 100,000 residents, excludes tourist destinations and others with a lot of outsiders visiting based on city industries data (population 50,000+)"
- #41 on the list of "Top 101 cities with largest percentage of males in industries: administrative and support and waste management services (population 50,000+)"
- #53 on the list of "Top 101 cities with the least people having Master's or Doctorate degrees (population 50,000+)"
- #59 on the list of "Top 101 cities with the smallest percentage of high school students in private schools (3,000+ students)"
- #60 on the list of "Top 101 cities with largest percentage of females in industries: transportation and warehousing (population 50,000+)"
- #63 on the list of "Top 101 cities with the smallest percentage of elementary and middle school students in private schools (5,000+ students)"
- #67 on the list of "Top 100 cities with youngest residents (pop. 50,000+)"
- #5 on the list of "Top 101 counties with the highest Nitrogen Dioxide air pollution readings in 2012 (ppm)"
- #5 on the list of "Top 101 counties with the highest ground withdrawal of fresh water for public supply"
- #10 on the list of "Top 101 counties with the most Evangelical Protestant congregations"
- #14 on the list of "Top 101 counties with the highest total withdrawal of fresh water for public supply"
- #15 on the list of "Top 101 counties with the most Evangelical Protestant adherents (pop. 50,000+)"

|
|
Total of 39 patent applications in 2008-2024.