Fontana, California Submit your own pictures of this city and show them to the world
OSM Map
General Map
Google Map
MSN Map
OSM Map
General Map
Google Map
MSN Map
OSM Map
General Map
Google Map
MSN Map
OSM Map
General Map
Google Map
MSN Map
Please wait while loading the map...
Population in 2022: 212,475 (100% urban, 0% rural). Population change since 2000: +64.8%Males: 110,158 Females: 102,317
March 2022 cost of living index in Fontana: 82.7 (low, U.S. average is 100) Percentage of residents living in poverty in 2022: 8.5%for White Non-Hispanic residents , 21.4% for Black residents , 7.5% for Hispanic or Latino residents , 26.9% for American Indian residents , 10.0% for Native Hawaiian and other Pacific Islander residents , 6.1% for other race residents , 6.4% for two or more races residents )
Profiles of local businesses
Business Search - 14 Million verified businesses
Data:
Median household income ($)
Median household income (% change since 2000)
Household income diversity
Ratio of average income to average house value (%)
Ratio of average income to average rent
Median household income ($) - White
Median household income ($) - Black or African American
Median household income ($) - Asian
Median household income ($) - Hispanic or Latino
Median household income ($) - American Indian and Alaska Native
Median household income ($) - Multirace
Median household income ($) - Other Race
Median household income for houses/condos with a mortgage ($)
Median household income for apartments without a mortgage ($)
Races - White alone (%)
Races - White alone (% change since 2000)
Races - Black alone (%)
Races - Black alone (% change since 2000)
Races - American Indian alone (%)
Races - American Indian alone (% change since 2000)
Races - Asian alone (%)
Races - Asian alone (% change since 2000)
Races - Hispanic (%)
Races - Hispanic (% change since 2000)
Races - Native Hawaiian and Other Pacific Islander alone (%)
Races - Native Hawaiian and Other Pacific Islander alone (% change since 2000)
Races - Two or more races (%)
Races - Two or more races (% change since 2000)
Races - Other race alone (%)
Races - Other race alone (% change since 2000)
Racial diversity
Unemployment (%)
Unemployment (% change since 2000)
Unemployment (%) - White
Unemployment (%) - Black or African American
Unemployment (%) - Asian
Unemployment (%) - Hispanic or Latino
Unemployment (%) - American Indian and Alaska Native
Unemployment (%) - Multirace
Unemployment (%) - Other Race
Population density (people per square mile)
Population - Males (%)
Population - Females (%)
Population - Males (%) - White
Population - Males (%) - Black or African American
Population - Males (%) - Asian
Population - Males (%) - Hispanic or Latino
Population - Males (%) - American Indian and Alaska Native
Population - Males (%) - Multirace
Population - Males (%) - Other Race
Population - Females (%) - White
Population - Females (%) - Black or African American
Population - Females (%) - Asian
Population - Females (%) - Hispanic or Latino
Population - Females (%) - American Indian and Alaska Native
Population - Females (%) - Multirace
Population - Females (%) - Other Race
Coronavirus confirmed cases (Apr 27, 2024)
Deaths caused by coronavirus (Apr 27, 2024)
Coronavirus confirmed cases (per 100k population) (Apr 27, 2024)
Deaths caused by coronavirus (per 100k population) (Apr 27, 2024)
Daily increase in number of cases (Apr 27, 2024)
Weekly increase in number of cases (Apr 27, 2024)
Cases doubled (in days) (Apr 27, 2024)
Hospitalized patients (Apr 18, 2022)
Negative test results (Apr 18, 2022)
Total test results (Apr 18, 2022)
COVID Vaccine doses distributed (per 100k population) (Sep 19, 2023)
COVID Vaccine doses administered (per 100k population) (Sep 19, 2023)
COVID Vaccine doses distributed (Sep 19, 2023)
COVID Vaccine doses administered (Sep 19, 2023)
Likely homosexual households (%)
Likely homosexual households (% change since 2000)
Likely homosexual households - Lesbian couples (%)
Likely homosexual households - Lesbian couples (% change since 2000)
Likely homosexual households - Gay men (%)
Likely homosexual households - Gay men (% change since 2000)
Cost of living index
Median gross rent ($)
Median contract rent ($)
Median monthly housing costs ($)
Median house or condo value ($)
Median house or condo value ($ change since 2000)
Mean house or condo value by units in structure - 1, detached ($)
Mean house or condo value by units in structure - 1, attached ($)
Mean house or condo value by units in structure - 2 ($)
Mean house or condo value by units in structure by units in structure - 3 or 4 ($)
Mean house or condo value by units in structure - 5 or more ($)
Mean house or condo value by units in structure - Boat, RV, van, etc. ($)
Mean house or condo value by units in structure - Mobile home ($)
Median house or condo value ($) - White
Median house or condo value ($) - Black or African American
Median house or condo value ($) - Asian
Median house or condo value ($) - Hispanic or Latino
Median house or condo value ($) - American Indian and Alaska Native
Median house or condo value ($) - Multirace
Median house or condo value ($) - Other Race
Median resident age
Resident age diversity
Median resident age - Males
Median resident age - Females
Median resident age - White
Median resident age - Black or African American
Median resident age - Asian
Median resident age - Hispanic or Latino
Median resident age - American Indian and Alaska Native
Median resident age - Multirace
Median resident age - Other Race
Median resident age - Males - White
Median resident age - Males - Black or African American
Median resident age - Males - Asian
Median resident age - Males - Hispanic or Latino
Median resident age - Males - American Indian and Alaska Native
Median resident age - Males - Multirace
Median resident age - Males - Other Race
Median resident age - Females - White
Median resident age - Females - Black or African American
Median resident age - Females - Asian
Median resident age - Females - Hispanic or Latino
Median resident age - Females - American Indian and Alaska Native
Median resident age - Females - Multirace
Median resident age - Females - Other Race
Commute - mean travel time to work (minutes)
Travel time to work - Less than 5 minutes (%)
Travel time to work - Less than 5 minutes (% change since 2000)
Travel time to work - 5 to 9 minutes (%)
Travel time to work - 5 to 9 minutes (% change since 2000)
Travel time to work - 10 to 19 minutes (%)
Travel time to work - 10 to 19 minutes (% change since 2000)
Travel time to work - 20 to 29 minutes (%)
Travel time to work - 20 to 29 minutes (% change since 2000)
Travel time to work - 30 to 39 minutes (%)
Travel time to work - 30 to 39 minutes (% change since 2000)
Travel time to work - 40 to 59 minutes (%)
Travel time to work - 40 to 59 minutes (% change since 2000)
Travel time to work - 60 to 89 minutes (%)
Travel time to work - 60 to 89 minutes (% change since 2000)
Travel time to work - 90 or more minutes (%)
Travel time to work - 90 or more minutes (% change since 2000)
Marital status - Never married (%)
Marital status - Now married (%)
Marital status - Separated (%)
Marital status - Widowed (%)
Marital status - Divorced (%)
Median family income ($)
Median family income (% change since 2000)
Median non-family income ($)
Median non-family income (% change since 2000)
Median per capita income ($)
Median per capita income (% change since 2000)
Median family income ($) - White
Median family income ($) - Black or African American
Median family income ($) - Asian
Median family income ($) - Hispanic or Latino
Median family income ($) - American Indian and Alaska Native
Median family income ($) - Multirace
Median family income ($) - Other Race
Median year house/condo built
Median year apartment built
Year house built - Built 2005 or later (%)
Year house built - Built 2000 to 2004 (%)
Year house built - Built 1990 to 1999 (%)
Year house built - Built 1980 to 1989 (%)
Year house built - Built 1970 to 1979 (%)
Year house built - Built 1960 to 1969 (%)
Year house built - Built 1950 to 1959 (%)
Year house built - Built 1940 to 1949 (%)
Year house built - Built 1939 or earlier (%)
Average household size
Household density (households per square mile)
Average household size - White
Average household size - Black or African American
Average household size - Asian
Average household size - Hispanic or Latino
Average household size - American Indian and Alaska Native
Average household size - Multirace
Average household size - Other Race
Occupied housing units (%)
Vacant housing units (%)
Owner occupied housing units (%)
Renter occupied housing units (%)
Vacancy status - For rent (%)
Vacancy status - For sale only (%)
Vacancy status - Rented or sold, not occupied (%)
Vacancy status - For seasonal, recreational, or occasional use (%)
Vacancy status - For migrant workers (%)
Vacancy status - Other vacant (%)
Residents with income below the poverty level (%)
Residents with income below 50% of the poverty level (%)
Children below poverty level (%)
Poor families by family type - Married-couple family (%)
Poor families by family type - Male, no wife present (%)
Poor families by family type - Female, no husband present (%)
Poverty status for native-born residents (%)
Poverty status for foreign-born residents (%)
Poverty among high school graduates not in families (%)
Poverty among people who did not graduate high school not in families (%)
Residents with income below the poverty level (%) - White
Residents with income below the poverty level (%) - Black or African American
Residents with income below the poverty level (%) - Asian
Residents with income below the poverty level (%) - Hispanic or Latino
Residents with income below the poverty level (%) - American Indian and Alaska Native
Residents with income below the poverty level (%) - Multirace
Residents with income below the poverty level (%) - Other Race
Air pollution - Air Quality Index (AQI)
Air pollution - CO
Air pollution - NO2
Air pollution - SO2
Air pollution - Ozone
Air pollution - PM10
Air pollution - PM25
Air pollution - Pb
Crime - Murders per 100,000 population
Crime - Rapes per 100,000 population
Crime - Robberies per 100,000 population
Crime - Assaults per 100,000 population
Crime - Burglaries per 100,000 population
Crime - Thefts per 100,000 population
Crime - Auto thefts per 100,000 population
Crime - Arson per 100,000 population
Crime - City-data.com crime index
Crime - Violent crime index
Crime - Property crime index
Crime - Murders per 100,000 population (5 year average)
Crime - Rapes per 100,000 population (5 year average)
Crime - Robberies per 100,000 population (5 year average)
Crime - Assaults per 100,000 population (5 year average)
Crime - Burglaries per 100,000 population (5 year average)
Crime - Thefts per 100,000 population (5 year average)
Crime - Auto thefts per 100,000 population (5 year average)
Crime - Arson per 100,000 population (5 year average)
Crime - City-data.com crime index (5 year average)
Crime - Violent crime index (5 year average)
Crime - Property crime index (5 year average)
1996 Presidential Elections Results (%) - Democratic Party (Clinton)
1996 Presidential Elections Results (%) - Republican Party (Dole)
1996 Presidential Elections Results (%) - Other
2000 Presidential Elections Results (%) - Democratic Party (Gore)
2000 Presidential Elections Results (%) - Republican Party (Bush)
2000 Presidential Elections Results (%) - Other
2004 Presidential Elections Results (%) - Democratic Party (Kerry)
2004 Presidential Elections Results (%) - Republican Party (Bush)
2004 Presidential Elections Results (%) - Other
2008 Presidential Elections Results (%) - Democratic Party (Obama)
2008 Presidential Elections Results (%) - Republican Party (McCain)
2008 Presidential Elections Results (%) - Other
2012 Presidential Elections Results (%) - Democratic Party (Obama)
2012 Presidential Elections Results (%) - Republican Party (Romney)
2012 Presidential Elections Results (%) - Other
2016 Presidential Elections Results (%) - Democratic Party (Clinton)
2016 Presidential Elections Results (%) - Republican Party (Trump)
2016 Presidential Elections Results (%) - Other
2020 Presidential Elections Results (%) - Democratic Party (Biden)
2020 Presidential Elections Results (%) - Republican Party (Trump)
2020 Presidential Elections Results (%) - Other
Ancestries Reported - Arab (%)
Ancestries Reported - Czech (%)
Ancestries Reported - Danish (%)
Ancestries Reported - Dutch (%)
Ancestries Reported - English (%)
Ancestries Reported - French (%)
Ancestries Reported - French Canadian (%)
Ancestries Reported - German (%)
Ancestries Reported - Greek (%)
Ancestries Reported - Hungarian (%)
Ancestries Reported - Irish (%)
Ancestries Reported - Italian (%)
Ancestries Reported - Lithuanian (%)
Ancestries Reported - Norwegian (%)
Ancestries Reported - Polish (%)
Ancestries Reported - Portuguese (%)
Ancestries Reported - Russian (%)
Ancestries Reported - Scotch-Irish (%)
Ancestries Reported - Scottish (%)
Ancestries Reported - Slovak (%)
Ancestries Reported - Subsaharan African (%)
Ancestries Reported - Swedish (%)
Ancestries Reported - Swiss (%)
Ancestries Reported - Ukrainian (%)
Ancestries Reported - United States (%)
Ancestries Reported - Welsh (%)
Ancestries Reported - West Indian (%)
Ancestries Reported - Other (%)
Educational Attainment - No schooling completed (%)
Educational Attainment - Less than high school (%)
Educational Attainment - High school or equivalent (%)
Educational Attainment - Less than 1 year of college (%)
Educational Attainment - 1 or more years of college (%)
Educational Attainment - Associate degree (%)
Educational Attainment - Bachelor's degree (%)
Educational Attainment - Master's degree (%)
Educational Attainment - Professional school degree (%)
Educational Attainment - Doctorate degree (%)
School Enrollment - Nursery, preschool (%)
School Enrollment - Kindergarten (%)
School Enrollment - Grade 1 to 4 (%)
School Enrollment - Grade 5 to 8 (%)
School Enrollment - Grade 9 to 12 (%)
School Enrollment - College undergrad (%)
School Enrollment - Graduate or professional (%)
School Enrollment - Not enrolled in school (%)
School enrollment - Public schools (%)
School enrollment - Private schools (%)
School enrollment - Not enrolled (%)
Median number of rooms in houses and condos
Median number of rooms in apartments
Housing units lacking complete plumbing facilities (%)
Housing units lacking complete kitchen facilities (%)
Density of houses
Urban houses (%)
Rural houses (%)
Households with people 60 years and over (%)
Households with people 65 years and over (%)
Households with people 75 years and over (%)
Households with one or more nonrelatives (%)
Households with no nonrelatives (%)
Population in households (%)
Family households (%)
Nonfamily households (%)
Population in families (%)
Family households with own children (%)
Median number of bedrooms in owner occupied houses
Mean number of bedrooms in owner occupied houses
Median number of bedrooms in renter occupied houses
Mean number of bedrooms in renter occupied houses
Median number of vehichles in owner occupied houses
Mean number of vehichles in owner occupied houses
Median number of vehichles in renter occupied houses
Mean number of vehichles in renter occupied houses
Mortgage status - with mortgage (%)
Mortgage status - with second mortgage (%)
Mortgage status - with home equity loan (%)
Mortgage status - with both second mortgage and home equity loan (%)
Mortgage status - without a mortgage (%)
Average family size
Average family size - White
Average family size - Black or African American
Average family size - Asian
Average family size - Hispanic or Latino
Average family size - American Indian and Alaska Native
Average family size - Multirace
Average family size - Other Race
Geographical mobility - Same house 1 year ago (%)
Geographical mobility - Moved within same county (%)
Geographical mobility - Moved from different county within same state (%)
Geographical mobility - Moved from different state (%)
Geographical mobility - Moved from abroad (%)
Place of birth - Born in state of residence (%)
Place of birth - Born in other state (%)
Place of birth - Native, outside of US (%)
Place of birth - Foreign born (%)
Housing units in structures - 1, detached (%)
Housing units in structures - 1, attached (%)
Housing units in structures - 2 (%)
Housing units in structures - 3 or 4 (%)
Housing units in structures - 5 to 9 (%)
Housing units in structures - 10 to 19 (%)
Housing units in structures - 20 to 49 (%)
Housing units in structures - 50 or more (%)
Housing units in structures - Mobile home (%)
Housing units in structures - Boat, RV, van, etc. (%)
House/condo owner moved in on average (years ago)
Renter moved in on average (years ago)
Year householder moved into unit - Moved in 1999 to March 2000 (%)
Year householder moved into unit - Moved in 1995 to 1998 (%)
Year householder moved into unit - Moved in 1990 to 1994 (%)
Year householder moved into unit - Moved in 1980 to 1989 (%)
Year householder moved into unit - Moved in 1970 to 1979 (%)
Year householder moved into unit - Moved in 1969 or earlier (%)
Means of transportation to work - Drove car alone (%)
Means of transportation to work - Carpooled (%)
Means of transportation to work - Public transportation (%)
Means of transportation to work - Bus or trolley bus (%)
Means of transportation to work - Streetcar or trolley car (%)
Means of transportation to work - Subway or elevated (%)
Means of transportation to work - Railroad (%)
Means of transportation to work - Ferryboat (%)
Means of transportation to work - Taxicab (%)
Means of transportation to work - Motorcycle (%)
Means of transportation to work - Bicycle (%)
Means of transportation to work - Walked (%)
Means of transportation to work - Other means (%)
Working at home (%)
Industry diversity
Most Common Industries - Agriculture, forestry, fishing and hunting, and mining (%)
Most Common Industries - Agriculture, forestry, fishing and hunting (%)
Most Common Industries - Mining, quarrying, and oil and gas extraction (%)
Most Common Industries - Construction (%)
Most Common Industries - Manufacturing (%)
Most Common Industries - Wholesale trade (%)
Most Common Industries - Retail trade (%)
Most Common Industries - Transportation and warehousing, and utilities (%)
Most Common Industries - Transportation and warehousing (%)
Most Common Industries - Utilities (%)
Most Common Industries - Information (%)
Most Common Industries - Finance and insurance, and real estate and rental and leasing (%)
Most Common Industries - Finance and insurance (%)
Most Common Industries - Real estate and rental and leasing (%)
Most Common Industries - Professional, scientific, and management, and administrative and waste management services (%)
Most Common Industries - Professional, scientific, and technical services (%)
Most Common Industries - Management of companies and enterprises (%)
Most Common Industries - Administrative and support and waste management services (%)
Most Common Industries - Educational services, and health care and social assistance (%)
Most Common Industries - Educational services (%)
Most Common Industries - Health care and social assistance (%)
Most Common Industries - Arts, entertainment, and recreation, and accommodation and food services (%)
Most Common Industries - Arts, entertainment, and recreation (%)
Most Common Industries - Accommodation and food services (%)
Most Common Industries - Other services, except public administration (%)
Most Common Industries - Public administration (%)
Occupation diversity
Most Common Occupations - Management, business, science, and arts occupations (%)
Most Common Occupations - Management, business, and financial occupations (%)
Most Common Occupations - Management occupations (%)
Most Common Occupations - Business and financial operations occupations (%)
Most Common Occupations - Computer, engineering, and science occupations (%)
Most Common Occupations - Computer and mathematical occupations (%)
Most Common Occupations - Architecture and engineering occupations (%)
Most Common Occupations - Life, physical, and social science occupations (%)
Most Common Occupations - Education, legal, community service, arts, and media occupations (%)
Most Common Occupations - Community and social service occupations (%)
Most Common Occupations - Legal occupations (%)
Most Common Occupations - Education, training, and library occupations (%)
Most Common Occupations - Arts, design, entertainment, sports, and media occupations (%)
Most Common Occupations - Healthcare practitioners and technical occupations (%)
Most Common Occupations - Health diagnosing and treating practitioners and other technical occupations (%)
Most Common Occupations - Health technologists and technicians (%)
Most Common Occupations - Service occupations (%)
Most Common Occupations - Healthcare support occupations (%)
Most Common Occupations - Protective service occupations (%)
Most Common Occupations - Fire fighting and prevention, and other protective service workers including supervisors (%)
Most Common Occupations - Law enforcement workers including supervisors (%)
Most Common Occupations - Food preparation and serving related occupations (%)
Most Common Occupations - Building and grounds cleaning and maintenance occupations (%)
Most Common Occupations - Personal care and service occupations (%)
Most Common Occupations - Sales and office occupations (%)
Most Common Occupations - Sales and related occupations (%)
Most Common Occupations - Office and administrative support occupations (%)
Most Common Occupations - Natural resources, construction, and maintenance occupations (%)
Most Common Occupations - Farming, fishing, and forestry occupations (%)
Most Common Occupations - Construction and extraction occupations (%)
Most Common Occupations - Installation, maintenance, and repair occupations (%)
Most Common Occupations - Production, transportation, and material moving occupations (%)
Most Common Occupations - Production occupations (%)
Most Common Occupations - Transportation occupations (%)
Most Common Occupations - Material moving occupations (%)
People in Group quarters - Institutionalized population (%)
People in Group quarters - Correctional institutions (%)
People in Group quarters - Federal prisons and detention centers (%)
People in Group quarters - Halfway houses (%)
People in Group quarters - Local jails and other confinement facilities (including police lockups) (%)
People in Group quarters - Military disciplinary barracks (%)
People in Group quarters - State prisons (%)
People in Group quarters - Other types of correctional institutions (%)
People in Group quarters - Nursing homes (%)
People in Group quarters - Hospitals/wards, hospices, and schools for the handicapped (%)
People in Group quarters - Hospitals/wards and hospices for chronically ill (%)
People in Group quarters - Hospices or homes for chronically ill (%)
People in Group quarters - Military hospitals or wards for chronically ill (%)
People in Group quarters - Other hospitals or wards for chronically ill (%)
People in Group quarters - Hospitals or wards for drug/alcohol abuse (%)
People in Group quarters - Mental (Psychiatric) hospitals or wards (%)
People in Group quarters - Schools, hospitals, or wards for the mentally retarded (%)
People in Group quarters - Schools, hospitals, or wards for the physically handicapped (%)
People in Group quarters - Institutions for the deaf (%)
People in Group quarters - Institutions for the blind (%)
People in Group quarters - Orthopedic wards and institutions for the physically handicapped (%)
People in Group quarters - Wards in general hospitals for patients who have no usual home elsewhere (%)
People in Group quarters - Wards in military hospitals for patients who have no usual home elsewhere (%)
People in Group quarters - Juvenile institutions (%)
People in Group quarters - Long-term care (%)
People in Group quarters - Homes for abused, dependent, and neglected children (%)
People in Group quarters - Residential treatment centers for emotionally disturbed children (%)
People in Group quarters - Training schools for juvenile delinquents (%)
People in Group quarters - Short-term care, detention or diagnostic centers for delinquent children (%)
People in Group quarters - Type of juvenile institution unknown (%)
People in Group quarters - Noninstitutionalized population (%)
People in Group quarters - College dormitories (includes college quarters off campus) (%)
People in Group quarters - Military quarters (%)
People in Group quarters - On base (%)
People in Group quarters - Barracks, unaccompanied personnel housing (UPH), (Enlisted/Officer), ;and similar group living quarters for military personnel (%)
People in Group quarters - Transient quarters for temporary residents (%)
People in Group quarters - Military ships (%)
People in Group quarters - Group homes (%)
People in Group quarters - Homes or halfway houses for drug/alcohol abuse (%)
People in Group quarters - Homes for the mentally ill (%)
People in Group quarters - Homes for the mentally retarded (%)
People in Group quarters - Homes for the physically handicapped (%)
People in Group quarters - Other group homes (%)
People in Group quarters - Religious group quarters (%)
People in Group quarters - Dormitories (%)
People in Group quarters - Agriculture workers' dormitories on farms (%)
People in Group quarters - Job Corps and vocational training facilities (%)
People in Group quarters - Other workers' dormitories (%)
People in Group quarters - Crews of maritime vessels (%)
People in Group quarters - Other nonhousehold living situations (%)
People in Group quarters - Other noninstitutional group quarters (%)
Residents speaking English at home (%)
Residents speaking English at home - Born in the United States (%)
Residents speaking English at home - Native, born elsewhere (%)
Residents speaking English at home - Foreign born (%)
Residents speaking Spanish at home (%)
Residents speaking Spanish at home - Born in the United States (%)
Residents speaking Spanish at home - Native, born elsewhere (%)
Residents speaking Spanish at home - Foreign born (%)
Residents speaking other language at home (%)
Residents speaking other language at home - Born in the United States (%)
Residents speaking other language at home - Native, born elsewhere (%)
Residents speaking other language at home - Foreign born (%)
Class of Workers - Employee of private company (%)
Class of Workers - Self-employed in own incorporated business (%)
Class of Workers - Private not-for-profit wage and salary workers (%)
Class of Workers - Local government workers (%)
Class of Workers - State government workers (%)
Class of Workers - Federal government workers (%)
Class of Workers - Self-employed workers in own not incorporated business and Unpaid family workers (%)
House heating fuel used in houses and condos - Utility gas (%)
House heating fuel used in houses and condos - Bottled, tank, or LP gas (%)
House heating fuel used in houses and condos - Electricity (%)
House heating fuel used in houses and condos - Fuel oil, kerosene, etc. (%)
House heating fuel used in houses and condos - Coal or coke (%)
House heating fuel used in houses and condos - Wood (%)
House heating fuel used in houses and condos - Solar energy (%)
House heating fuel used in houses and condos - Other fuel (%)
House heating fuel used in houses and condos - No fuel used (%)
House heating fuel used in apartments - Utility gas (%)
House heating fuel used in apartments - Bottled, tank, or LP gas (%)
House heating fuel used in apartments - Electricity (%)
House heating fuel used in apartments - Fuel oil, kerosene, etc. (%)
House heating fuel used in apartments - Coal or coke (%)
House heating fuel used in apartments - Wood (%)
House heating fuel used in apartments - Solar energy (%)
House heating fuel used in apartments - Other fuel (%)
House heating fuel used in apartments - No fuel used (%)
Armed forces status - In Armed Forces (%)
Armed forces status - Civilian (%)
Armed forces status - Civilian - Veteran (%)
Armed forces status - Civilian - Nonveteran (%)
Fatal accidents locations in years 2005-2021
Fatal accidents locations in 2005
Fatal accidents locations in 2006
Fatal accidents locations in 2007
Fatal accidents locations in 2008
Fatal accidents locations in 2009
Fatal accidents locations in 2010
Fatal accidents locations in 2011
Fatal accidents locations in 2012
Fatal accidents locations in 2013
Fatal accidents locations in 2014
Fatal accidents locations in 2015
Fatal accidents locations in 2016
Fatal accidents locations in 2017
Fatal accidents locations in 2018
Fatal accidents locations in 2019
Fatal accidents locations in 2020
Fatal accidents locations in 2021
Alcohol use - People drinking some alcohol every month (%)
Alcohol use - People not drinking at all (%)
Alcohol use - Average days/month drinking alcohol
Alcohol use - Average drinks/week
Alcohol use - Average days/year people drink much
Audiometry - Average condition of hearing (%)
Audiometry - People that can hear a whisper from across a quiet room (%)
Audiometry - People that can hear normal voice from across a quiet room (%)
Audiometry - Ears ringing, roaring, buzzing (%)
Audiometry - Had a job exposure to loud noise (%)
Audiometry - Had off-work exposure to loud noise (%)
Blood Pressure & Cholesterol - Has high blood pressure (%)
Blood Pressure & Cholesterol - Checking blood pressure at home (%)
Blood Pressure & Cholesterol - Frequently checking blood cholesterol (%)
Blood Pressure & Cholesterol - Has high cholesterol level (%)
Consumer Behavior - Money monthly spent on food at supermarket/grocery store
Consumer Behavior - Money monthly spent on food at other stores
Consumer Behavior - Money monthly spent on eating out
Consumer Behavior - Money monthly spent on carryout/delivered foods
Consumer Behavior - Income spent on food at supermarket/grocery store (%)
Consumer Behavior - Income spent on food at other stores (%)
Consumer Behavior - Income spent on eating out (%)
Consumer Behavior - Income spent on carryout/delivered foods (%)
Current Health Status - General health condition (%)
Current Health Status - Blood donors (%)
Current Health Status - Has blood ever tested for HIV virus (%)
Current Health Status - Left-handed people (%)
Dermatology - People using sunscreen (%)
Diabetes - Diabetics (%)
Diabetes - Had a blood test for high blood sugar (%)
Diabetes - People taking insulin (%)
Diet Behavior & Nutrition - Diet health (%)
Diet Behavior & Nutrition - Milk product consumption (# of products/month)
Diet Behavior & Nutrition - Meals not home prepared (#/week)
Diet Behavior & Nutrition - Meals from fast food or pizza place (#/week)
Diet Behavior & Nutrition - Ready-to-eat foods (#/month)
Diet Behavior & Nutrition - Frozen meals/pizza (#/month)
Drug Use - People that ever used marijuana or hashish (%)
Drug Use - Ever used hard drugs (%)
Drug Use - Ever used any form of cocaine (%)
Drug Use - Ever used heroin (%)
Drug Use - Ever used methamphetamine (%)
Health Insurance - People covered by health insurance (%)
Kidney Conditions-Urology - Avg. # of times urinating at night
Medical Conditions - People with asthma (%)
Medical Conditions - People with anemia (%)
Medical Conditions - People with psoriasis (%)
Medical Conditions - People with overweight (%)
Medical Conditions - Elderly people having difficulties in thinking or remembering (%)
Medical Conditions - People who ever received blood transfusion (%)
Medical Conditions - People having trouble seeing even with glass/contacts (%)
Medical Conditions - People with arthritis (%)
Medical Conditions - People with gout (%)
Medical Conditions - People with congestive heart failure (%)
Medical Conditions - People with coronary heart disease (%)
Medical Conditions - People with angina pectoris (%)
Medical Conditions - People who ever had heart attack (%)
Medical Conditions - People who ever had stroke (%)
Medical Conditions - People with emphysema (%)
Medical Conditions - People with thyroid problem (%)
Medical Conditions - People with chronic bronchitis (%)
Medical Conditions - People with any liver condition (%)
Medical Conditions - People who ever had cancer or malignancy (%)
Mental Health - People who have little interest in doing things (%)
Mental Health - People feeling down, depressed, or hopeless (%)
Mental Health - People who have trouble sleeping or sleeping too much (%)
Mental Health - People feeling tired or having little energy (%)
Mental Health - People with poor appetite or overeating (%)
Mental Health - People feeling bad about themself (%)
Mental Health - People who have trouble concentrating on things (%)
Mental Health - People moving or speaking slowly or too fast (%)
Mental Health - People having thoughts they would be better off dead (%)
Oral Health - Average years since last visit a dentist
Oral Health - People embarrassed because of mouth (%)
Oral Health - People with gum disease (%)
Oral Health - General health of teeth and gums (%)
Oral Health - Average days a week using dental floss/device
Oral Health - Average days a week using mouthwash for dental problem
Oral Health - Average number of teeth
Pesticide Use - Households using pesticides to control insects (%)
Pesticide Use - Households using pesticides to kill weeds (%)
Physical Activity - People doing vigorous-intensity work activities (%)
Physical Activity - People doing moderate-intensity work activities (%)
Physical Activity - People walking or bicycling (%)
Physical Activity - People doing vigorous-intensity recreational activities (%)
Physical Activity - People doing moderate-intensity recreational activities (%)
Physical Activity - Average hours a day doing sedentary activities
Physical Activity - Average hours a day watching TV or videos
Physical Activity - Average hours a day using computer
Physical Functioning - People having limitations keeping them from working (%)
Physical Functioning - People limited in amount of work they can do (%)
Physical Functioning - People that need special equipment to walk (%)
Physical Functioning - People experiencing confusion/memory problems (%)
Physical Functioning - People requiring special healthcare equipment (%)
Prescription Medications - Average number of prescription medicines taking
Preventive Aspirin Use - Adults 40+ taking low-dose aspirin (%)
Reproductive Health - Vaginal deliveries (%)
Reproductive Health - Cesarean deliveries (%)
Reproductive Health - Deliveries resulted in a live birth (%)
Reproductive Health - Pregnancies resulted in a delivery (%)
Reproductive Health - Women breastfeeding newborns (%)
Reproductive Health - Women that had a hysterectomy (%)
Reproductive Health - Women that had both ovaries removed (%)
Reproductive Health - Women that have ever taken birth control pills (%)
Reproductive Health - Women taking birth control pills (%)
Reproductive Health - Women that have ever used Depo-Provera or injectables (%)
Reproductive Health - Women that have ever used female hormones (%)
Sexual Behavior - People 18+ that ever had sex (vaginal, anal, or oral) (%)
Sexual Behavior - Males 18+ that ever had vaginal sex with a woman (%)
Sexual Behavior - Males 18+ that ever performed oral sex on a woman (%)
Sexual Behavior - Males 18+ that ever had anal sex with a woman (%)
Sexual Behavior - Males 18+ that ever had any sex with a man (%)
Sexual Behavior - Females 18+ that ever had vaginal sex with a man (%)
Sexual Behavior - Females 18+ that ever performed oral sex on a man (%)
Sexual Behavior - Females 18+ that ever had anal sex with a man (%)
Sexual Behavior - Females 18+ that ever had any kind of sex with a woman (%)
Sexual Behavior - Average age people first had sex
Sexual Behavior - Average number of female sex partners in lifetime (males 18+)
Sexual Behavior - Average number of female vaginal sex partners in lifetime (males 18+)
Sexual Behavior - Average age people first performed oral sex on a woman (18+)
Sexual Behavior - Average number of woman performed oral sex on in lifetime (18+)
Sexual Behavior - Average number of male sex partners in lifetime (males 18+)
Sexual Behavior - Average number of male anal sex partners in lifetime (males 18+)
Sexual Behavior - Average age people first performed oral sex on a man (18+)
Sexual Behavior - Average number of male oral sex partners in lifetime (18+)
Sexual Behavior - People using protection when performing oral sex (%)
Sexual Behavior - Average number of times people have vaginal or anal sex a year
Sexual Behavior - People having sex without condom (%)
Sexual Behavior - Average number of male sex partners in lifetime (females 18+)
Sexual Behavior - Average number of male vaginal sex partners in lifetime (females 18+)
Sexual Behavior - Average number of female sex partners in lifetime (females 18+)
Sexual Behavior - Circumcised males 18+ (%)
Sleep Disorders - Average hours sleeping at night
Sleep Disorders - People that has trouble sleeping (%)
Smoking-Cigarette Use - People smoking cigarettes (%)
Taste & Smell - People 40+ having problems with smell (%)
Taste & Smell - People 40+ having problems with taste (%)
Taste & Smell - People 40+ that ever had wisdom teeth removed (%)
Taste & Smell - People 40+ that ever had tonsils teeth removed (%)
Taste & Smell - People 40+ that ever had a loss of consciousness because of a head injury (%)
Taste & Smell - People 40+ that ever had a broken nose or other serious injury to face or skull (%)
Taste & Smell - People 40+ that ever had two or more sinus infections (%)
Weight - Average height (inches)
Weight - Average weight (pounds)
Weight - Average BMI
Weight - People that are obese (%)
Weight - People that ever were obese (%)
Weight - People trying to lose weight (%)
146,334 68.9% Hispanic 25,707 12.1% White alone 17,428 8.2% Black alone 15,873 7.5% Asian alone 4,913 2.3% Two or more races 1,618 0.8% Other race alone 394 0.2% Native Hawaiian and Other 181 0.09% American Indian alone
According to our research of California and other state lists, there were 266 registered sex offenders living in Fontana, California as of April 27, 2024 . The ratio of all residents to sex offenders in Fontana is 788 to 1.The ratio of registered sex offenders to all residents in this city is near the state average.
The City-Data.com crime index weighs serious crimes and violent crimes more heavily. Higher means more crime, U.S. average is 246.1. It adjusts for the number of visitors and daily workers commuting into cities.
- means the value is smaller than the state average.
- means the value is about the same as the state average.
- means the value is bigger than the state average.
- means the value is much bigger than the state average.
Crime rate in Fontana detailed stats: murders, rapes, robberies, assaults, burglaries, thefts, arson Officers per 1,000 residents here:
0.88California average:
2.30
Latest news from Fontana, CA collected exclusively by city-data.com from local newspapers, TV, and radio stations
Ancestries: American (1.8%), German (1.2%).
Current Local Time:
Land area: 36.1 square miles.
Population density: 5,883 people per square mile (average).
57,770 residents are foreign born (21.3% Latin America , 5.1% Asia ).
This city:
27.4%California:
26.5%
Median real estate property taxes paid for housing units with mortgages in 2022: $4,812 (0.8%)Median real estate property taxes paid for housing units with no mortgage in 2022: $3,186 (0.6%)
Nearest city with pop. 200,000+: Riverside, CA
Nearest city with pop. 1,000,000+: Los Angeles, CA
Nearest cities:
Latitude: 34.10 N, Longitude: 117.46 W
Daytime population change due to commuting: -18,651 (-8.8%)Workers who live and work in this city: 29,723 (29.2%)
Property values in Fontana, CA
Single-family new house construction building permits:
2022: 538 buildings , average cost: $250,0002021: 652 buildings , average cost: $251,1002020: 847 buildings , average cost: $306,8002019: 642 buildings , average cost: $317,0002018: 413 buildings , average cost: $298,0002017: 562 buildings , average cost: $273,8002016: 458 buildings , average cost: $276,1002015: 456 buildings , average cost: $257,5002014: 336 buildings , average cost: $271,8002013: 223 buildings , average cost: $323,9002012: 179 buildings , average cost: $278,0002011: 136 buildings , average cost: $196,1002010: 103 buildings , average cost: $210,6002009: 326 buildings , average cost: $210,5002008: 177 buildings , average cost: $214,1002007: 794 buildings , average cost: $229,7002006: 1001 buildings , average cost: $226,4002005: 1851 buildings , average cost: $231,1002004: 1359 buildings , average cost: $212,1002003: 1340 buildings , average cost: $204,7002002: 1806 buildings , average cost: $191,9002001: 1083 buildings , average cost: $183,9002000: 1435 buildings , average cost: $181,5001999: 1323 buildings , average cost: $185,2001998: 1301 buildings , average cost: $158,9001997: 926 buildings , average cost: $146,200Unemployment in December 2023:
Most common occupations in Fontana, CA (%)
Both Males Females
Laborers and material movers, hand (5.0%)
Cooks and food preparation workers (4.9%)
Driver/sales workers and truck drivers (4.3%)
Material recording, scheduling, dispatching, and distributing workers (4.1%)
Building and grounds cleaning and maintenance occupations (3.7%)
Other management occupations, except farmers and farm managers (3.4%)
Cashiers (3.2%)
Driver/sales workers and truck drivers (7.2%)
Laborers and material movers, hand (6.5%)
Material recording, scheduling, dispatching, and distributing workers (4.6%)
Cooks and food preparation workers (3.7%)
Other management occupations, except farmers and farm managers (3.7%)
Building and grounds cleaning and maintenance occupations (3.4%)
Construction laborers (3.2%)
Cooks and food preparation workers (6.3%)
Cashiers (5.0%)
Other office and administrative support workers, including supervisors (4.2%)
Building and grounds cleaning and maintenance occupations (4.0%)
Registered nurses (4.0%)
Retail sales workers, except cashiers (3.9%)
Information and record clerks, except customer service representatives (3.9%)
Earthquake activity:
Fontana-area historical earthquake activity is significantly above California state average. It is 7338% greater than the overall U.S. average. On 6/28/1992 at 11:57:34, a magnitude 7.6 (6.2 MB, 7.6 MS, 7.3 MW, Depth: 0.7 mi, Class: Major, Intensity: VIII - XII) earthquake occurred 53.4 miles away from Fontana center, causing 3 deaths ( 1 shaking deaths, 2 other deaths) and 400 injuries, causing $100,000,000 total damage and $40,000,000 insured lossesOn 7/21/1952 at 11:52:14, a magnitude 7.7 (7.7 UK) earthquake occurred 107.7 miles away from the city center, causing $50,000,000 total damage On 10/16/1999 at 09:46:44, a magnitude 7.4 (6.3 MB, 7.4 MS, 7.2 MW, 7.3 ML) earthquake occurred 65.2 miles away from Fontana center On 6/28/1992 at 15:05:30, a magnitude 6.9 (6.3 MB, 6.7 MS, 6.5 MW, 6.9 ME, Depth: 3.1 mi, Class: Strong, Intensity: VII - IX) earthquake occurred 39.0 miles away from the city center On 5/19/1940 at 04:36:40, a magnitude 7.2 (7.2 UK) earthquake occurred 118.1 miles away from the city center, causing $33,000,000 total damage On 4/21/1918 at 22:32:30, a magnitude 6.8 (6.8 UK) earthquake occurred 19.8 miles away from the city center Magnitude types: body-wave magnitude (MB), energy magnitude (ME), local magnitude (ML), surface-wave magnitude (MS), moment magnitude (MW) Natural disasters: The number of natural disasters in San Bernardino County (46) is a lot greater than the US average (15).Major Disasters (Presidential) Declared: 27Emergencies Declared: 2Fires: 24, Floods: 18, Storms: 9, Winter Storms: 6, Landslides: 5, Mudslides: 4, Heavy Rains: 2, Earthquake: 1, Flash Flood: 1, Freeze: 1, Hurricane: 1, Snow: 1, Tornado: 1, Tropical Storm: 1, Wind: 1, Other: 1 (Note: some incidents may be assigned to more than one category). Main business address for: CALIFORNIA STEEL INDUSTRIES INC STEEL WORKS, BLAST FURNACES ROLLING MILLS (COKE OVENS) ).
Hospitals and medical centers in Fontana: KAISER FOUNDATION HOSPITAL FONTANA (Voluntary non-profit - Private, provides emergency services, 9961 SIERRA AVE) CITRUS NURSING CENTER (9440 CITRUS AVENUE)
LAUREL CONVALESCENT HOSPITAL (7509 N LAUREL AVE)
FONTANA DIALYSIS (17950 FOOTHILL BLVD.)
KAISER FOUNDATION HOSPITAL MEDICAL CTR.- FONTANA (PERITONEAL DIALYSIS UNIT)
RAI-JUNIPER AVE-FONTANA (10557 JUNIPER AVENUE, SUITE B)
GRACE HOME HEALTH NURSING SERVICES, INC (6101 CHERRY AVENUE SUITE 206)
KAISER FOUNDATION HOSPITAL HOME HEALTH AGENCY (17284 SLOVER AVENUE)
SIERRA HOME HEALTH CARE (17351 ARROW BLVD)
Amtrak stations near Fontana: 9 miles: SAN BERNADINO (SAN BERNARDINO, 1170 W. 3RD ST.) Services: ticket office, partially wheelchair accessible, public payphones, free short-term parking, free long-term parking.
10 miles: RIVERSIDE (4066 VINE ST.) - Bus Station Services: fully wheelchair accessible, public payphones, full-service food facilities, free short-term parking, free long-term parking, call for car rental service, call for taxi service, public transit connection.
12 miles: ONTARIO (228 S. PLUM ST.) Services: fully wheelchair accessible, public payphones, vending machines, free short-term parking, call for taxi service.
Colleges/Universities in Fontana: Westech College Full-time enrollment: 726; Location: 9490 Sierra Avenue; Private, for-profit; Website: www.westech.edu)
Salon Success Academy-Fontana Full-time enrollment: 81; Location: 16803 Arrow Hwy; Private, for-profit; Website: www.gotobeautyschool.com)
Colleges/universities with over 2000 students nearest to Fontana:
Universal Technical Institute of California Inc (about 7 miles; Rancho Cucamonga, CA ; Full-time enrollment: 4,158)
Chaffey College (about 8 miles; Rancho Cucamonga, CA ; FT enrollment: 10,496)
San Bernardino Valley College (about 9 miles; San Bernardino, CA ; FT enrollment: 7,444)
California State University-San Bernardino (about 10 miles; San Bernardino, CA ; FT enrollment: 15,748)
Riverside City College (about 10 miles; Riverside, CA ; FT enrollment: 10,661)
The Art Institute of California-Argosy University Inland Empire (about 11 miles; San Bernardino, CA ; FT enrollment: 2,238)
University of California-Riverside (about 12 miles; Riverside, CA ; FT enrollment: 20,647)
Public high schools in Fontana: FONTANA HIGH Students: 2,641, Location: 9453 CITRUS AVE., Grades: 9-12)FONTANA A. B. MILLER HIGH Students: 2,012, Location: 6821 OLEANDER AVE., Grades: 9-12)SUMMIT HIGH Students: 1,819, Location: 15551 SUMMIT AVE., Grades: 9-12)HENRY J. KAISER HIGH Students: 1,807, Location: 11155 ALMOND AVE., Grades: 9-12)BIRCH HIGH (CONTINUATION) Students: 135, Location: 7930 LOCUST AVE., Grades: 9-12)CITRUS HIGH (CONTINUATION) Students: 85, Location: 10760 CYPRESS, Grades: 9-12)JURUPA HILLS HIGH Location: 10700 OLEANDER AVE., Grades: 9-12)Biggest public elementary/middle schools in Fontana: WAYNE RUBLE MIDDLE Students: 1,239, Location: 6762 JUNIPER AVE., Grades: 6-8)HERITAGE INTERMEDIATE Students: 1,174, Location: 13766 S. HERITAGE CIR., Grades: 6-8)SOUTHRIDGE MIDDLE Students: 1,122, Location: 14500 LIVE OAK AVE., Grades: 6-8)ALDER MIDDLE Students: 1,084, Location: 7555 ALDER AVE., Grades: 6-8)FONTANA MIDDLE Students: 1,078, Location: 8425 MANGO AVE., Grades: 6-8)HARRY S. TRUMAN MIDDLE Students: 1,050, Location: 16224 MALLORY DR., Grades: 6-8)ALMERIA MIDDLE Students: 985, Location: 7723 ALMERIA AVE., Grades: 6-8)SYCAMORE HILLS ELEMENTARY Students: 571, Location: 11036 MAHOGANY DR., Grades: KG-6)CECILIA LUCERO SOLORIO ELEMENTARY Students: 559, Location: 15172 WALNUT ST., Grades: KG-5)PALMETTO ELEMENTARY Students: 524, Location: 9325 PALMETTO AVE., Grades: KG-5)Private elementary/middle schools in Fontana: WATER OF LIFE CHRISTIAN SCHOOL Students: 398, Location: 7625 EAST AVE, Grades: PK-6)
RESURRECTION ACADEMY Students: 209, Location: 17434 MILLER AVE, Grades: UG-8)
MONTESSORI CHILD DEVELOPMENT CENTER Students: 75, Location: 8196 MULBERRY AVE, Grades: PK-3)
ALL START ACADEMY Students: 50, Location: 10022 PALMETTO AVE, Grades: PK-1)
LIFE COVENANT CHRISTIAN ACADEMY Students: 26, Location: 9315 CITRUS AVE, Grades: KG-8)
See full list of schools located in Fontana
Notable locations in Fontana: (A) , Southern Pacific Industrial Park (B) , Jurupa Industrial Park (C) , Southwest Industrial Park (D) , Flippi Winery (E) , San Bernardino County Fire Department Station 78 (F) , San Bernardino County Fire Department Station 74 Fontana (G) , San Bernardino County Fire Department Station 77 Bloomington (H) , San Bernardino County Fire Department Station 71 (I) , Knopf Seniors Center (J) , Fontana City Hall (K) , Fontana Branch San Bernardino County Library (L) , Jessie Turner Community Center (M) . Display/hide their locations on the map
Shopping Centers: (1) , Park Plaza Shopping Center (2) , Fontana Village Shopping Center (3) , Fontana Towne Center Shopping Center (4) , Fontana Plaza Shopping Center (5) , Citrus Shopping Center (6) , Vineyard Valley Shopping Center (7) , Southridge Village Shopping Center (8) , Southridge Plaza Shopping Center (9) . Display/hide their locations on the map
Churches in Fontana include: (A) , Bethel Assembly of God Church (B) , Calvary Baptist Church (C) , Church of Christ (D) , The Church of Jesus Christ of Latter Day Saints (E) , First Baptist Church (F) , First Christian Church (G) , First Evangelical Lutheran Church (H) , First Presbyterian Church (I) . Display/hide their locations on the map
Cemetery: (1) . Display/hide its location on the map
Reservoir: (A) . Display/hide its location on the map
Parks in Fontana include: (1) , Fontana Bird Park (2) , Miller Park (3) , North Fontana Park (4) , Declez Ranch-Pagliuso Winery Historic Site (5) , Fontana Farms Historic Site (6) , Juniper Park (7) , Martin Tudor-Jurupa Hills Regional Park (8) , Power Easement Park (9) . Display/hide their locations on the map
Hotels: (1) , AmeriHost Inn / Suites Fontana (13500 Baseline Avenue) (2) . Display/hide their approximate locations on the map
Birthplace of: Vaughn Juares - Music video director, Shannon Boxx - Soccer midfielder, Mike Davis (scholar) - Historian, Jordan Hasay - Middle-distance runner, Alan Harper - 2005 NFL player (New York Jets, born : Sep 6, 1979), Bill Fagerbakke - Film actor, Bobby Kielty - 2005 Major League Baseball player (Oakland Athletics, born : Aug 5, 1976), Chris Stewart (baseball) - Baseball player, D.J. Hackett - 2005 NFL player (Seattle Seahawks, born : Jul 31, 1981), Kenyon Coleman - 2005 NFL player (Dallas Cowboys, born : Apr 10, 1979).
San Bernardino County has a predicted average indoor radon screening level between 2 and 4 pCi/L (pico curies per liter) - Moderate Potential Average household size: This city:
4.0 peopleCalifornia:
2.9 people
Percentage of family households: This city:
86.4%Whole state:
68.7%
Percentage of households with unmarried partners: This city:
7.7%Whole state:
7.2%
Likely homosexual households (counted as self-reported same-sex unmarried-partner households)
Lesbian couples: 0.4% of all households Gay men: 0.3% of all households
People in group quarters in Fontana in 2010:
194 people in nursing facilities/skilled-nursing facilities
96 people in group homes intended for adults
54 people in residential treatment centers for adults
48 people in workers' group living quarters and job corps centers
34 people in group homes for juveniles (non-correctional)
18 people in other noninstitutional facilities
People in group quarters in Fontana in 2000:
189 people in nursing homes
158 people in other noninstitutional group quarters
88 people in other group homes
29 people in mental (psychiatric) hospitals or wards
22 people in homes or halfway houses for drug/alcohol abuse
11 people in homes for the mentally retarded
2 people in religious group quarters
Banks with most branches in Fontana (2011 data):
Bank of America, National Association: Foothill Citrus Branch, Valley And Sierra Branch, North Fontana Branch, Fontana Branch, South Fontana Branch. Info updated 2009/11/18: Bank assets: $1,451,969.3 mil, Deposits: $1,077,176.8 mil, headquarters in Charlotte, NC, positive income , 5782 total offices , Holding Company: Bank Of America Corporation
JPMorgan Chase Bank, National Association: Fontana Branch, Foothill And Citrus Branch, Fontana Stater Bros Banking Center, Fontana Branch, Fontana - Sierra Lakes. Info updated 2011/11/10: Bank assets: $1,811,678.0 mil, Deposits: $1,190,738.0 mil, headquarters in Columbus, OH, positive income , International Specialization, 5577 total offices , Holding Company: Jpmorgan Chase & Co.
Wells Fargo Bank, National Association: Falcon Ridge Branch, Fontana North Branch, Sierra Crossroads Branch, Sierra Lake Village Branch. Info updated 2011/04/05: Bank assets: $1,161,490.0 mil, Deposits: $905,653.0 mil, headquarters in Sioux Falls, SD, positive income , 6395 total offices , Holding Company: Wells Fargo & Company
U.S. Bank National Association: Fontana Branch at 7400 Cherry Avenue, branch established on 2003/06/30; Fontana Vons Branch at 7390 Cherry Avenue, branch established on 2003/11/10. Info updated 2012/01/30: Bank assets: $330,470.8 mil, Deposits: $236,091.5 mil, headquarters in Cincinnati, OH, positive income , 3121 total offices , Holding Company: U.S. Bancorp
Citibank, National Association: 8501 Sierra Avenue Branch at 8501 Sierra Avenue, branch established on 1890/01/01; 9885 Sierra Ave. P.O. Box 608 Branch at 9885 Sierra Ave., branch established on 1987/06/30. Info updated 2012/01/10: Bank assets: $1,288,658.0 mil, Deposits: $882,541.0 mil, headquarters in Sioux Falls, SD, positive income , International Specialization, 1048 total offices , Holding Company: Citigroup Inc.
Union Bank, National Association: Fontana Cash & Save Branch at 16055 Foothill Boulevard, branch established on 2007/06/20. Info updated 2011/09/01: Bank assets: $88,967.5 mil, Deposits: $65,286.4 mil, headquarters in San Francisco, CA, positive income , Commercial Lending Specialization, 403 total offices , Holding Company: Mitsubishi Ufj Financial Group, Inc.
Citizens Business Bank: Fontana Branch at 9244 Sierra Avenue, branch established on 1984/11/01. Info updated 2011/03/30: Bank assets: $6,475.4 mil, Deposits: $4,625.6 mil, headquarters in Ontario, CA, positive income , Commercial Lending Specialization, 46 total offices , Holding Company: Cvb Financial Corp.
Community Bank: Fontana Branch at 9699 Sierra Avenue, branch established on 1981/09/14. Info updated 2010/02/16: Bank assets: $2,601.3 mil, Deposits: $1,941.4 mil, headquarters in Pasadena, CA, positive income , Commercial Lending Specialization, 17 total offices
Kaiser Federal Bank: Sierra Avenue Branch at 9714 Sierra Avenue, branch established on 2001/11/01. Info updated 2011/07/21: Bank assets: $931.9 mil, Deposits: $697.1 mil, headquarters in Covina, CA, positive income , Commercial Lending Specialization, 9 total offices
For population 15 years and over in Fontana:
Never married: 41.1%Now married: 48.7%Separated: 1.6%Widowed: 2.6%Divorced: 5.9% For population 25 years and over in Fontana:
High school or higher: 79.0%Bachelor's degree or higher: 22.9%Graduate or professional degree: 6.7%Unemployed: 8.7%Mean travel time to work (commute): 29.6 minutes
Education Gini index (Inequality in education) Here:
16.3California average:
15.5
Religion statistics for Fontana, CA (based on San Bernardino County data)
Religion Adherents Congregations Catholic 445,334 55 Evangelical Protestant 243,524 832 Other 80,047 205 Mainline Protestant 26,062 135 Black Protestant 14,969 37 Orthodox 3,868 10 None 1,221,406 -
Source: Clifford Grammich, Kirk Hadaway, Richard Houseal, Dale E.Jones, Alexei Krindatch, Richie Stanley and Richard H.Taylor. 2012. 2010 U.S.Religion Census: Religious Congregations & Membership Study. Association of Statisticians of American Religious Bodies. Jones, Dale E., et al. 2002. Congregations and Membership in the United States 2000. Nashville, TN: Glenmary Research Center. Graphs represent county-level data
Food Environment Statistics: Number of grocery stores : 301San Bernardino County :
1.50 / 10,000 pop.California :
2.14 / 10,000 pop.
Number of supercenters and club stores : 11This county :
0.05 / 10,000 pop.State :
0.04 / 10,000 pop.
Number of convenience stores (no gas) : 114San Bernardino County :
0.57 / 10,000 pop.California :
0.62 / 10,000 pop.
Number of convenience stores (with gas) : 320San Bernardino County :
1.60 / 10,000 pop.California :
1.49 / 10,000 pop.
Number of full-service restaurants : 940Here :
4.69 / 10,000 pop.State :
7.42 / 10,000 pop.
Adult diabetes rate : San Bernardino County :
7.4%State :
7.3%
Adult obesity rate : This county :
27.1%California :
21.3%
Low-income preschool obesity rate : San Bernardino County :
16.2%State :
17.9%
Health and Nutrition:
Average overall health of teeth and gums : This city:
46.9%State:
48.0%
People feeling badly about themselves : Here:
21.8%California:
20.2%
People not drinking alcohol at all : Average hours sleeping at night : Fontana:
6.7California:
6.8
General health condition : This city:
55.6%State:
56.4%
Average condition of hearing : Fontana:
82.7%California:
80.9%
More about Health and Nutrition of Fontana, CA Residents
Local government employment and payroll (March 2022)
Function
Full-time employees
Monthly full-time payroll
Average yearly full-time wage
Part-time employees
Monthly part-time payroll
Police Protection - Officers
190 $2,638,237 $166,625 0 $0 Police - Other
101 $729,034 $86,618 9 $11,373 Parks and Recreation
76 $611,068 $96,484 404 $588,683 Financial Administration
54 $516,487 $114,775 7 $22,163 Streets and Highways
46 $452,627 $118,077 5 $5,248 Housing and Community Development (Local)
38 $376,139 $118,781 2 $3,871 Other and Unallocable
22 $176,273 $96,149 9 $13,757 Sewerage
20 $144,495 $86,697 0 $0 Other Government Administration
9 $108,048 $144,064 14 $21,784 Solid Waste Management
6 $54,290 $108,580 0 $0
Totals for Government
562 $5,806,696 $123,986 450 $666,879
Fontana government finances - Expenditure in 2021 (per resident):
Current Operations - Police Protection: $97,127,000 ($457.12)
Central Staff Services: $55,900,000 ($263.09)Local Fire Protection: $36,241,000 ($170.57)Regular Highways: $34,490,000 ($162.32)Sewerage: $22,368,000 ($105.27)General - Other: $20,741,000 ($97.62)Parks and Recreation: $10,437,000 ($49.12)Housing and Community Development: $4,460,000 ($20.99)Solid Waste Management: $3,995,000 ($18.80)Protective Inspection and Regulation - Other: $3,851,000 ($18.12)Health - Other: $217,000 ($1.02)General - Interest on Debt: $5,781,000 ($27.21)
Fontana government finances - Revenue in 2021 (per resident):
Charges - Other: $35,761,000 ($168.31)
Sewerage: $25,440,000 ($119.73)Solid Waste Management: $6,249,000 ($29.41)Parking Facilities: $1,158,000 ($5.45)Parks and Recreation: $1,072,000 ($5.05)Housing and Community Development: $735,000 ($3.46)Federal Intergovernmental - Other: $9,568,000 ($45.03)
Housing and Community Development: $3,455,000 ($16.26)Local Intergovernmental - Highways: $4,845,000 ($22.80)
Other: $2,908,000 ($13.69)Miscellaneous - General Revenue - Other: $41,317,000 ($194.46)
Interest Earnings: $3,903,000 ($18.37)Sale of Property: $3,627,000 ($17.07)Fines and Forfeits: $1,626,000 ($7.65)Rents: $857,000 ($4.03)State Intergovernmental - Other: $9,348,000 ($44.00)
Highways: $4,936,000 ($23.23)General Local Government Support: $21,000 ($0.10)Tax - Property: $75,695,000 ($356.25)
General Sales and Gross Receipts: $49,932,000 ($235.00)Other License: $15,045,000 ($70.81)Public Utilities Sales: $8,670,000 ($40.80)Occupation and Business License - Other: $6,753,000 ($31.78)Other: $2,628,000 ($12.37)Documentary and Stock Transfer: $1,591,000 ($7.49)Other Selective Sales: $1,132,000 ($5.33)
Fontana government finances - Debt in 2021 (per resident):
Long Term Debt - Beginning Outstanding - Unspecified Public Purpose: $183,511,000 ($863.68)
Outstanding Unspecified Public Purpose: $173,265,000 ($815.46)Retired Unspecified Public Purpose: $10,346,000 ($48.69)Issue, Unspecified Public Purpose: $100,000 ($0.47)
Fontana government finances - Cash and Securities in 2021 (per resident):
Bond Funds - Cash and Securities: $213,656,000 ($1005.56)
Other Funds - Cash and Securities: $338,179,000 ($1591.62)
Sinking Funds - Cash and Securities: $20,318,000 ($95.63)
6.45% of this county's 2021 resident taxpayers lived in other counties in 2020 ($54,954 average adjusted gross income )
Here:
6.45%California average:
5.19%
0.03% of residents moved from foreign countries ($259 average AGI )San Bernardino County:
0.03%California average:
0.03%
Top counties from which taxpayers relocated into this county between 2020 and 2021:
6.46% of this county's 2020 resident taxpayers moved to other counties in 2021 ($59,647 average adjusted gross income )
Here:
6.46%California average:
6.14%
0.03% of residents moved to foreign countries ($253 average AGI )San Bernardino County:
0.03%California average:
0.02%
Top counties to which taxpayers relocated from this county between 2020 and 2021:
Businesses in Fontana, CA
Name Count Name Count
24 Hour Fitness 2 Just Tires 1 7-Eleven 6 KFC 3 99 Cents Only Stores 1 Kmart 1 AT&T 3 Kohl's 1 Applebee's 1 Kroger 4 Arby's 1 LA Fitness 1 AutoZone 5 Little Caesars Pizza 2 Avenue 1 Lowe's 1 Baskin-Robbins 2 Marshalls 1 Bath & Body Works 1 McDonald's 7 Blockbuster 3 Motel 6 1 Brunswick Bowling & Billiards 1 Nike 5 Burger King 1 Nissan 1 CVS 2 OfficeMax 1 Carl\s Jr. 3 Panda Express 2 Chevrolet 1 Panera Bread 1 Chuck E. Cheese's 1 Payless 4 Church's Chicken 1 Penske 1 Circle K 6 PetSmart 1 Cold Stone Creamery 1 Pier 1 Imports 1 Costco 1 Pizza Hut 5 Curves 1 Popeyes 1 DHL 1 Quiznos 2 Dennys 2 RadioShack 2 Discount Tire 1 Rite Aid 4 Domino's Pizza 2 Safeway 1 DressBarn 1 Sears 4 Dressbarn 1 Sprint Nextel 4 Econo Lodge 1 Staples 1 El Pollo Loco 2 Starbucks 7 Fashion Bug 1 Subway 8 FedEx 10 T-Mobile 9 GNC 3 Taco Bell 4 GameStop 3 Target 2 H&R Block 7 Toys"R"Us 2 Hilton 1 U-Haul 4 Home Depot 2 UPS 8 Honda 1 Verizon Wireless 3 IHOP 1 Vons 1 Jack In The Box 8 Walgreens 3 Jamba Juice 1 Walmart 1 Jones New York 2 Wendy's 3
Strongest AM radio stations in Fontana:
KPLS (830 AM; 50 kW; ORANGE, CA; Owner: CRN LICENSES, LLC)
KSPA (1510 AM; 10 kW; ONTARIO, CA; Owner: ONTARIO BROADCASTING, LLC)
KLAC (570 AM; 50 kW; LOS ANGELES, CA; Owner: AMFM RADIO LICENSES, L.L.C.)
KFI (640 AM; 50 kW; LOS ANGELES, CA; Owner: CAPSTAR TX LIMITED PARTNERSHIP)
KTNQ (1020 AM; 50 kW; LOS ANGELES, CA; Owner: KTNQ-AM LICENSE CORP.)
KDIS (1110 AM; 50 kW; PASADENA, CA; Owner: ABC,INC.)
KXTA (1150 AM; 50 kW; LOS ANGELES, CA; Owner: CITICASTERS LICENSES, L.P.)
KTDD (1350 AM; 5 kW; SAN BERNARDINO, CA)
KRLH (590 AM; 2 kW; SAN BERNARDINO, CA; Owner: CARON BROADCASTING, INC.)
KFWB (980 AM; 50 kW; LOS ANGELES, CA; Owner: INFINITY BROADCASTING OPERATIONS, INC.)
KKDD (1290 AM; 5 kW; SAN BERNARDINO, CA; Owner: AMFM RADIO LICENSES, L.L.C.)
KPRO (1570 AM; 5 kW; RIVERSIDE, CA; Owner: OLIVE L. SHERBAN)
KSPN (710 AM; 50 kW; LOS ANGELES, CA; Owner: KABC-AM RADIO, INC.)
Strongest FM radio stations in Fontana:
K295AI (106.9 FM; MUSCOY, CA; Owner: ASSOCIATION FOR COMMUNITY EDUCATION, INC.)
KUOR-FM (89.1 FM; REDLANDS, CA; Owner: UNIVERSITY OF REDLANDS)
K264AF (100.7 FM; GUASTI, CA; Owner: EDUCATIONAL MEDIA FOUNDATION)
KOLA (99.9 FM; SAN BERNARDINO, CA; Owner: INLAND EMPIRE BROADCASTING CORP.)
KUCR (88.3 FM; RIVERSIDE, CA; Owner: THE REGENTS OF THE UNIV. OF CA)
KVCR (91.9 FM; SAN BERNARDINO, CA; Owner: SAN BERNARDINO COMMUNITY COLLEGE DISTRICT)
KCXX (103.9 FM; LAKE ARROWHEAD, CA; Owner: ALL-PRO BROADCASTING, INC.)
KLRD (90.1 FM; YUCAIPA, CA; Owner: EDUCATIONAL MEDIA FOUNDATION)
KGGI (99.1 FM; RIVERSIDE, CA; Owner: AMFM RADIO LICENSES, L.L.C.)
KLYY (97.5 FM; RIVERSIDE, CA; Owner: ENTRAVISION HOLDINGS, LLC)
K201CD (88.1 FM; VICTORVILLE, CA; Owner: SAN BERNARDINO COMMNTY COLLEGE DIST.)
KCBS-FM (93.1 FM; LOS ANGELES, CA; Owner: INFINITY BROADCASTING OPERATIONS, INC.)
KSCA (101.9 FM; GLENDALE, CA; Owner: HBC LICENSE CORPORATION)
KLOS (95.5 FM; LOS ANGELES, CA; Owner: KLOS-FM RADIO, INC.)
K212FA (90.3 FM; TEMPLE CITY, CA; Owner: EDUCATIONAL MEDIA FOUNDATION)
KOST (103.5 FM; LOS ANGELES, CA; Owner: CAPSTAR TX LIMITED PARTNERSHIP)
KLVE (107.5 FM; LOS ANGELES, CA; Owner: KLVE-FM LICENSE CORP.)
KIIS-FM (102.7 FM; LOS ANGELES, CA; Owner: CITICASTERS LICENSES, L.P.)
KPCC (89.3 FM; PASADENA, CA; Owner: PASADENA AREA COMMUNITY COLLEGE DISTRICT)
KHHT (92.3 FM; LOS ANGELES, CA; Owner: AMFM RADIO LICENSES, L.L.C.)
TV broadcast stations around Fontana:
KTRO-LP (Channel 50; LANCASTER, CA; Owner: ROBERT D. ADELMAN)
KHIZ (Channel 64; BARSTOW, CA; Owner: SUNBELT TELEVISION, INC.)
KCBS-TV (Channel 2; LOS ANGELES, CA; Owner: CBS BROADCASTING INC.)
KVCR-TV (Channel 24; SAN BERNARDINO, CA; Owner: SAN BERNARDINO COMMUNITY COLLEGE DISTRICT)
KRCA (Channel 62; RIVERSIDE, CA; Owner: KRCA LICENSE CORP.)
KPXN (Channel 30; SAN BERNARDINO, CA; Owner: PAXSON LOS ANGELES LICENSE, INC.)
KSGA-LP (Channel 59; SANTA BARBARA, CA; Owner: KJLA, LLC)
National Bridge Inventory (NBI) Statistics 79 Number of bridges751ft / 229m Total length $3,863,000 Total costs3,132,287 Total average daily traffic244,455 Total average daily truck traffic
New bridges - historical statistics
1 1910-1919 1 1930-1939 1 1940-1949 4 1950-1959 5 1960-1969 10 1970-1979 13 1980-1989 8 1990-1999 27 2000-2009 9 2010-2019
See full National Bridge Inventory statistics for Fontana, CA
Home Mortgage Disclosure Act Aggregated Statistics For Year 2009(Based on 11 full and 10 partial tracts) A) FHA, FSA/RHS & VA B) Conventional C) Refinancings D) Home Improvement Loans E) Loans on Dwellings For 5+ Families F) Non-occupant Loans on G) Loans On Manufactured Number Average Value Number Average Value Number Average Value Number Average Value Number Average Value Number Average Value Number Average Value
LOANS ORIGINATED 1,883 $229,925 822 $180,894 1,157 $218,070 38 $86,617 5 $526,372 235 $142,009 5 $84,022 APPLICATIONS APPROVED, NOT ACCEPTED 160 $219,544 127 $188,404 198 $214,330 20 $62,804 0 $0 35 $143,887 4 $22,065 APPLICATIONS DENIED 378 $228,673 222 $184,539 803 $228,419 75 $72,970 0 $0 124 $142,224 14 $68,619 APPLICATIONS WITHDRAWN 302 $228,889 164 $197,994 411 $222,111 37 $106,216 1 $13,283,060 54 $158,952 0 $0 FILES CLOSED FOR INCOMPLETENESS 67 $223,142 43 $192,402 119 $228,869 3 $190,880 0 $0 24 $152,061 1 $41,790
Aggregated Statistics For Year 2008(Based on 11 full and 10 partial tracts) A) FHA, FSA/RHS & VA B) Conventional C) Refinancings D) Home Improvement Loans E) Loans on Dwellings For 5+ Families F) Non-occupant Loans on G) Loans On Manufactured Number Average Value Number Average Value Number Average Value Number Average Value Number Average Value Number Average Value Number Average Value
LOANS ORIGINATED 1,040 $263,901 1,020 $239,783 1,005 $227,487 168 $93,603 5 $1,191,200 228 $187,271 17 $57,551 APPLICATIONS APPROVED, NOT ACCEPTED 98 $267,003 308 $252,786 449 $262,900 44 $56,241 0 $0 57 $190,879 32 $60,298 APPLICATIONS DENIED 256 $268,501 555 $259,962 1,803 $290,522 270 $111,550 1 $711,180 163 $229,601 47 $88,994 APPLICATIONS WITHDRAWN 156 $263,875 253 $239,613 512 $271,333 73 $135,264 0 $0 59 $203,399 3 $106,870 FILES CLOSED FOR INCOMPLETENESS 41 $263,702 73 $270,023 163 $284,292 14 $224,901 0 $0 12 $196,367 0 $0
Aggregated Statistics For Year 2007(Based on 11 full and 10 partial tracts) A) FHA, FSA/RHS & VA B) Conventional C) Refinancings D) Home Improvement Loans E) Loans on Dwellings For 5+ Families F) Non-occupant Loans on G) Loans On Manufactured Number Average Value Number Average Value Number Average Value Number Average Value Number Average Value Number Average Value Number Average Value
LOANS ORIGINATED 17 $308,675 2,142 $292,888 4,435 $282,371 660 $171,430 19 $2,982,880 336 $257,902 23 $69,462 APPLICATIONS APPROVED, NOT ACCEPTED 0 $0 697 $282,025 1,541 $289,128 209 $133,191 0 $0 104 $264,272 35 $80,165 APPLICATIONS DENIED 13 $310,405 1,535 $306,526 4,693 $324,604 878 $164,589 1 $500,000 307 $306,693 52 $82,216 APPLICATIONS WITHDRAWN 10 $215,003 653 $303,109 1,648 $320,890 204 $217,445 6 $693,125 97 $267,591 3 $238,513 FILES CLOSED FOR INCOMPLETENESS 0 $0 180 $306,283 620 $341,088 36 $217,293 0 $0 34 $284,052 0 $0
Aggregated Statistics For Year 2006(Based on 11 full and 10 partial tracts) A) FHA, FSA/RHS & VA B) Conventional C) Refinancings D) Home Improvement Loans E) Loans on Dwellings For 5+ Families F) Non-occupant Loans on G) Loans On Manufactured Number Average Value Number Average Value Number Average Value Number Average Value Number Average Value Number Average Value Number Average Value
LOANS ORIGINATED 11 $305,444 5,534 $263,561 8,023 $287,306 1,233 $170,443 3 $749,353 746 $247,880 24 $62,743 APPLICATIONS APPROVED, NOT ACCEPTED 2 $100,000 1,324 $270,041 2,004 $290,063 292 $147,314 1 $12,480 227 $264,212 54 $59,414 APPLICATIONS DENIED 0 $0 2,779 $265,874 4,647 $310,180 1,149 $165,023 0 $0 365 $283,286 44 $105,839 APPLICATIONS WITHDRAWN 2 $229,145 1,384 $280,659 3,092 $304,157 409 $216,998 0 $0 218 $259,104 3 $280,470 FILES CLOSED FOR INCOMPLETENESS 2 $176,000 285 $283,143 730 $301,422 60 $213,482 0 $0 42 $293,549 0 $0
Aggregated Statistics For Year 2005(Based on 11 full and 10 partial tracts) A) FHA, FSA/RHS & VA B) Conventional C) Refinancings D) Home Improvement Loans E) Loans on Dwellings For 5+ Families F) Non-occupant Loans on G) Loans On Manufactured Number Average Value Number Average Value Number Average Value Number Average Value Number Average Value Number Average Value Number Average Value
LOANS ORIGINATED 17 $233,675 6,543 $244,569 9,453 $252,711 1,346 $163,119 25 $2,467,622 793 $216,926 20 $108,092 APPLICATIONS APPROVED, NOT ACCEPTED 1 $269,000 1,506 $242,631 1,804 $249,268 271 $126,192 1 $420,000 230 $227,738 81 $65,783 APPLICATIONS DENIED 5 $171,546 2,338 $239,119 4,353 $266,319 1,021 $122,053 4 $969,500 400 $195,272 78 $86,043 APPLICATIONS WITHDRAWN 7 $173,456 1,904 $273,440 3,452 $260,199 525 $175,865 1 $4,640,000 255 $206,020 11 $98,616 FILES CLOSED FOR INCOMPLETENESS 1 $224,140 341 $257,988 1,041 $255,303 78 $147,736 0 $0 40 $252,624 0 $0
Aggregated Statistics For Year 2004(Based on 11 full and 10 partial tracts) A) FHA, FSA/RHS & VA B) Conventional C) Refinancings D) Home Improvement Loans E) Loans on Dwellings For 5+ Families F) Non-occupant Loans on G) Loans On Manufactured Number Average Value Number Average Value Number Average Value Number Average Value Number Average Value Number Average Value Number Average Value
LOANS ORIGINATED 66 $202,383 5,205 $199,805 10,687 $209,500 1,249 $141,080 17 $1,321,036 720 $178,540 38 $57,980 APPLICATIONS APPROVED, NOT ACCEPTED 9 $190,273 1,262 $207,179 2,137 $201,732 251 $111,523 0 $0 133 $192,504 53 $57,383 APPLICATIONS DENIED 10 $185,961 1,684 $194,038 4,238 $204,824 1,044 $87,411 4 $693,230 394 $136,768 58 $55,158 APPLICATIONS WITHDRAWN 18 $185,619 1,123 $221,084 3,444 $203,215 375 $122,776 1 $375,000 153 $169,533 4 $101,100 FILES CLOSED FOR INCOMPLETENESS 5 $179,756 255 $215,907 823 $208,089 67 $96,897 0 $0 37 $154,646 0 $0
Aggregated Statistics For Year 2003(Based on 11 full and 10 partial tracts) A) FHA, FSA/RHS & VA B) Conventional C) Refinancings D) Home Improvement Loans E) Loans on Dwellings For 5+ Families F) Non-occupant Loans on Number Average Value Number Average Value Number Average Value Number Average Value Number Average Value Number Average Value
LOANS ORIGINATED 415 $168,073 5,000 $171,529 11,192 $158,298 438 $54,096 37 $1,330,626 619 $133,997 APPLICATIONS APPROVED, NOT ACCEPTED 45 $155,977 1,020 $167,745 2,113 $162,352 145 $52,624 0 $0 213 $145,677 APPLICATIONS DENIED 78 $167,474 1,211 $161,133 4,290 $158,828 563 $38,416 4 $1,088,900 228 $145,143 APPLICATIONS WITHDRAWN 78 $159,711 972 $187,586 3,364 $163,003 182 $50,107 8 $1,402,250 98 $140,558 FILES CLOSED FOR INCOMPLETENESS 34 $165,426 192 $181,320 696 $159,296 40 $50,028 0 $0 30 $134,427
Aggregated Statistics For Year 2002(Based on 4 full and 1 partial tracts) A) FHA, FSA/RHS & VA B) Conventional C) Refinancings D) Home Improvement Loans E) Loans on Dwellings For 5+ Families F) Non-occupant Loans on Number Average Value Number Average Value Number Average Value Number Average Value Number Average Value Number Average Value
LOANS ORIGINATED 206 $130,793 355 $96,939 828 $107,492 36 $30,664 21 $566,220 101 $99,500 APPLICATIONS APPROVED, NOT ACCEPTED 22 $123,501 86 $106,509 176 $103,857 13 $32,658 1 $281,000 18 $115,006 APPLICATIONS DENIED 40 $111,295 165 $94,958 415 $108,336 72 $23,519 3 $1,333,333 27 $96,570 APPLICATIONS WITHDRAWN 28 $108,826 80 $107,120 291 $112,273 28 $40,888 1 $360,000 18 $96,308 FILES CLOSED FOR INCOMPLETENESS 9 $124,270 29 $88,850 107 $106,867 0 $0 1 $3,600,000 9 $75,506
Aggregated Statistics For Year 2001(Based on 4 full and 1 partial tracts) A) FHA, FSA/RHS & VA B) Conventional C) Refinancings D) Home Improvement Loans E) Loans on Dwellings For 5+ Families F) Non-occupant Loans on Number Average Value Number Average Value Number Average Value Number Average Value Number Average Value Number Average Value
LOANS ORIGINATED 315 $113,832 256 $83,561 607 $98,225 35 $18,178 14 $704,963 96 $99,326 APPLICATIONS APPROVED, NOT ACCEPTED 24 $109,575 56 $80,695 90 $90,453 7 $28,803 0 $0 14 $99,402 APPLICATIONS DENIED 55 $112,637 121 $75,812 391 $90,669 98 $16,930 3 $574,000 51 $80,413 APPLICATIONS WITHDRAWN 41 $114,734 57 $97,704 235 $103,650 22 $28,904 1 $191,000 17 $105,642 FILES CLOSED FOR INCOMPLETENESS 7 $96,767 16 $69,588 53 $99,815 2 $17,985 2 $673,000 7 $77,863
Aggregated Statistics For Year 2000(Based on 4 full and 1 partial tracts) A) FHA, FSA/RHS & VA B) Conventional C) Refinancings D) Home Improvement Loans E) Loans on Dwellings For 5+ Families F) Non-occupant Loans on Number Average Value Number Average Value Number Average Value Number Average Value Number Average Value Number Average Value
LOANS ORIGINATED 345 $105,464 177 $73,453 157 $74,397 27 $30,197 15 $1,315,273 49 $63,869 APPLICATIONS APPROVED, NOT ACCEPTED 45 $101,149 38 $70,262 47 $73,349 24 $25,870 1 $570,000 15 $62,165 APPLICATIONS DENIED 73 $110,116 127 $70,732 210 $70,456 67 $15,827 4 $1,259,230 23 $81,200 APPLICATIONS WITHDRAWN 40 $106,946 54 $82,142 89 $71,512 7 $25,613 2 $2,037,500 14 $81,873 FILES CLOSED FOR INCOMPLETENESS 15 $88,464 8 $87,642 33 $87,417 2 $116,000 3 $1,161,667 3 $65,000
Aggregated Statistics For Year 1999(Based on 4 full and 11 partial tracts) A) FHA, FSA/RHS & VA B) Conventional C) Refinancings D) Home Improvement Loans E) Loans on Dwellings For 5+ Families F) Non-occupant Loans on Number Average Value Number Average Value Number Average Value Number Average Value Number Average Value Number Average Value
LOANS ORIGINATED 1,683 $120,490 996 $133,233 1,342 $99,799 335 $32,877 37 $273,593 168 $81,177 APPLICATIONS APPROVED, NOT ACCEPTED 90 $114,701 116 $126,750 348 $102,490 234 $24,966 5 $105,410 30 $91,741 APPLICATIONS DENIED 231 $123,573 374 $107,945 1,192 $77,959 540 $21,213 9 $733,469 81 $86,270 APPLICATIONS WITHDRAWN 242 $124,963 260 $128,604 571 $93,534 37 $28,836 9 $264,057 40 $83,667 FILES CLOSED FOR INCOMPLETENESS 36 $123,063 54 $115,561 228 $105,246 4 $22,422 4 $425,900 18 $91,081
Detailed mortgage data for all 21 tracts in Fontana, CA
Private Mortgage Insurance Companies Aggregated Statistics For Year 2009(Based on 11 full and 10 partial tracts) A) Conventional B) Refinancings C) Non-occupant Loans on Number Average Value Number Average Value Number Average Value
LOANS ORIGINATED 136 $217,547 11 $208,584 1 $413,720 APPLICATIONS APPROVED, NOT ACCEPTED 87 $250,268 16 $299,576 0 $0 APPLICATIONS DENIED 32 $233,851 2 $371,795 2 $270,000 APPLICATIONS WITHDRAWN 13 $217,435 4 $239,072 0 $0 FILES CLOSED FOR INCOMPLETENESS 15 $277,889 4 $293,162 1 $327,000
Aggregated Statistics For Year 2008(Based on 11 full and 10 partial tracts) A) Conventional B) Refinancings C) Non-occupant Loans on Number Average Value Number Average Value Number Average Value
LOANS ORIGINATED 489 $290,292 101 $338,895 13 $288,128 APPLICATIONS APPROVED, NOT ACCEPTED 345 $329,007 192 $365,867 8 $324,878 APPLICATIONS DENIED 93 $284,671 27 $317,267 18 $260,957 APPLICATIONS WITHDRAWN 42 $292,910 10 $317,418 8 $233,421 FILES CLOSED FOR INCOMPLETENESS 17 $301,543 9 $347,749 5 $301,726
Aggregated Statistics For Year 2007(Based on 11 full and 10 partial tracts) A) Conventional B) Refinancings C) Non-occupant Loans on Number Average Value Number Average Value Number Average Value
LOANS ORIGINATED 279 $375,224 285 $382,137 11 $386,695 APPLICATIONS APPROVED, NOT ACCEPTED 55 $373,415 101 $391,899 2 $440,355 APPLICATIONS DENIED 21 $420,847 33 $411,193 3 $516,790 APPLICATIONS WITHDRAWN 20 $380,058 34 $406,840 3 $459,633 FILES CLOSED FOR INCOMPLETENESS 2 $475,030 2 $383,600 0 $0
Aggregated Statistics For Year 2006(Based on 11 full and 10 partial tracts) A) Conventional B) Refinancings C) Non-occupant Loans on Number Average Value Number Average Value Number Average Value
LOANS ORIGINATED 72 $418,827 125 $382,710 5 $368,036 APPLICATIONS APPROVED, NOT ACCEPTED 25 $399,872 65 $366,883 6 $364,687 APPLICATIONS DENIED 2 $454,520 12 $457,032 2 $358,560 APPLICATIONS WITHDRAWN 8 $449,679 19 $368,269 5 $443,600 FILES CLOSED FOR INCOMPLETENESS 0 $0 2 $362,180 0 $0
Aggregated Statistics For Year 2005(Based on 10 full and 10 partial tracts) A) Conventional B) Refinancings C) Non-occupant Loans on Number Average Value Number Average Value Number Average Value
LOANS ORIGINATED 128 $340,253 124 $328,886 9 $295,903 APPLICATIONS APPROVED, NOT ACCEPTED 31 $313,797 40 $304,803 2 $219,920 APPLICATIONS DENIED 2 $356,500 9 $398,513 0 $0 APPLICATIONS WITHDRAWN 9 $311,309 19 $335,194 2 $209,000 FILES CLOSED FOR INCOMPLETENESS 2 $337,000 1 $270,000 0 $0
Aggregated Statistics For Year 2004(Based on 11 full and 10 partial tracts) A) Conventional B) Refinancings C) Non-occupant Loans on Number Average Value Number Average Value Number Average Value
LOANS ORIGINATED 327 $266,147 185 $235,333 31 $231,128 APPLICATIONS APPROVED, NOT ACCEPTED 130 $237,365 140 $218,168 10 $189,261 APPLICATIONS DENIED 6 $311,467 5 $249,102 2 $222,000 APPLICATIONS WITHDRAWN 31 $284,760 30 $220,331 5 $254,352 FILES CLOSED FOR INCOMPLETENESS 8 $249,738 9 $198,316 0 $0
Aggregated Statistics For Year 2003(Based on 11 full and 10 partial tracts) A) Conventional B) Refinancings C) Non-occupant Loans on Number Average Value Number Average Value Number Average Value
LOANS ORIGINATED 1,088 $218,605 690 $185,276 39 $168,830 APPLICATIONS APPROVED, NOT ACCEPTED 240 $218,183 270 $198,071 15 $180,325 APPLICATIONS DENIED 18 $203,289 17 $195,927 4 $150,552 APPLICATIONS WITHDRAWN 42 $231,305 47 $197,991 5 $282,484 FILES CLOSED FOR INCOMPLETENESS 0 $0 2 $151,600 0 $0
Aggregated Statistics For Year 2002(Based on 4 full and 1 partial tracts) A) Conventional B) Refinancings C) Non-occupant Loans on Number Average Value Number Average Value Number Average Value
LOANS ORIGINATED 106 $130,439 55 $129,551 7 $133,286 APPLICATIONS APPROVED, NOT ACCEPTED 16 $138,238 21 $114,492 3 $100,013 APPLICATIONS DENIED 1 $57,000 2 $92,030 1 $57,000 APPLICATIONS WITHDRAWN 4 $122,805 4 $122,382 0 $0 FILES CLOSED FOR INCOMPLETENESS 1 $82,000 1 $106,000 0 $0
Aggregated Statistics For Year 2001(Based on 4 full and 1 partial tracts) A) Conventional B) Refinancings C) Non-occupant Loans on Number Average Value Number Average Value Number Average Value
LOANS ORIGINATED 72 $101,511 53 $113,821 5 $90,800 APPLICATIONS APPROVED, NOT ACCEPTED 18 $86,801 14 $110,636 5 $68,696 APPLICATIONS DENIED 10 $107,751 4 $107,232 2 $94,000 APPLICATIONS WITHDRAWN 7 $110,000 2 $86,000 1 $60,000 FILES CLOSED FOR INCOMPLETENESS 2 $104,000 1 $126,000 0 $0
Aggregated Statistics For Year 2000(Based on 4 full and 1 partial tracts) A) Conventional B) Refinancings C) Non-occupant Loans on Number Average Value Number Average Value Number Average Value
LOANS ORIGINATED 60 $95,570 12 $99,883 16 $59,210 APPLICATIONS APPROVED, NOT ACCEPTED 10 $74,608 4 $77,395 4 $53,750 APPLICATIONS DENIED 3 $89,000 4 $84,250 1 $37,000 APPLICATIONS WITHDRAWN 5 $78,992 0 $0 0 $0 FILES CLOSED FOR INCOMPLETENESS 2 $45,500 0 $0 0 $0
Aggregated Statistics For Year 1999(Based on 4 full and 11 partial tracts) A) Conventional B) Refinancings C) Non-occupant Loans on Number Average Value Number Average Value Number Average Value
LOANS ORIGINATED 328 $151,729 187 $132,302 16 $101,786 APPLICATIONS APPROVED, NOT ACCEPTED 35 $150,470 45 $135,745 2 $95,165 APPLICATIONS DENIED 30 $136,177 19 $127,175 3 $113,060 APPLICATIONS WITHDRAWN 9 $147,010 10 $102,041 2 $80,270 FILES CLOSED FOR INCOMPLETENESS 2 $164,295 2 $146,810 0 $0
Fire-safe hotels and motels in Fontana, California:
Americas Best Value Inn & Suites, 16780 Valley Blvd, Fontana, California 92335 Phone: (909) 822-3350, Fax: (909) 822-0337
Circle Inn Motel, 10227 Cherry Ave, Fontana, California 92335 Phone: (909) 822-9400
Comfort Inn, 13500 Baseline Ave, Fontana, California 92336 Phone: (909) 463-5900, Fax: (909) 463-0339
Hilton Garden Inn Fontana, 10543 Sierra Ave, Fontana, California 92337 Phone: (909) 822-7300, Fax: (909) 722-7400
All 4 fire-safe hotels and motels in Fontana, California
Most common first names in Fontana, CA among deceased individuals Name Count Lived (average)
John 431 73.2 years Mary 392 77.5 years William 365 72.9 years James 322 69.7 years Robert 257 67.2 years Frank 205 74.7 years Joseph 202 71.5 years Charles 200 70.9 years George 184 73.7 years Maria 149 74.9 years
Most common last names in Fontana, CA among deceased individuals Last name Count Lived (average)
Smith 154 74.6 years Johnson 120 71.2 years Williams 96 72.7 years Garcia 91 70.8 years Jones 78 72.1 years Martinez 72 71.2 years Miller 72 73.3 years Brown 69 71.4 years Davis 64 67.3 years Martin 59 73.5 years
Fontana compared to California state average:
Unemployed percentage below state average. Black race population percentage above state average. Hispanic race population percentage above state average. Foreign-born population percentage above state average. Length of stay since moving in below state average. House age below state average. Fontana, CA compared to other similar cities:
#1 on the list of "Top 101 cities with the highest percentage of family households, population 100,000+"
#16 on the list of "Top 101 cities with largest percentage of males in industries: management of companies and enterprises (population 50,000+)"
#17 on the list of "Top 101 cities with the least people having Doctorate degrees (population 50,000+)"
#21 on the list of "Top 101 cities with largest percentage of males in industries: wholesale trade (population 50,000+)"
#24 on the list of "Top 100 low-educated but high-earning cities (pop. 50,000+)"
#31 on the list of "Top 101 cities with the lowest number of police officers per 1000 residents (population 50,000+)"
#34 on the list of "Top 101 cities with largest percentage of males in occupations: material moving occupations (population 50,000+)"
#44 on the list of "Top 101 cities with largest percentage of males in occupations: health technologists and technicians (population 50,000+)"
#47 on the list of "Top 100 cities with youngest residents (pop. 50,000+)"
#48 on the list of "Top 101 cities with the lowest number of thefts per 100,000 residents (population 50,000+)"
#53 on the list of "Top 101 cities with largest percentage of females in occupations: installation, maintenance, and repair occupations (population 50,000+)"
#53 on the list of "Top 101 cities with the smallest house values disparities (population 50,000+)"
#54 on the list of "Top 101 cities with largest percentage of males in industries: transportation and warehousing (population 50,000+)"
#59 on the list of "Top 101 cities with the largest percentage population increase from 2000 (population 50,000+)"
#60 on the list of "Top 101 cities with the largest percentage of one, detached housing units in structures (20,000+ housing units)"
#62 on the list of "Top 101 cities with the smallest percentage of high school students in private schools (3,000+ students)"
#69 on the list of "Top 101 cities with the lowest percentage of English-only speaking households, population 50,000+"
#70 on the list of "Top 101 larger cities with the highest increase in household income from 2000 (population 50,000+)"
#75 on the list of "Top 101 cities with the smallest percentage of elementary and middle school students in private schools (5,000+ students)"
#76 on the list of "Top 101 cities with the smallest sunshine amount differences during a year (population 50,000+)"
#47 (92337) on the list of "Top 101 zip codes with the lowest 2012 average taxable interest for individuals (pop 5,000+)"
#5 on the list of "Top 101 counties with the highest Nitrogen Dioxide air pollution readings in 2012 (ppm)"
#5 on the list of "Top 101 counties with the highest ground withdrawal of fresh water for public supply"
#10 on the list of "Top 101 counties with the most Evangelical Protestant congregations"
#14 on the list of "Top 101 counties with the highest total withdrawal of fresh water for public supply"
#15 on the list of "Top 101 counties with the most Evangelical Protestant adherents (pop. 50,000+)"
Top Patent Applicants
David Tang (15)
Gary R. Simpson (14)
Anish Patel (11)
Sayandro Versteylen (9)
Philip Carlo J. Deguzman (8)
Hai Yan (6)
Lutz Keller (5)
Kevin O'Leary (4)
Ivan Miramontes (4)
Jesus Perez (4)
Total of 216 patent applications in 2008-2024.
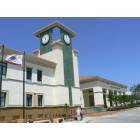
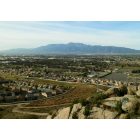
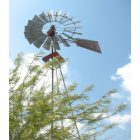
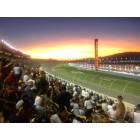
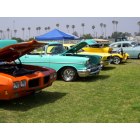
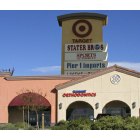
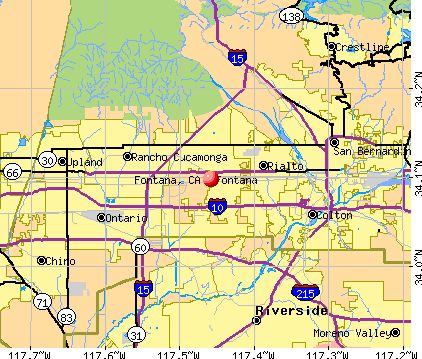


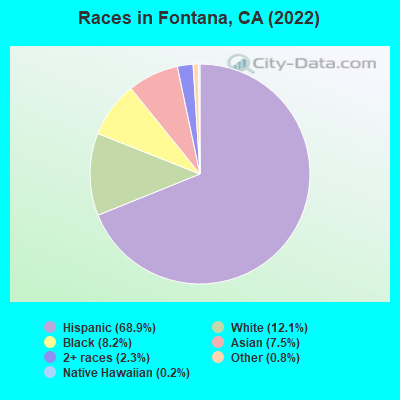
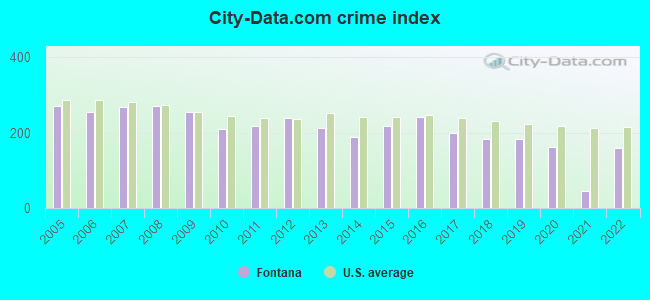
 Recent articles from our blog. Our writers, many of them Ph.D. graduates or candidates, create easy-to-read articles on a wide variety of topics.

 (10.9 miles
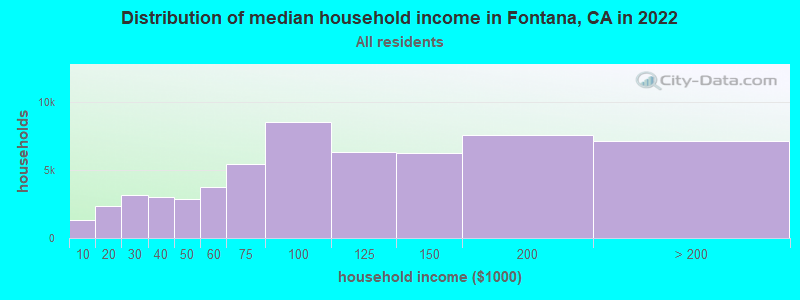
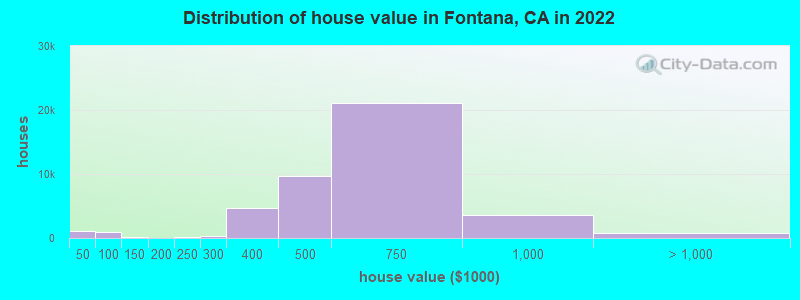
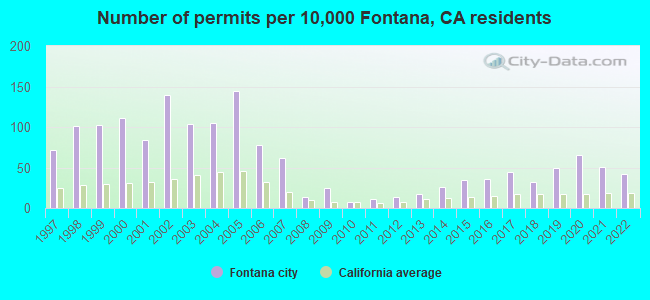
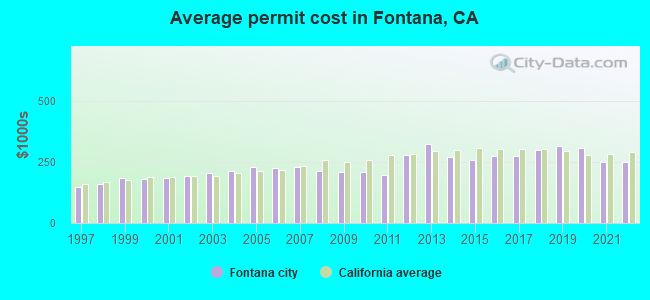
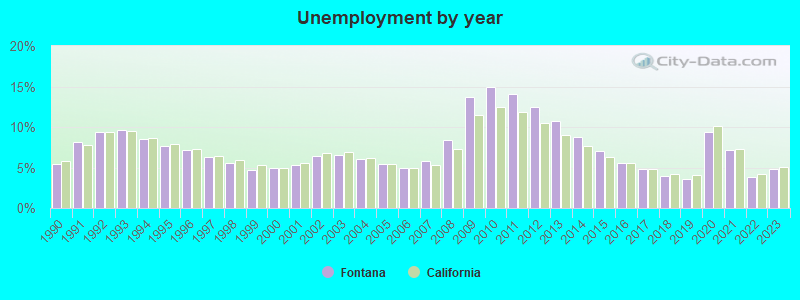
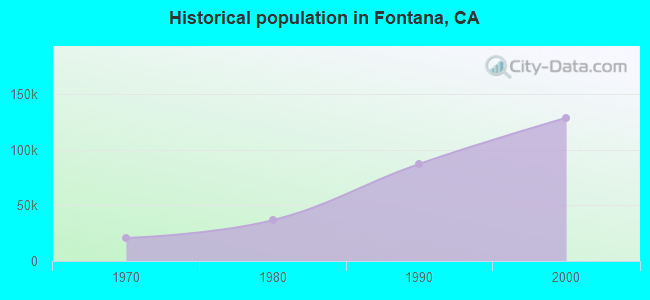
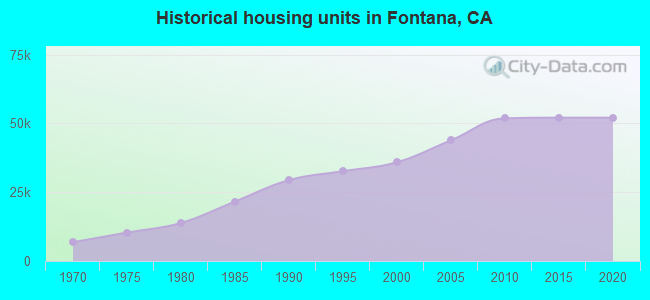
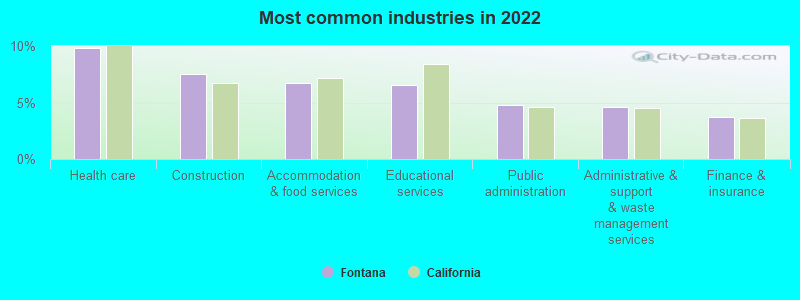
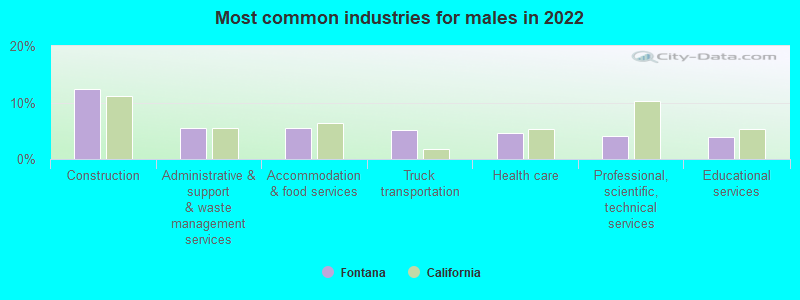
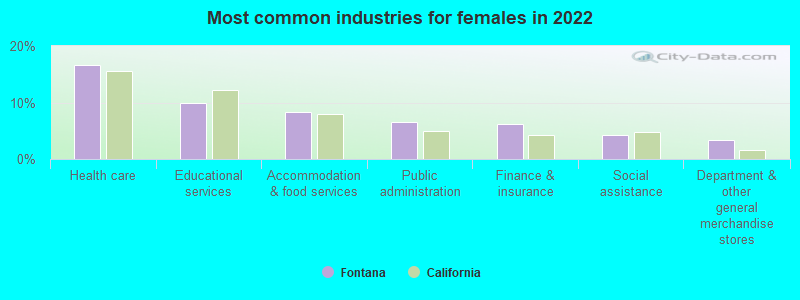
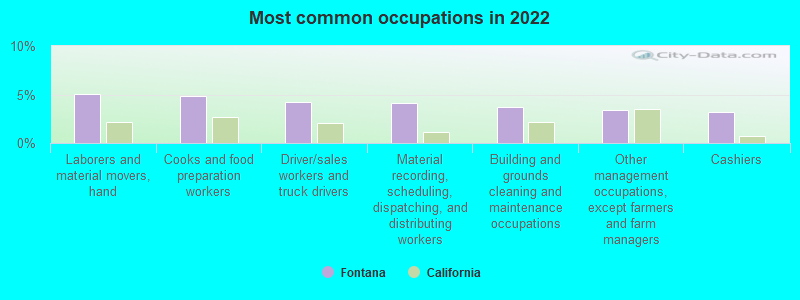
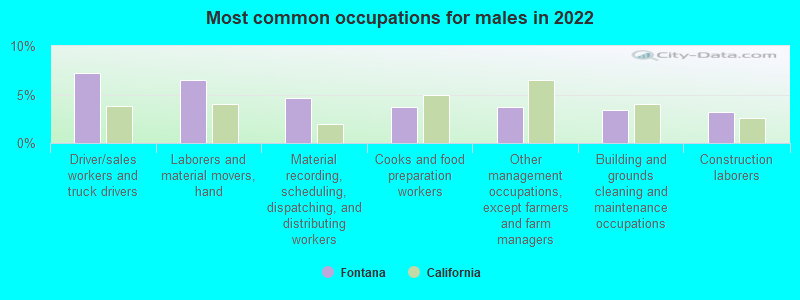
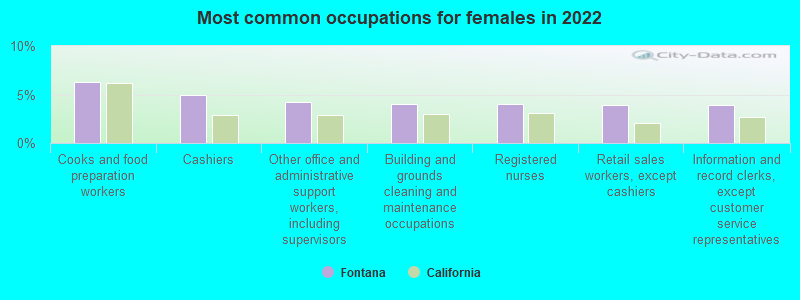


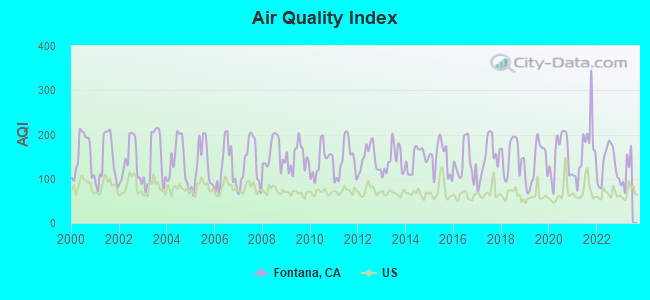
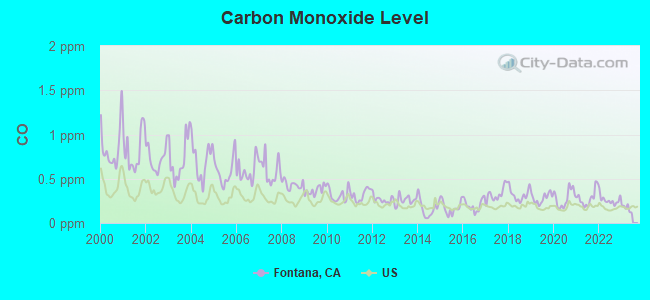
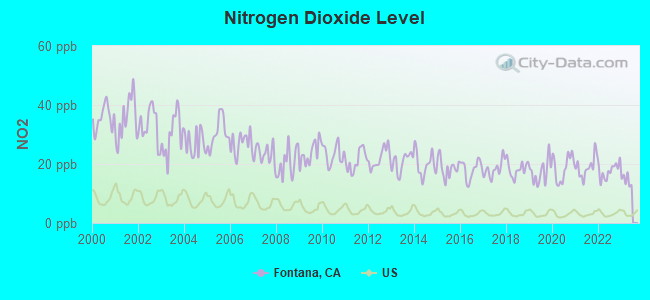
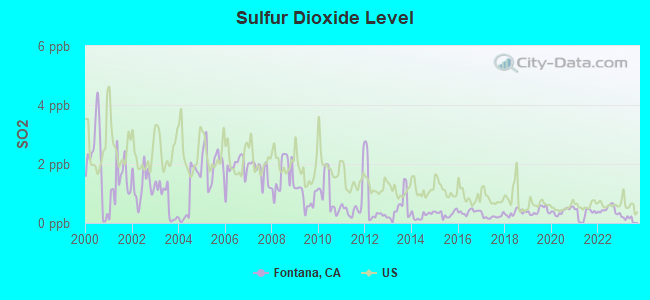
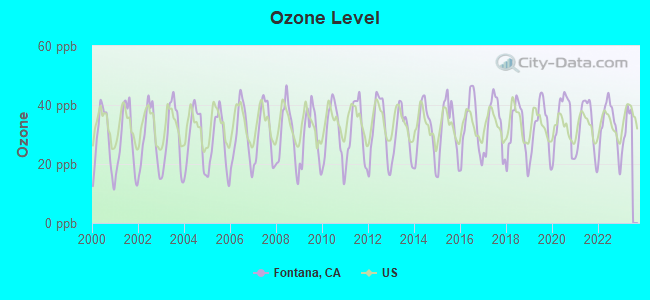
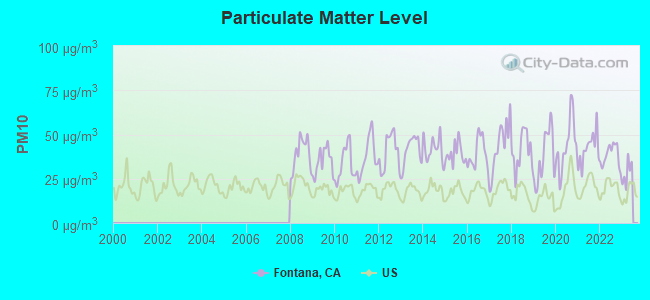
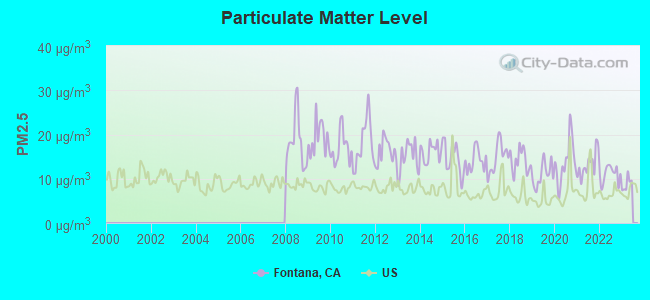
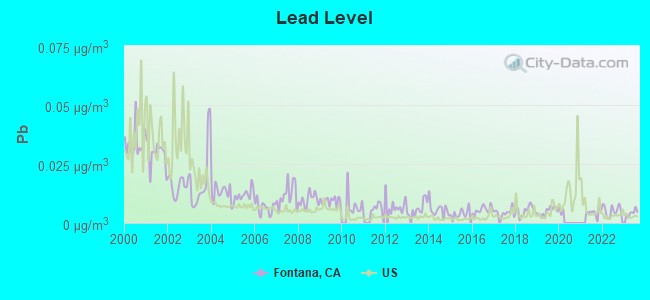
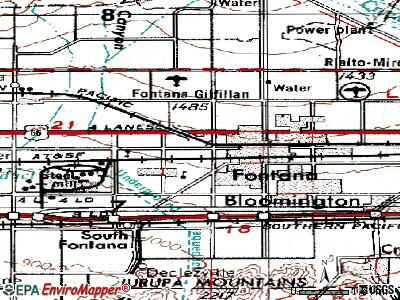
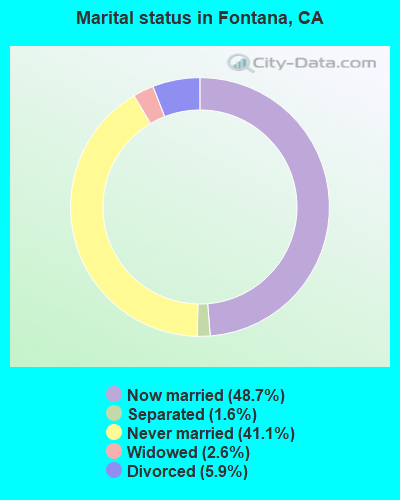
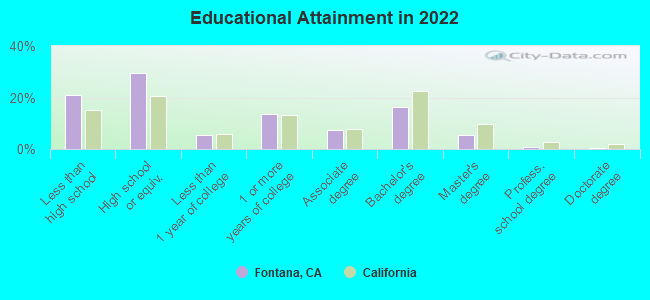
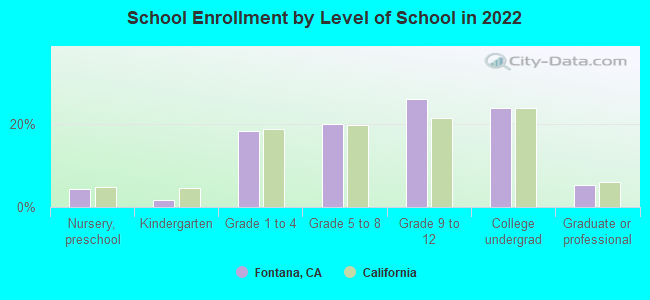
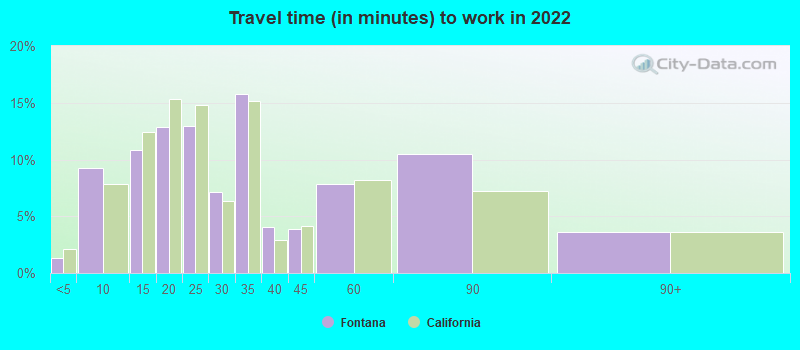
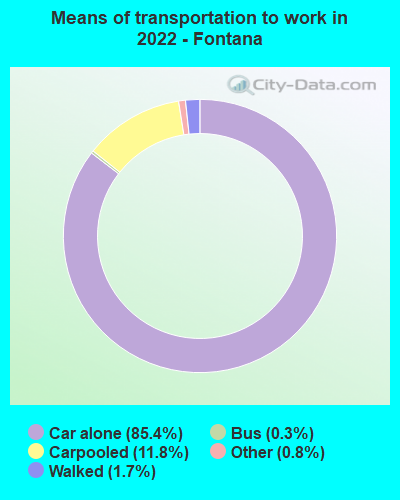
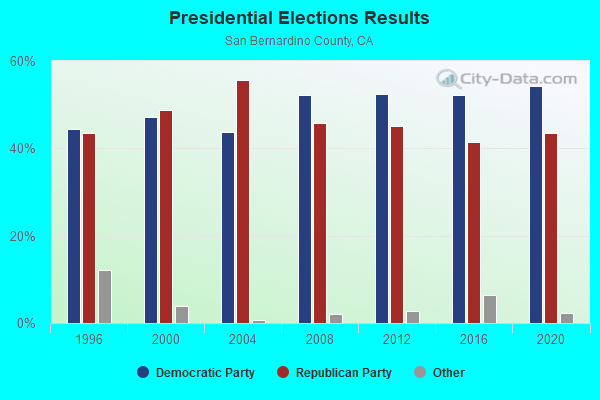
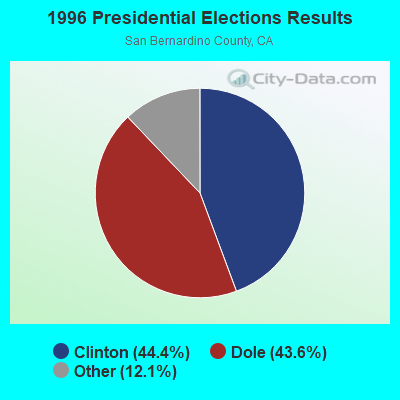
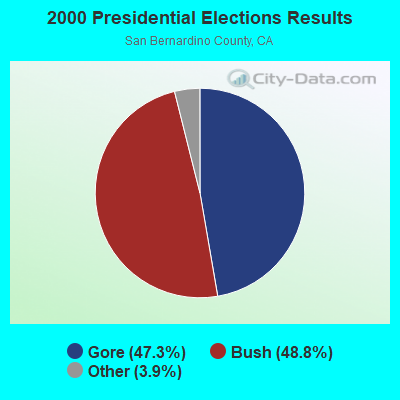
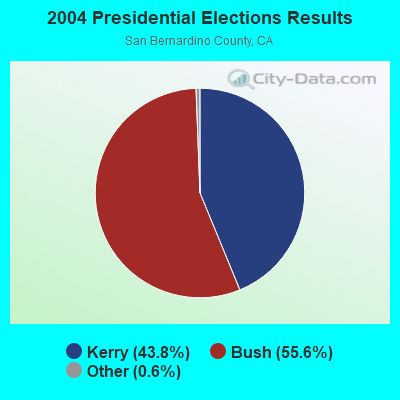
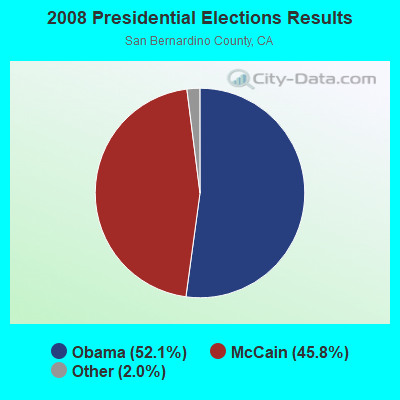
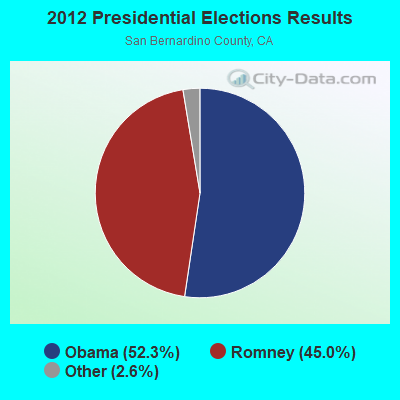
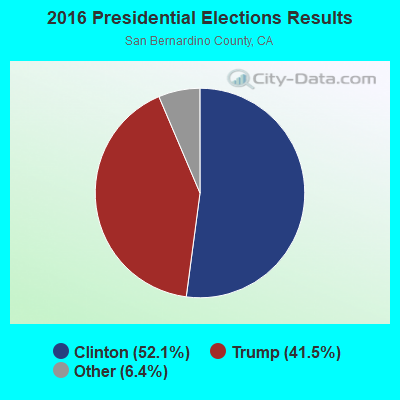
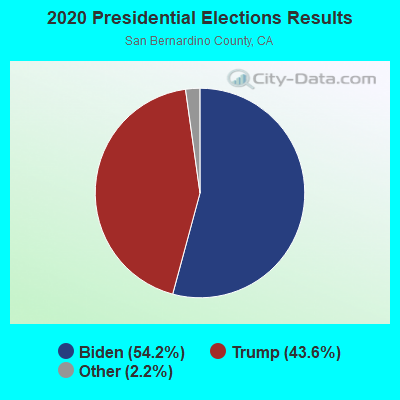
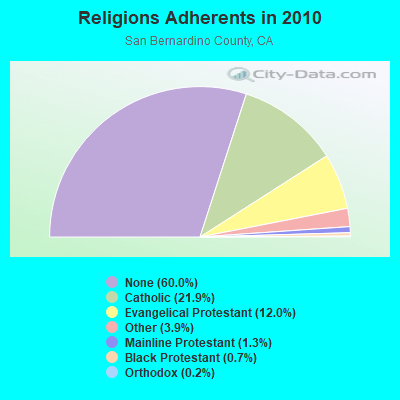
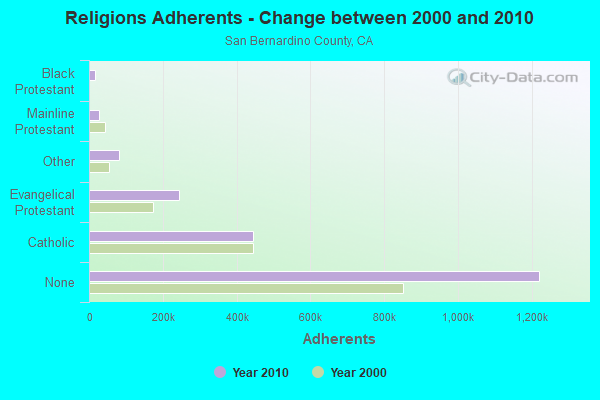
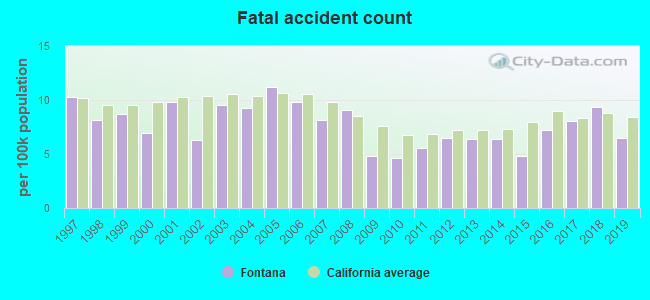
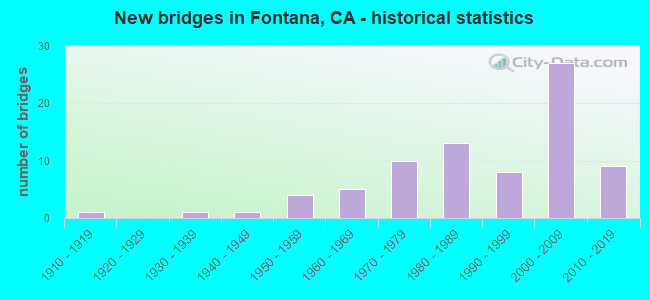
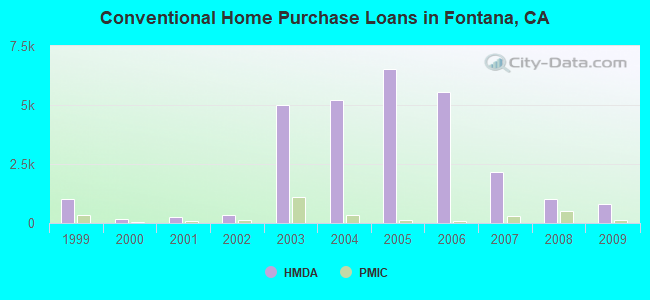
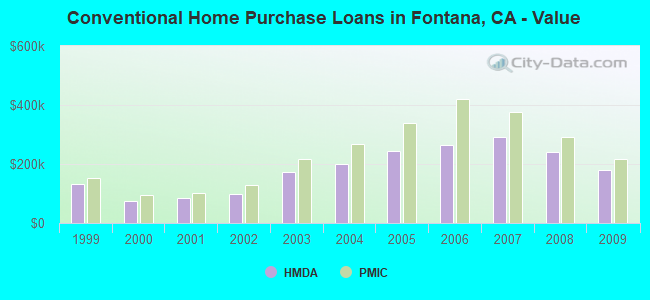
 According to the data from the years 2005 - 2018 the average number of fire incidents per year is 104. The highest number of fires - 379 took place in 2009, and the least - 16 in 2007. The data has a growing trend.
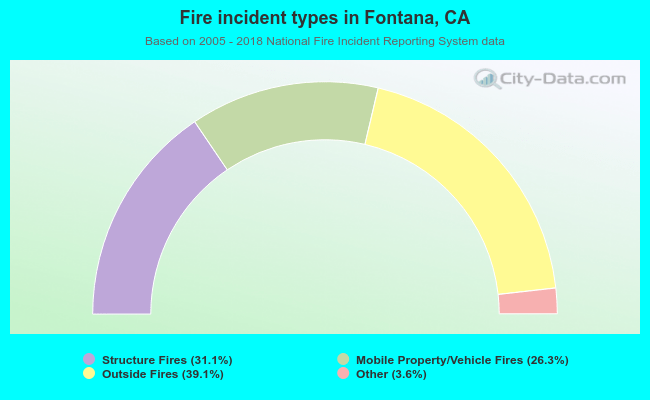 When looking into fire subcategories, the most incidents belonged to: Outside Fires (39.1%), and Structure Fires (31.1%).