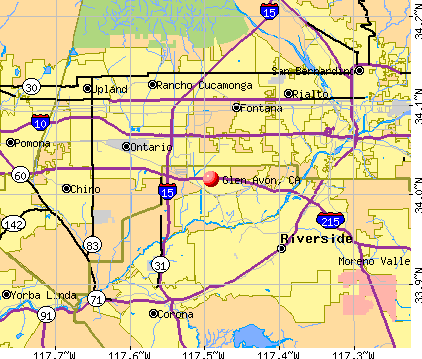
Glen Avon, California

Submit your own pictures of this place and show them to the world
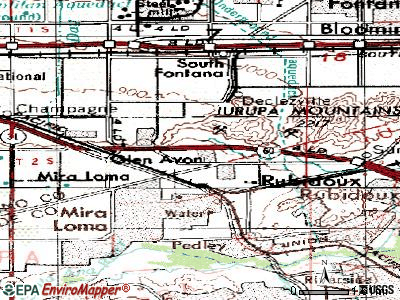
- OSM Map
- General Map
- Google Map
- MSN Map
Population change since 2000: +36.0%
| Males: 10,578 | |
| Females: 9,621 |
| Median resident age: | 31.3 years |
| California median age: | 37.9 years |
Zip codes: 92509.
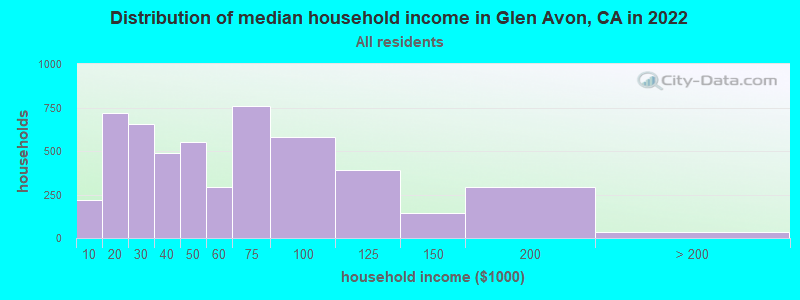
| Glen Avon: | $75,148 |
| CA: | $91,551 |
Estimated per capita income in 2022: $28,359 (it was $14,943 in 2000)
Glen Avon CDP income, earnings, and wages data
Estimated median house or condo value in 2022: $492,866 (it was $119,800 in 2000)
| Glen Avon: | $492,866 |
| CA: | $715,900 |
Mean prices in 2022: all housing units: $586,167; detached houses: $631,165; townhouses or other attached units: $625,082; in 2-unit structures: $464,831; in 3-to-4-unit structures: $482,529; in 5-or-more-unit structures: $526,423; mobile homes: $178,284; occupied boats, rvs, vans, etc.: $86,227
Median gross rent in 2022: $1,554.
(9.9% for White Non-Hispanic residents, 6.2% for Black residents, 15.3% for Hispanic or Latino residents, 12.7% for other race residents, 15.0% for two or more races residents)
Detailed information about poverty and poor residents in Glen Avon, CA


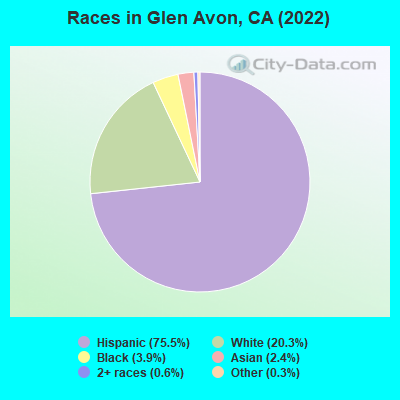
- 17,02775.5%Hispanic
- 4,57120.3%White alone
- 8723.9%Black alone
- 5342.4%Asian alone
- 1440.6%Two or more races
- 580.3%Other race alone
 Recent articles from our blog. Our writers, many of them Ph.D. graduates or candidates, create easy-to-read articles on a wide variety of topics.

 | Highgrove, CA's future and gentrification??? (56 replies) |
| BELLTOWN, California - Please Tell Me All About This Area (14 replies) |
| Best/worst places of the San Bernardino area? (100 replies) |
| Why did you move or going to move to Inland Empire ? (42 replies) |
| Moving From WA, Starting a New Job In Chino, Need help on Places to Live (10 replies) |
| Better part of Eastvale (4 replies) |
Latest news from Glen Avon, CA collected exclusively by city-data.com from local newspapers, TV, and radio stations
Ancestries: German (2.9%), American (2.3%), English (1.6%), Irish (1.4%), Italian (1.0%).
Current Local Time: PST time zone
Elevation: 750 feet
Land area: 7.38 square miles.
Population density: 2,736 people per square mile (average).
5,949 residents are foreign born (25.2% Latin America).
| This place: | 26.4% |
| California: | 100.0% |
Median real estate property taxes paid for housing units with mortgages in 2022: $2,748 (0.9%)
Median real estate property taxes paid for housing units with no mortgage in 2022: $1,018 (1.4%)
Nearest city with pop. 50,000+: Jurupa, CA (1.7 miles  , pop. 85,106).
Nearest city with pop. 200,000+: Riverside, CA (7.3 miles , pop. 255,166).
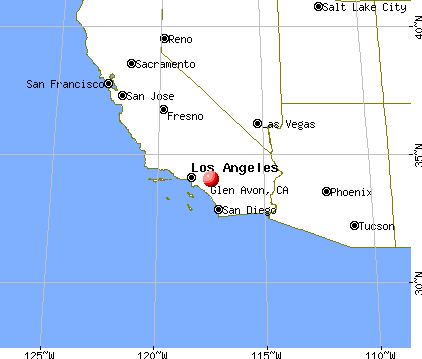
Nearest city with pop. 1,000,000+: Los Angeles, CA (50.9 miles , pop. 3,694,820).
Nearest cities:
), ), ), ), Latitude: 34.02 N, Longitude: 117.49 W
Daytime population change due to commuting: -3,665 (-15.3%)
Workers who live and work in this place: 855 (9.0%)
Area code commonly used in this area: 909
| Here: | 5.2% |
| California: | 5.1% |
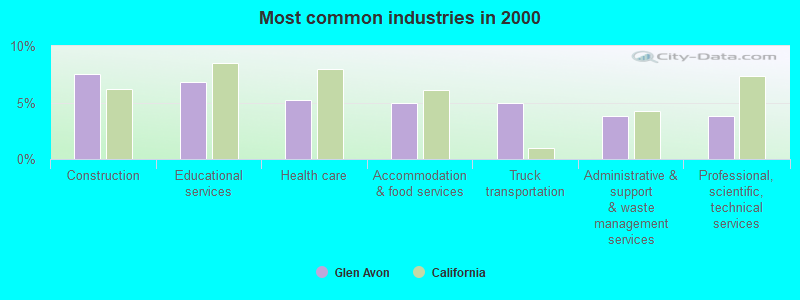
- Construction (7.5%)
- Educational services (6.8%)
- Health care (5.2%)
- Accommodation & food services (5.0%)
- Truck transportation (5.0%)
- Administrative & support & waste management services (3.8%)
- Professional, scientific, technical services (3.8%)
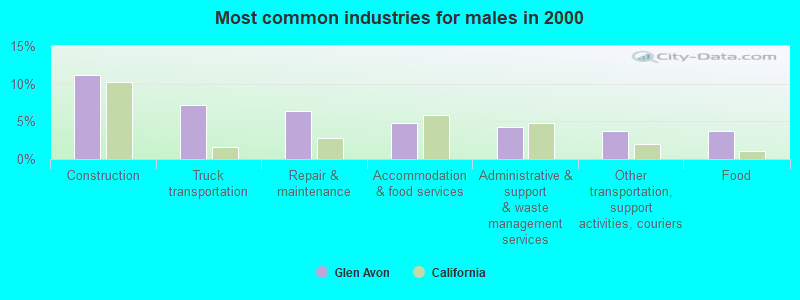
- Construction (11.1%)
- Truck transportation (7.1%)
- Repair & maintenance (6.4%)
- Accommodation & food services (4.8%)
- Administrative & support & waste management services (4.2%)
- Other transportation, support activities, couriers (3.7%)
- Food (3.7%)
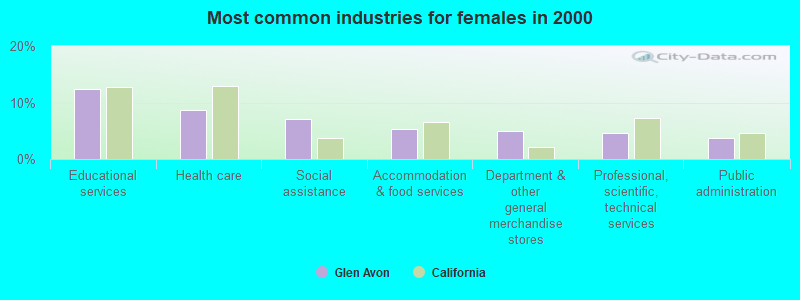
- Educational services (12.3%)
- Health care (8.7%)
- Social assistance (7.0%)
- Accommodation & food services (5.2%)
- Department & other general merchandise stores (4.9%)
- Professional, scientific, technical services (4.6%)
- Public administration (3.7%)
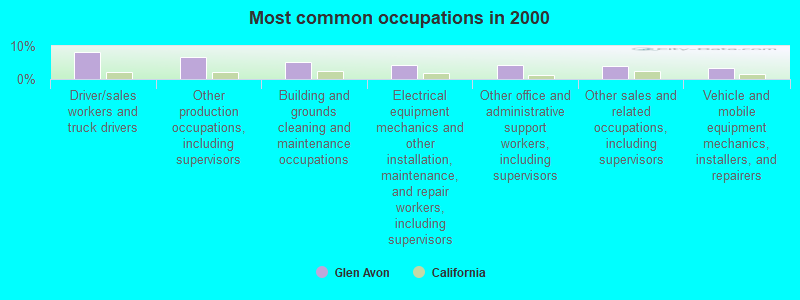
- Driver/sales workers and truck drivers (8.3%)
- Other production occupations, including supervisors (6.5%)
- Building and grounds cleaning and maintenance occupations (5.3%)
- Electrical equipment mechanics and other installation, maintenance, and repair workers, including supervisors (4.3%)
- Other office and administrative support workers, including supervisors (4.1%)
- Other sales and related occupations, including supervisors (3.9%)
- Vehicle and mobile equipment mechanics, installers, and repairers (3.3%)
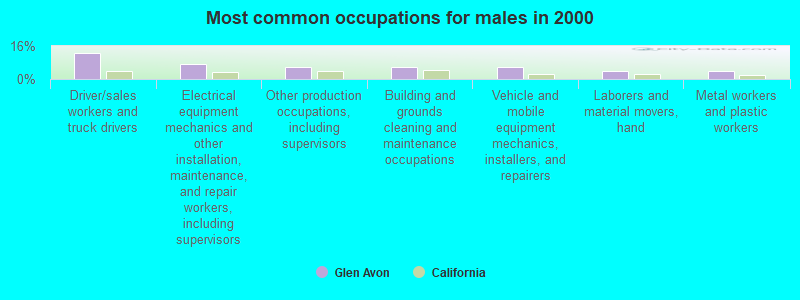
- Driver/sales workers and truck drivers (12.7%)
- Electrical equipment mechanics and other installation, maintenance, and repair workers, including supervisors (7.4%)
- Other production occupations, including supervisors (6.0%)
- Building and grounds cleaning and maintenance occupations (5.9%)
- Vehicle and mobile equipment mechanics, installers, and repairers (5.6%)
- Laborers and material movers, hand (4.1%)
- Metal workers and plastic workers (3.9%)
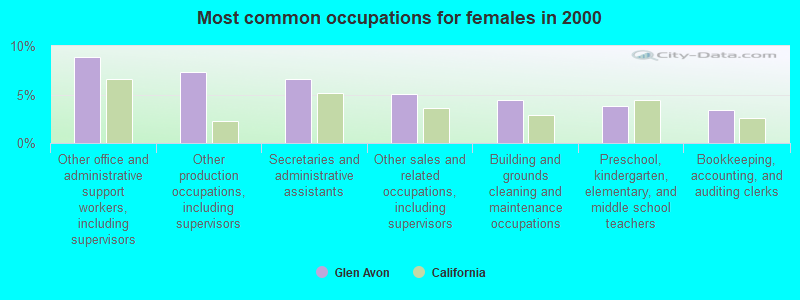
- Other office and administrative support workers, including supervisors (8.8%)
- Other production occupations, including supervisors (7.4%)
- Secretaries and administrative assistants (6.6%)
- Other sales and related occupations, including supervisors (5.1%)
- Building and grounds cleaning and maintenance occupations (4.4%)
- Preschool, kindergarten, elementary, and middle school teachers (3.8%)
- Bookkeeping, accounting, and auditing clerks (3.4%)
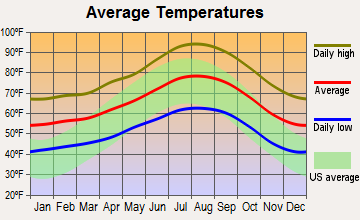
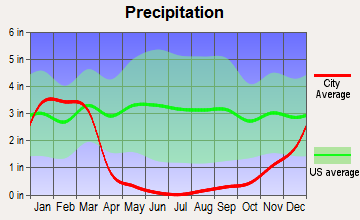
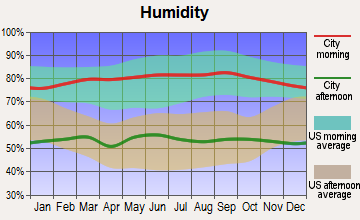
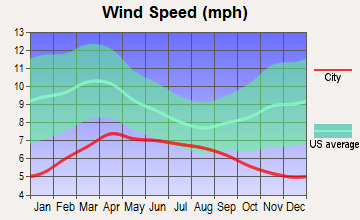
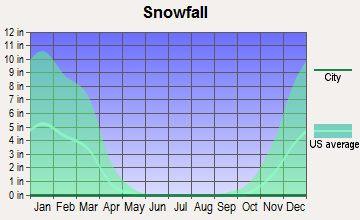
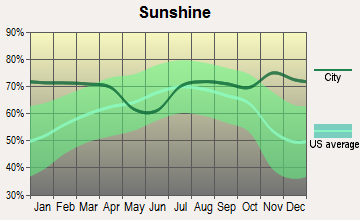
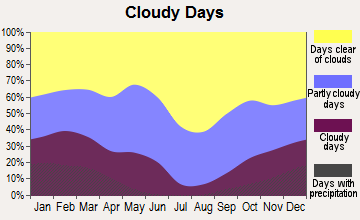
Average climate in Glen Avon, California
Based on data reported by over 4,000 weather stations
|
|

(lower is better)
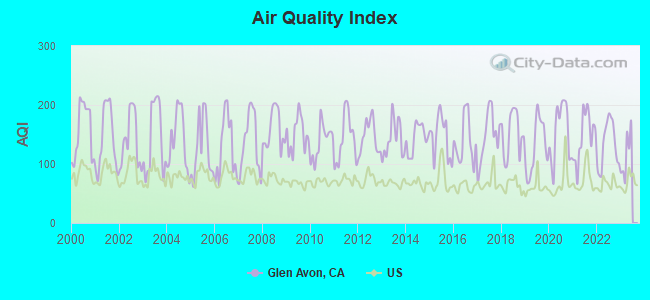
Air Quality Index (AQI) level in 2022 was 133. This is significantly worse than average.
| City: | 133 |
| U.S.: | 73 |
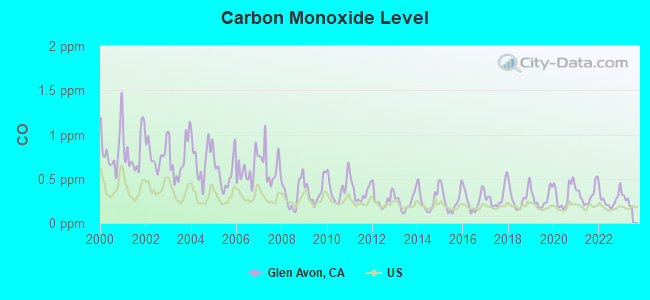
Carbon Monoxide (CO) [ppm] level in 2022 was 0.264. This is about average. Closest monitor was 1.4 miles away from the city center.
| City: | 0.264 |
| U.S.: | 0.251 |
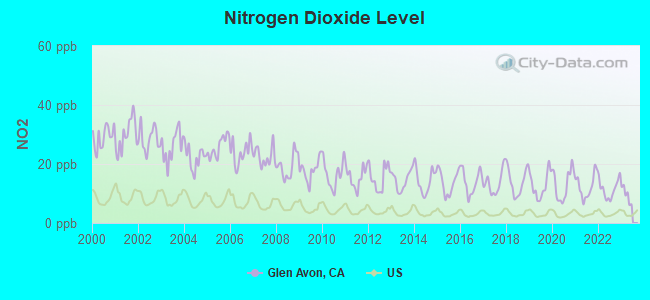
Nitrogen Dioxide (NO2) [ppb] level in 2022 was 11.5. This is significantly worse than average. Closest monitor was 1.4 miles away from the city center.
| City: | 11.5 |
| U.S.: | 5.1 |
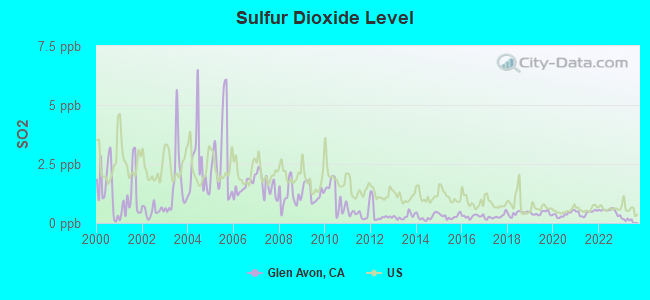
Sulfur Dioxide (SO2) [ppb] level in 2022 was 0.507. This is significantly better than average. Closest monitor was 4.3 miles away from the city center.
| City: | 0.507 |
| U.S.: | 1.515 |
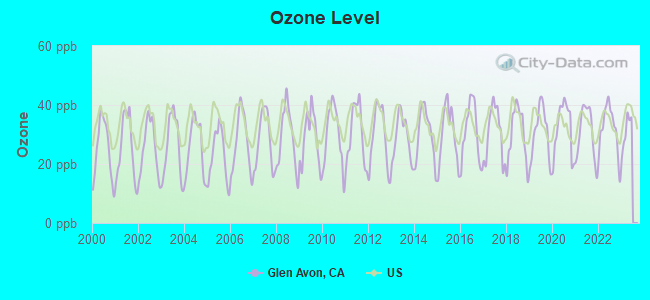
Ozone [ppb] level in 2022 was 31.8. This is about average. Closest monitor was 1.4 miles away from the city center.
| City: | 31.8 |
| U.S.: | 33.3 |
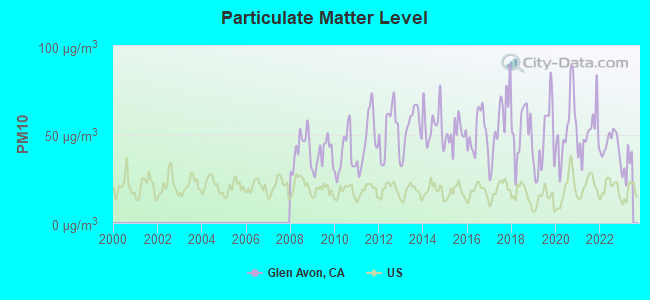
Particulate Matter (PM10) [µg/m3] level in 2022 was 44.6. This is significantly worse than average. Closest monitor was 1.4 miles away from the city center.
| City: | 44.6 |
| U.S.: | 19.2 |
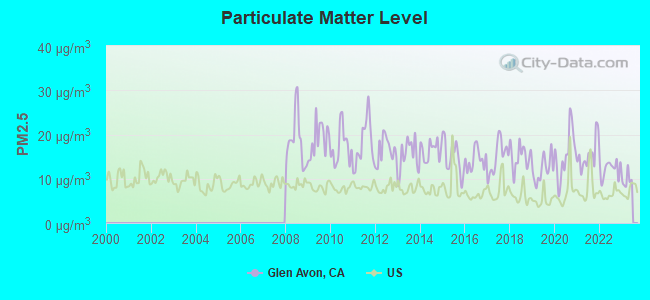
Particulate Matter (PM2.5) [µg/m3] level in 2022 was 12.3. This is significantly worse than average. Closest monitor was 1.4 miles away from the city center.
| City: | 12.3 |
| U.S.: | 8.1 |
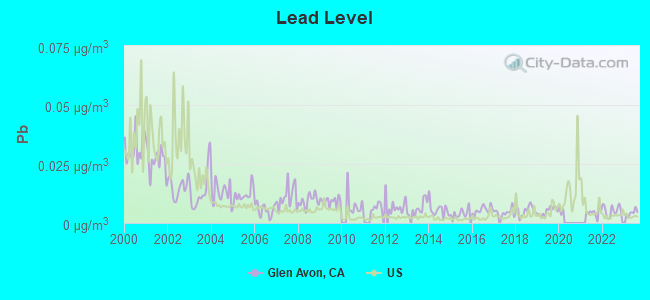
Lead (Pb) [µg/m3] level in 2023 was 0.00426. This is significantly better than average. Closest monitor was 4.3 miles away from the city center.
| City: | 0.00426 |
| U.S.: | 0.00931 |
Earthquake activity:
Glen Avon-area historical earthquake activity is significantly above California state average. It is 7265% greater than the overall U.S. average.On 6/28/1992 at 11:57:34, a magnitude 7.6 (6.2 MB, 7.6 MS, 7.3 MW, Depth: 0.7 mi, Class: Major, Intensity: VIII - XII) earthquake occurred 56.2 miles away from Glen Avon center, causing 3 deaths (1 shaking deaths, 2 other deaths) and 400 injuries, causing $100,000,000 total damage and $40,000,000 insured losses
On 7/21/1952 at 11:52:14, a magnitude 7.7 (7.7 UK) earthquake occurred 109.6 miles away from Glen Avon center, causing $50,000,000 total damage
On 10/16/1999 at 09:46:44, a magnitude 7.4 (6.3 MB, 7.4 MS, 7.2 MW, 7.3 ML) earthquake occurred 69.5 miles away from the city center
On 4/21/1918 at 22:32:30, a magnitude 6.8 (6.8 UK, Class: Strong, Intensity: VII - IX) earthquake occurred 14.5 miles away from the city center
On 5/19/1940 at 04:36:40, a magnitude 7.2 (7.2 UK) earthquake occurred 117.1 miles away from Glen Avon center, causing $33,000,000 total damage
On 6/28/1992 at 15:05:30, a magnitude 6.9 (6.3 MB, 6.7 MS, 6.5 MW, 6.9 ME, Depth: 3.1 mi) earthquake occurred 43.0 miles away from Glen Avon center
Magnitude types: body-wave magnitude (MB), energy magnitude (ME), local magnitude (ML), surface-wave magnitude (MS), moment magnitude (MW)
Natural disasters:
The number of natural disasters in Riverside County (46) is a lot greater than the US average (15).Major Disasters (Presidential) Declared: 27
Emergencies Declared: 1
Causes of natural disasters: Fires: 22, Floods: 20, Storms: 8, Winter Storms: 8, Landslides: 6, Mudslides: 5, Heavy Rains: 2, Earthquake: 1, Flash Flood: 1, Freeze: 1, Hurricane: 1, Tornado: 1, Tropical Storm: 1, Other: 1 (Note: some incidents may be assigned to more than one category).
Hospitals and medical centers near Glen Avon:
- MILLER'S PROGRESSIVE CARE (Nursing Home, about 2 miles away; RIVERSIDE, CA)
- CAMI HOUSE (Hospital, about 2 miles away; RIVERSIDE, CA)
- MAVERICK HOUSE (Hospital, about 3 miles away; RIVERSIDE, CA)
- LAUREL PARK HOUSE (Hospital, about 3 miles away; RIVERSIDE, CA)
- LIFEHOUSE OF RIVERSIDE HEALTHCARE CENTER (Nursing Home, about 4 miles away; RIVERSIDE, CA)
- ACCENTCARE HOME HEALTH OF CALIFORNIA, INC (Home Health Center, about 4 miles away; ONTARIO, CA)
- MT. RUBIDOUX NURSING CENTER (Nursing Home, about 4 miles away; RUBIDOUX, CA)
Amtrak stations near Glen Avon:
- 8 miles: RIVERSIDE (4066 VINE ST.) - Bus Station . Services: fully wheelchair accessible, public payphones, full-service food facilities, free short-term parking, free long-term parking, call for car rental service, call for taxi service, public transit connection.
- 10 miles: ONTARIO (228 S. PLUM ST.) . Services: fully wheelchair accessible, public payphones, vending machines, free short-term parking, call for taxi service.
- 13 miles: SAN BERNADINO (SAN BERNARDINO, 1170 W. 3RD ST.) . Services: ticket office, partially wheelchair accessible, public payphones, free short-term parking, free long-term parking.
Colleges/universities with over 2000 students nearest to Glen Avon:
- Universal Technical Institute of California Inc (about 7 miles; Rancho Cucamonga, CA; Full-time enrollment: 4,158)
- Riverside City College (about 8 miles; Riverside, CA; FT enrollment: 10,661)
- California Baptist University (about 8 miles; Riverside, CA; FT enrollment: 6,085)
- La Sierra University (about 8 miles; Riverside, CA; FT enrollment: 2,205)
- Norco College (about 9 miles; Norco, CA; FT enrollment: 4,916)
- University of California-Riverside (about 10 miles; Riverside, CA; FT enrollment: 20,647)
- Chaffey College (about 11 miles; Rancho Cucamonga, CA; FT enrollment: 10,496)
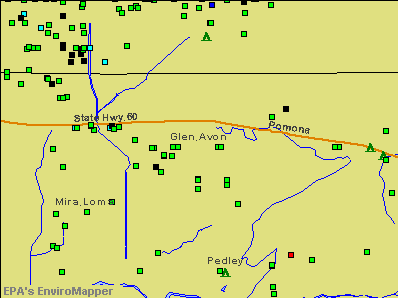
Points of interest:
Notable locations in Glen Avon: Country Village Golf Course (A), Riverside County Fire Department Station 17 Glen Avon (B), Glen Avon Branch Riverside City and County Public Library (C), The Church of Jesus Christ of Latter Day Saints Jurupa Library (D), Riverside County Library (E). Display/hide their locations on the map
Shopping Center: Glen Avon Market Shopping Center (1). Display/hide its location on the map
Churches in Glen Avon include: Vision Plus Ministries (A), Glen Avon Church (B), The Church of Jesus Christ of Latter Day Saints (C), Faith Community Church (D), Grace Baptist Mission (E), Grace Evangelical Lutheran Church (F), Living Light Church of God (G), Sacred Heart Church (H), Sikh Temple (I). Display/hide their locations on the map
Park in Glen Avon: Boulder Hill Park (1). Display/hide its location on the map
| This place: | 3.5 people |
| California: | 2.9 people |
| This place: | 73.2% |
| Whole state: | 68.7% |
| This place: | 7.7% |
| Whole state: | 7.2% |
Likely homosexual households (counted as self-reported same-sex unmarried-partner households)
- Lesbian couples: 0.4% of all households
- Gay men: 0.3% of all households
People in group quarters in Glen Avon in 2010:
- 67 people in nursing facilities/skilled-nursing facilities
- 17 people in group homes intended for adults
- 7 people in group homes for juveniles (non-correctional)
- 5 people in residential treatment centers for adults
- 2 people in workers' group living quarters and job corps centers
People in group quarters in Glen Avon in 2000:
- 68 people in nursing homes
- 18 people in homes for the mentally retarded
- 18 people in other group homes
- 6 people in homes for the mentally ill
For population 15 years and over in Glen Avon:
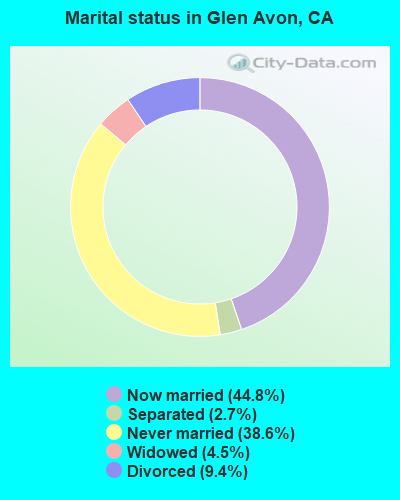
- Never married: 38.6%
- Now married: 44.8%
- Separated: 2.7%
- Widowed: 4.5%
- Divorced: 9.4%
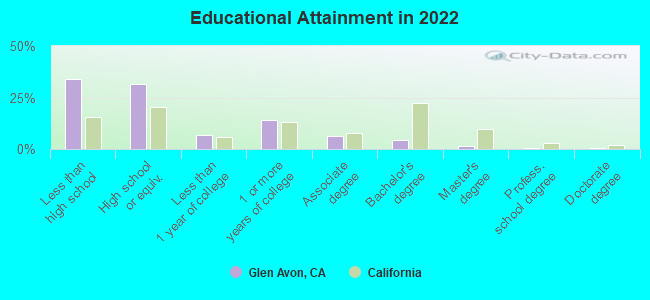
For population 25 years and over in Glen Avon:
- High school or higher: 60.6%
- Bachelor's degree or higher: 5.5%
- Graduate or professional degree: 2.0%
- Unemployed: 8.0%
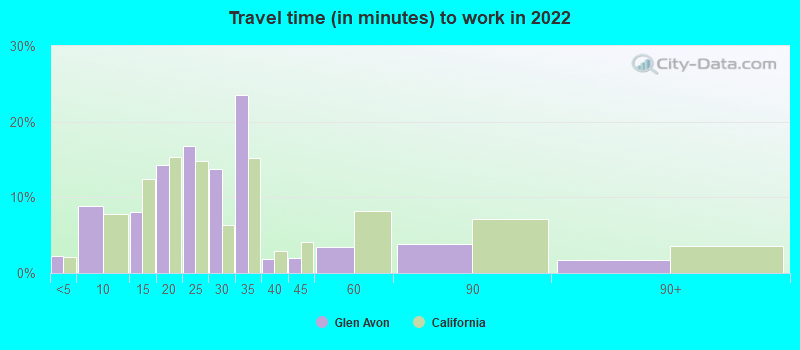
- Mean travel time to work (commute): 29.8 minutes
| Here: | 17.5 |
| California average: | 15.5 |


Graphs represent county-level data. Detailed 2008 Election Results
Religion statistics for Glen Avon, CA (based on Riverside County data)


| Religion | Adherents | Congregations |
|---|---|---|
| Catholic | 602,765 | 51 |
| Evangelical Protestant | 240,306 | 741 |
| Other | 77,581 | 194 |
| Mainline Protestant | 29,535 | 103 |
| Black Protestant | 19,170 | 40 |
| Orthodox | 3,647 | 11 |
| None | 1,216,637 | - |
Food Environment Statistics:
| Riverside County: | 1.60 / 10,000 pop. |
| California: | 2.14 / 10,000 pop. |
| This county: | 0.05 / 10,000 pop. |
| California: | 0.04 / 10,000 pop. |
| Riverside County: | 0.44 / 10,000 pop. |
| California: | 0.62 / 10,000 pop. |
| Riverside County: | 1.51 / 10,000 pop. |
| California: | 1.49 / 10,000 pop. |
| Riverside County: | 5.45 / 10,000 pop. |
| California: | 7.42 / 10,000 pop. |
| Here: | 7.7% |
| California: | 7.3% |
| This county: | 24.5% |
| California: | 21.3% |
| Riverside County: | 15.2% |
| California: | 17.9% |
7.19% of this county's 2021 resident taxpayers lived in other counties in 2020 ($71,521 average adjusted gross income)
| Here: | 7.19% |
| California average: | 5.19% |
0.03% of residents moved from foreign countries ($210 average AGI)
Riverside County: 0.03% California average: 0.03%
Top counties from which taxpayers relocated into this county between 2020 and 2021:
| from Los Angeles County, CA | |
| from San Bernardino County, CA | |
| from Orange County, CA |
6.28% of this county's 2020 resident taxpayers moved to other counties in 2021 ($64,593 average adjusted gross income)
| Here: | 6.28% |
| California average: | 6.14% |
0.02% of residents moved to foreign countries ($200 average AGI)
Riverside County: 0.02% California average: 0.02%
Top counties to which taxpayers relocated from this county between 2020 and 2021:
| to San Bernardino County, CA | |
| to Los Angeles County, CA | |
| to Orange County, CA |
Strongest AM radio stations in Glen Avon:
- KPLS (830 AM; 50 kW; ORANGE, CA; Owner: CRN LICENSES, LLC)
- KLAC (570 AM; 50 kW; LOS ANGELES, CA; Owner: AMFM RADIO LICENSES, L.L.C.)
- KSPA (1510 AM; 10 kW; ONTARIO, CA; Owner: ONTARIO BROADCASTING, LLC)
- KFI (640 AM; 50 kW; LOS ANGELES, CA; Owner: CAPSTAR TX LIMITED PARTNERSHIP)
- KTNQ (1020 AM; 50 kW; LOS ANGELES, CA; Owner: KTNQ-AM LICENSE CORP.)
- KXTA (1150 AM; 50 kW; LOS ANGELES, CA; Owner: CITICASTERS LICENSES, L.P.)
- KDIS (1110 AM; 50 kW; PASADENA, CA; Owner: ABC,INC.)
- KPRO (1570 AM; 5 kW; RIVERSIDE, CA; Owner: OLIVE L. SHERBAN)
- KWRM (1370 AM; 5 kW; CORONA, CA; Owner: MAJOR MARKET STATIONS, INC.)
- KFWB (980 AM; 50 kW; LOS ANGELES, CA; Owner: INFINITY BROADCASTING OPERATIONS, INC.)
- KTDD (1350 AM; 5 kW; SAN BERNARDINO, CA)
- KSPN (710 AM; 50 kW; LOS ANGELES, CA; Owner: KABC-AM RADIO, INC.)
- KRLH (590 AM; 2 kW; SAN BERNARDINO, CA; Owner: CARON BROADCASTING, INC.)
Strongest FM radio stations in Glen Avon:
- KOLA (99.9 FM; SAN BERNARDINO, CA; Owner: INLAND EMPIRE BROADCASTING CORP.)
- KUCR (88.3 FM; RIVERSIDE, CA; Owner: THE REGENTS OF THE UNIV. OF CA)
- KVCR (91.9 FM; SAN BERNARDINO, CA; Owner: SAN BERNARDINO COMMUNITY COLLEGE DISTRICT)
- KUOR-FM (89.1 FM; REDLANDS, CA; Owner: UNIVERSITY OF REDLANDS)
- K264AF (100.7 FM; GUASTI, CA; Owner: EDUCATIONAL MEDIA FOUNDATION)
- K295AI (106.9 FM; MUSCOY, CA; Owner: ASSOCIATION FOR COMMUNITY EDUCATION, INC.)
- KLRD (90.1 FM; YUCAIPA, CA; Owner: EDUCATIONAL MEDIA FOUNDATION)
- KCXX (103.9 FM; LAKE ARROWHEAD, CA; Owner: ALL-PRO BROADCASTING, INC.)
- KCBS-FM (93.1 FM; LOS ANGELES, CA; Owner: INFINITY BROADCASTING OPERATIONS, INC.)
- KWVE (107.9 FM; SAN CLEMENTE, CA; Owner: CALVARY CHAPEL OF COSTA MESA)
- KSCA (101.9 FM; GLENDALE, CA; Owner: HBC LICENSE CORPORATION)
- KLOS (95.5 FM; LOS ANGELES, CA; Owner: KLOS-FM RADIO, INC.)
- K212FA (90.3 FM; TEMPLE CITY, CA; Owner: EDUCATIONAL MEDIA FOUNDATION)
- KOST (103.5 FM; LOS ANGELES, CA; Owner: CAPSTAR TX LIMITED PARTNERSHIP)
- KLVE (107.5 FM; LOS ANGELES, CA; Owner: KLVE-FM LICENSE CORP.)
- KIIS-FM (102.7 FM; LOS ANGELES, CA; Owner: CITICASTERS LICENSES, L.P.)
- KGGI (99.1 FM; RIVERSIDE, CA; Owner: AMFM RADIO LICENSES, L.L.C.)
- KLYY (97.5 FM; RIVERSIDE, CA; Owner: ENTRAVISION HOLDINGS, LLC)
- K201CD (88.1 FM; VICTORVILLE, CA; Owner: SAN BERNARDINO COMMNTY COLLEGE DIST.)
- KPCC (89.3 FM; PASADENA, CA; Owner: PASADENA AREA COMMUNITY COLLEGE DISTRICT)
TV broadcast stations around Glen Avon:
- KTRO-LP (Channel 50; LANCASTER, CA; Owner: ROBERT D. ADELMAN)
- KHIZ (Channel 64; BARSTOW, CA; Owner: SUNBELT TELEVISION, INC.)
- KCBS-TV (Channel 2; LOS ANGELES, CA; Owner: CBS BROADCASTING INC.)
- KVCR-TV (Channel 24; SAN BERNARDINO, CA; Owner: SAN BERNARDINO COMMUNITY COLLEGE DISTRICT)
- KRCA (Channel 62; RIVERSIDE, CA; Owner: KRCA LICENSE CORP.)
- KPXN (Channel 30; SAN BERNARDINO, CA; Owner: PAXSON LOS ANGELES LICENSE, INC.)
- KSGA-LP (Channel 59; SANTA BARBARA, CA; Owner: KJLA, LLC)
- KBLM-LP (Channel 25; RIVERSIDE/PERRIS, CA; Owner: LOUIS MARTINEZ FAMILY GROUP, LLC)
- National Bridge Inventory (NBI) Statistics
- 13Number of bridges
- 98ft / 29.9mTotal length
- 1,041,514Total average daily traffic
- 125,641Total average daily truck traffic
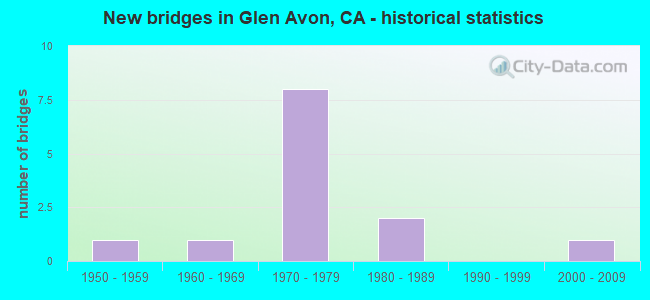
- New bridges - historical statistics
- 11950-1959
- 11960-1969
- 81970-1979
- 21980-1989
- 12000-2009
FCC Registered Antenna Towers:
8 (See the full list of FCC Registered Antenna Towers in Glen Avon)FCC Registered Broadcast Land Mobile Towers:
1- GLENAVONCDF, 10400 San Sevaine Way (Lat: 34.013694 Lon: -117.510667), Type: Building, Structure height: 5.2 m, Overall height: 6.4 m, Call Sign: KVY27,
Assigned Frequencies: 159.285 MHz, 159.360 MHz, Grant Date: 01/20/2023, Expiration Date: 04/19/2033, Registrant: State Of California, 601 Sequoia Pacific Blvd, Sacramento, CA 95811-0231, Phone: (916) 894-5102, Fax: (916) 894-5392, Email:
FCC Registered Microwave Towers:
5- COUNTRY VIL, Country Village Rd And Granite Hill Dr (Lat: 34.019722 Lon: -117.506694), Structure height: 27.4 m, Overall height: 32.3 m, Call Sign: WPOU282,
Assigned Frequencies: 19112.5 MHz, Grant Date: 06/18/1999, Expiration Date: 06/18/2009, Cancellation Date: 04/03/2009, Registrant: Verizon Wireless, 1120 Sanctuary Pkwy, #150 Gasa5reg, Alpharetta, GA 30009-7630, Phone: (770) 797-1070, Fax: (770) 797-1036, Email:
- IE04158A, S By Sw 5.7 Mi Of Fontana, Jurupa Water Tank (Lat: 34.024389 Lon: -117.502861), Type: Upole, Structure height: 16.8 m, Overall height: 18.6 m, Call Sign: WQCH632,
Assigned Frequencies: 18040.0 MHz, 17880.0 MHz, 17965.0 MHz, 18015.0 MHz, 17965.0 MHz, 18015.0 MHz, 17965.0 MHz, 18015.0 MHz, 17965.0 MHz, 18015.0 MHz... (+4 more), Grant Date: 04/28/2015, Expiration Date: 03/07/2025, Certifier: Dan Menser, Registrant: T-Mobile Usa, Inc., 12920 Se 38th Street, Bellevue, WA 98006, Phone: (425) 383-8401, Email:
- GAN, 3300 Conning St (Lat: 34.029194 Lon: -117.498889), Type: Bant, Structure height: 35 m, Call Sign: WQDH912,
Assigned Frequencies: 23325.0 MHz, 19620.0 MHz, 19620.0 MHz, 19620.0 MHz, 19620.0 MHz, 19620.0 MHz, 19620.0 MHz, 19620.0 MHz, 19620.0 MHz, 19620.0 MHz... (+176 more), Grant Date: 09/29/2015, Expiration Date: 08/31/2025, Certifier: Edward West, Registrant: Skyriver Communications, 411 E Clinton Ave, Athens, TX 75751, Phone: (855) 663-7464, Email:
- GLEN AVON, 0.5 Km Ene Of County Club Dr & Bain St (Lat: 34.024333 Lon: -117.503083), Type: Ltower, Structure height: 36.6 m, Overall height: 43 m, Call Sign: WQLV896,
Assigned Frequencies: 10582.5 MHz, 10572.5 MHz, 10582.5 MHz, 10572.5 MHz, Grant Date: 03/12/2020, Expiration Date: 05/06/2030, Certifier: John Sarkissian, Registrant: County Of Riverside, 7195 Alessandro Blvd, Riverside, CA 92506, Phone: (951) 955-0582, Fax: (951) 955-0603, Email:
- GLEN AVON, 9965 Canal St (Lat: 34.029167 Lon: -117.498944), Type: Mast, Structure height: 38.7 m, Call Sign: WLV899,
Assigned Frequencies: 10553.7 MHz, 10571.2 MHz, 10626.2 MHz, 10568.7 MHz, 10571.2 MHz, 10578.7 MHz, 10558.7 MHz, 10551.2 MHz, 19325.0 MHz, 11245.0 MHz... (+11 more), Grant Date: 01/17/2001, Expiration Date: 02/01/2011, Cancellation Date: 08/20/2004, Registrant: Verizon Wireless, One Verizon Place (Mc: Ga3b1reg), Alpharetta, GA 30004-8511, Phone: (678) 339-4269, Fax: (678) 339-8552, Email:
FCC Registered Paging Towers:
1- 9965 Canal Street (Lat: 34.029167 Lon: -117.498917), Overall height: 48.2 m, Call Sign: KNKJ924,
Assigned Frequencies: 931.062 MHz, Grant Date: 04/23/2019, Expiration Date: 04/01/2029, Certifier: J. Roy Pottle, Registrant: Wilkinson Barker Knauer, LLP, 1800 M Street, N.W., Suite 800n, Washington, DC 20036, Phone: (202) 783-4141, Fax: (202) 783-5851, Email:
FCC Registered Amateur Radio Licenses:
3- Call Sign: KC6KHI, Grant Date: 04/17/1990, Expiration Date: 04/17/2000, Cancellation Date: 04/18/2002, Registrant: James L Stewart, 8394 Donna Way, Glen Avon, CA 92509
- Call Sign: KD6GZF, Licensee ID: L00487497, Grant Date: 03/21/2002, Expiration Date: 03/21/2012, Cancellation Date: 04/29/2011, Registrant: Judy A Henigin, 8842 45th St, Glen Avon, CA 92509
- Call Sign: KF6RLV, Licensee ID: L00960321, Grant Date: 06/11/1998, Expiration Date: 06/11/2008, Cancellation Date: 01/21/2005, Registrant: Suzanne M Glennon, 3960 Hunter St, Glen Avon, CA 92509
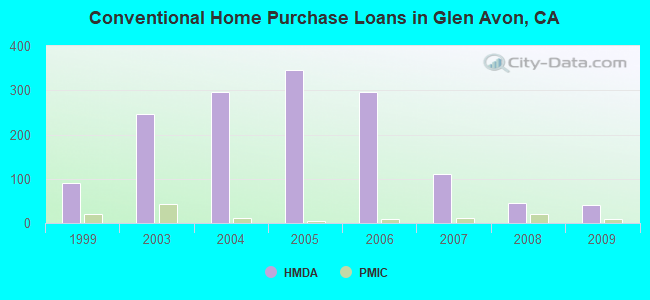
| Home Mortgage Disclosure Act Aggregated Statistics For Year 2009 (Based on 3 full and 1 partial tracts) | ||||||||||||
| A) FHA, FSA/RHS & VA Home Purchase Loans | B) Conventional Home Purchase Loans | C) Refinancings | D) Home Improvement Loans | F) Non-occupant Loans on < 5 Family Dwellings (A B C & D) | G) Loans On Manufactured Home Dwelling (A B C & D) | |||||||
|---|---|---|---|---|---|---|---|---|---|---|---|---|
| Number | Average Value | Number | Average Value | Number | Average Value | Number | Average Value | Number | Average Value | Number | Average Value | |
| LOANS ORIGINATED | 89 | $174,655 | 41 | $132,532 | 67 | $163,337 | 3 | $37,063 | 14 | $104,325 | 5 | $32,400 |
| APPLICATIONS APPROVED, NOT ACCEPTED | 9 | $184,467 | 10 | $72,545 | 13 | $205,611 | 1 | $11,000 | 0 | $0 | 8 | $43,125 |
| APPLICATIONS DENIED | 20 | $208,011 | 17 | $101,547 | 70 | $187,223 | 13 | $70,347 | 10 | $138,649 | 10 | $44,100 |
| APPLICATIONS WITHDRAWN | 25 | $186,208 | 11 | $142,545 | 20 | $202,890 | 4 | $79,000 | 4 | $145,500 | 2 | $45,500 |
| FILES CLOSED FOR INCOMPLETENESS | 5 | $184,400 | 0 | $0 | 8 | $200,310 | 1 | $140,000 | 2 | $158,000 | 0 | $0 |
Detailed HMDA statistics for the following Tracts: 0403.03 , 0405.01, 0405.02, 0405.03
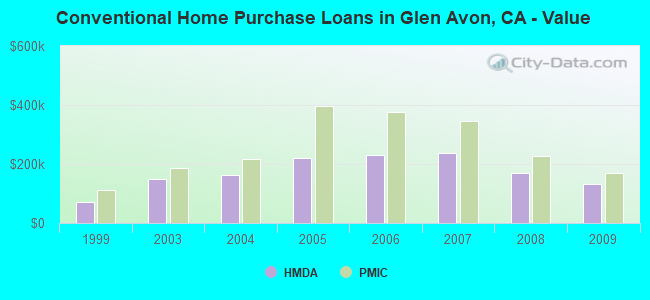
| Private Mortgage Insurance Companies Aggregated Statistics For Year 2009 (Based on 3 full and 1 partial tracts) | ||||
| A) Conventional Home Purchase Loans | B) Refinancings | |||
|---|---|---|---|---|
| Number | Average Value | Number | Average Value | |
| LOANS ORIGINATED | 10 | $169,508 | 0 | $0 |
| APPLICATIONS APPROVED, NOT ACCEPTED | 4 | $199,750 | 1 | $165,330 |
| APPLICATIONS DENIED | 4 | $164,000 | 0 | $0 |
| APPLICATIONS WITHDRAWN | 0 | $0 | 0 | $0 |
| FILES CLOSED FOR INCOMPLETENESS | 1 | $144,000 | 0 | $0 |
Detailed PMIC statistics for the following Tracts: 0403.03 , 0405.01, 0405.02, 0405.03
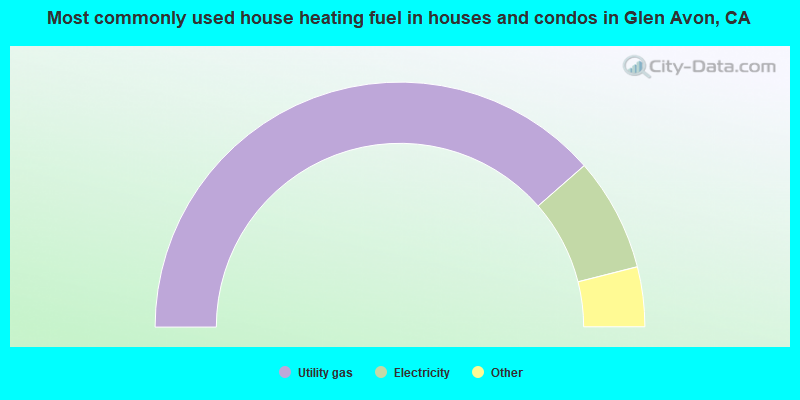
- 77.1%Utility gas
- 15.0%Electricity
- 3.0%Wood
- 2.5%Bottled, tank, or LP gas
- 1.8%No fuel used
- 0.6%Other fuel
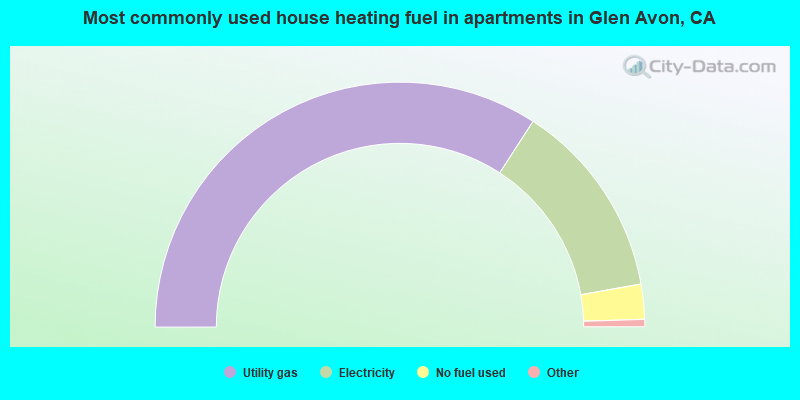
- 68.3%Utility gas
- 26.1%Electricity
- 4.6%No fuel used
- 0.5%Bottled, tank, or LP gas
- 0.4%Wood
Glen Avon compared to California state average:
- Median house value significantly below state average.
- Unemployed percentage below state average.
- Hispanic race population percentage above state average.
- Length of stay since moving in significantly above state average.
- House age significantly below state average.
- Percentage of population with a bachelor's degree or higher significantly below state average.
Glen Avon on our top lists:
- #59 on the list of "Top 101 cities with the most residents born in Mexico (population 500+)"
- #3 on the list of "Top 101 counties with the highest lead air pollution readings in 2012 (µg/m3)"
- #4 on the list of "Top 101 counties with the highest ground withdrawal of fresh water for public supply"
- #11 on the list of "Top 101 counties with the most Catholic adherents"
- #11 on the list of "Top 101 counties with the highest total withdrawal of fresh water for public supply"
- #12 on the list of "Top 101 counties with the highest carbon monoxide air pollution readings in 2012 (ppm)"