Rancho Cucamonga, California

Rancho Cucamonga: Sunset after a rainy day
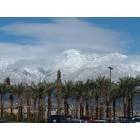
Rancho Cucamonga: Winter Mountains in Rancho Cucamonga
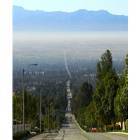
Rancho Cucamonga: VALLEY VIEW FROM TOP OF HAVEN AVENUE
Rancho Cucamonga: Victoria Gardens at Christmas Time

Rancho Cucamonga: Rainy day sunset
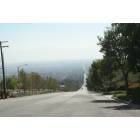
Rancho Cucamonga: top of archibald
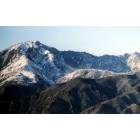
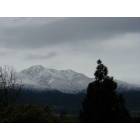
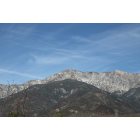
Rancho Cucamonga: Cucamonga Peak in the Winter Time in Rancho Cucamonga
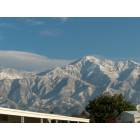
Rancho Cucamonga: snow on mts.
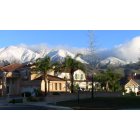
Rancho Cucamonga: awsome veiw

Rancho Cucamonga: Cucamonga sunrise
Rancho Cucamonga: Cucamonga Peak from Etiwanda
- see
31
more - add
your
Submit your own pictures of this city and show them to the world
- OSM Map
- General Map
- Google Map
- MSN Map
Population change since 2000: +38.0%
| Males: 86,665 | |
| Females: 89,671 |
| Median resident age: | 39.8 years |
| California median age: | 37.9 years |
Zip codes: 91701, 91730, 91737.
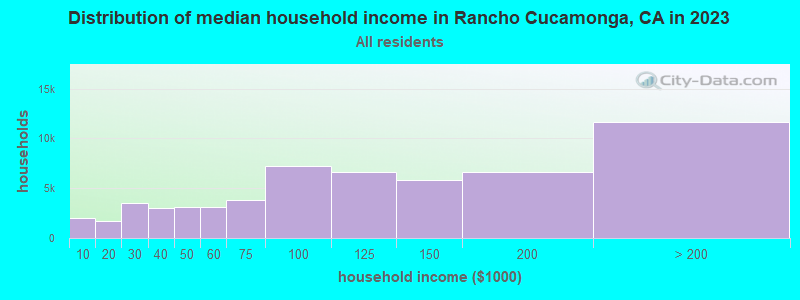
Rancho Cucamonga Zip Code Map| Rancho Cucamonga: | $108,345 |
| CA: | $91,551 |
Estimated per capita income in 2022: $45,946 (it was $23,702 in 2000)
Rancho Cucamonga city income, earnings, and wages data
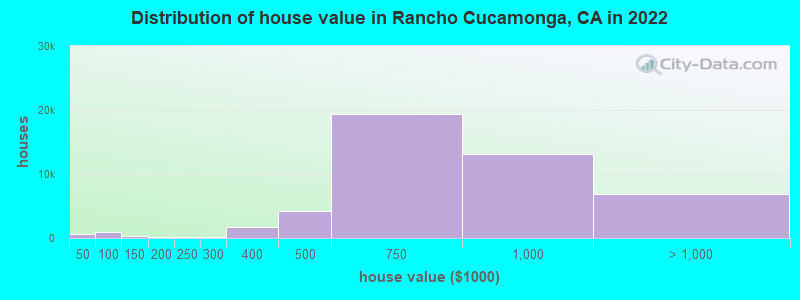
Estimated median house or condo value in 2022: $765,700 (it was $176,400 in 2000)
| Rancho Cucamonga: | $765,700 |
| CA: | $715,900 |
Mean prices in 2022: all housing units: $800,124; detached houses: $857,018; townhouses or other attached units: $517,267; in 2-unit structures: $454,527; in 3-to-4-unit structures: $511,985; in 5-or-more-unit structures: $589,147; mobile homes: $123,179
Median gross rent in 2022: $2,239.
Rancho Cucamonga, CA residents, houses, and apartments details
(6.9% for White Non-Hispanic residents, 10.9% for Black residents, 5.8% for Hispanic or Latino residents, 15.7% for American Indian residents, 14.8% for Native Hawaiian and other Pacific Islander residents, 8.0% for other race residents, 6.6% for two or more races residents)
Detailed information about poverty and poor residents in Rancho Cucamonga, CA


Compare current foreclosures in Rancho Cucamonga, CA:
| Photo | Address | Area | Beds / Baths | Price | Details |
|---|---|---|---|---|---|

|
#1
Laurel Tree Dr
Rancho Cucamonga, CA 91739
|
3,467 sq. feet
|
2 baths 5 beds |
show details | |

|
#2
Turning Leaf Pl
Rancho Cucamonga, CA 91701
|
2,252 sq. feet
|
2 baths 3 beds |
show details | |

|
#3
Avalon Ct
Rancho Cucamonga, CA 91701
|
1,362 sq. feet
|
2 baths 4 beds |
show details | |

|
#4
Linden Ln
Rancho Cucamonga, CA 91701
|
1,325 sq. feet
|
2 baths 3 beds |
show details | |

|
#5
Green Pine Ct
Rancho Cucamonga, CA 91739
|
3,204 sq. feet
|
2 baths 4 beds |
show details | |

|
#6
Roberts Pl
Rancho Cucamonga, CA 91739
|
2,905 sq. feet
|
3 baths 4 beds |
show details | |

|
#7
Roberts Pl
Rancho Cucamonga, CA 91739
|
2,905 sq. feet
|
3 baths 4 beds |
show details | |

|
#8
Churchill Dr
Rancho Cucamonga, CA 91739
|
4,857 sq. feet
|
6 baths 4 beds |
show details | |

|
#9
San Fernando Pl
Rancho Cucamonga, CA 91739
|
1,969 sq. feet
|
2 baths 4 beds |
show details | |

|
#10
Orange St
Rancho Cucamonga, CA 91701
|
1,600 sq. feet
|
2 baths 3 beds |
show details |
| Photo | Address | Area | Beds / Baths | Price | Details |
|---|---|---|---|---|---|

|
#11
Altawoods Way
Rancho Cucamonga, CA 91701
|
1,300 sq. feet
|
2 baths 2 beds |
show details | |

|
#12
Green Pine Ct
Rancho Cucamonga, CA 91739
|
3,204 sq. feet
|
3 baths 4 beds |
show details | |

|
#13
Roberts Pl
Rancho Cucamonga, CA 91739
|
2,905 sq. feet
|
3 baths 4 beds |
show details | |

|
#14
Hollyoak Dr
Rancho Cucamonga, CA 91701
|
2,565 sq. feet
|
2 baths 4 beds |
show details | |

|
#15
Whitestone Dr
Rancho Cucamonga, CA 91739
|
2,072 sq. feet
|
2 baths 3 beds |
show details | |

|
#16
Annapolis Dr
Rancho Cucamonga, CA 91730
|
2,276 sq. feet
|
2 baths 4 beds |
show details | |

|
#17
Foothill Blvd Spc 97
Rancho Cucamonga, CA 91730
|
1,830 sq. feet
|
3 baths 4 beds |
show details | |

|
#18
Baseline Rd Spc 114
Rancho Cucamonga, CA 91701
|
910 sq. feet
|
2 baths 3 beds |
show details | |

|
#19
Shelby Pl Apt 21
Rancho Cucamonga, CA 91739
|
1,304 sq. feet
|
2 baths 2 beds |
show details | |

|
#20
Lemon Ave Apt 2101
Rancho Cucamonga, CA 91737
|
636 sq. feet
|
1 baths 1 beds |
show details |
| Photo | Address | Area | Beds / Baths | Price | Details |
|---|---|---|---|---|---|

|
#21
Fennel Rd
Rancho Cucamonga, CA 91739
|
988 sq. feet
|
2 baths 3 beds |
show details | |

|
#22
Chelsea Ct
Rancho Cucamonga, CA 91730
|
1,364 sq. feet
|
2 baths 3 beds |
show details | |

|
#23
Whirlaway St
Rancho Cucamonga, CA 91737
|
2,670 sq. feet
|
3 baths 4 beds |
show details | |

|
#24
Carano Pl
Rancho Cucamonga, CA 91701
|
1,494 sq. feet
|
2 baths 3 beds |
show details | |

|
#25
Baseline Rd Spc 17
Rancho Cucamonga, CA 91701
|
1,512 sq. feet
|
2 baths 3 beds |
show details | |

|
#26
Shelby Pl Apt 60
Rancho Cucamonga, CA 91739
|
1,964 sq. feet
|
2 baths 3 beds |
show details | |

|
#27
Mineral Peak Ct
Rancho Cucamonga, CA 91737
|
1,400 sq. feet
|
2 baths 3 beds |
show details | |

|
#28
Topaz St
Rancho Cucamonga, CA 91701
|
1,456 sq. feet
|
2 baths 3 beds |
show details | |

|
#29
Sicilian Dr
Rancho Cucamonga, CA 91730
|
2,766 sq. feet
|
3 baths 4 beds |
show details | |

|
#30
Vai Brothers Dr
Rancho Cucamonga, CA 91739
|
2,987 sq. feet
|
3 baths 5 beds |
show details |
| Photo | Address | Area | Beds / Baths | Price | Details |
|---|---|---|---|---|---|

|
#31
Avenida Castro
Rancho Cucamonga, CA 91730
|
1,426 sq. feet
|
2 baths 4 beds |
show details | |

|
#32
Hellman Ave
Rancho Cucamonga, CA 91737
|
3,661 sq. feet
|
4 baths 5 beds |
show details | |

|
#33
Foothill Blvd Spc 43
Rancho Cucamonga, CA 91730
|
1,440 sq. feet
|
2 baths 2 beds |
show details | |

|
#34
Hellman Ave
Rancho Cucamonga, CA 91730
|
1,522 sq. feet
|
2 baths 4 beds |
show details | |

|
#35
Ramona Ave
Rancho Cucamonga, CA 91730
|
1,330 sq. feet
|
2 baths 3 beds |
show details | |

|
#36
Ramona Ave
Rancho Cucamonga, CA 91730
|
1,330 sq. feet
|
2 baths 3 beds |
show details | |

|
#37
Layton St
Rancho Cucamonga, CA 91730
|
1,274 sq. feet
|
2 baths 3 beds |
show details | |

|
#38
Merlot Ct
Rancho Cucamonga, CA 91737
|
2,309 sq. feet
|
3 baths 4 beds |
show details | |

|
#39
Avon Ct
Rancho Cucamonga, CA 91739
|
2,765 sq. feet
|
3 baths 4 beds |
show details | |

|
#40
Heather St
Rancho Cucamonga, CA 91701
|
1,300 sq. feet
|
2 baths 4 beds |
show details |
| Photo | Address | Area | Beds / Baths | Price | Details |
|---|---|---|---|---|---|

|
#41
Aloe Ct
Rancho Cucamonga, CA 91739
|
2,530 sq. feet
|
3 baths 3 beds |
show details | |

|
#42
Cortland St
Rancho Cucamonga, CA 91701
|
1,653 sq. feet
|
2 baths 4 beds |
show details | |

|
#43
Torino Rd
Rancho Cucamonga, CA 91701
|
2,322 sq. feet
|
2 baths 4 beds |
show details | |

|
#44
Jasper St
Rancho Cucamonga, CA 91701
|
1,648 sq. feet
|
2 baths 3 beds |
show details | |

|
#45
Madera Ct
Rancho Cucamonga, CA 91730
|
1,288 sq. feet
|
2 baths 3 beds |
show details | |

|
#46
Monte Vista St
Rancho Cucamonga, CA 91701
|
1,848 sq. feet
|
2 baths 4 beds |
show details | |

|
#47
Dakota Ave
Rancho Cucamonga, CA 91701
|
1,553 sq. feet
|
2 baths 3 beds |
show details | |

|
#48
Avalon Ct
Rancho Cucamonga, CA 91701
|
1,362 sq. feet
|
2 baths 4 beds |
show details | |

|
#49
Laurel Tree Dr
Rancho Cucamonga, CA 91739
|
3,467 sq. feet
|
3 baths 5 beds |
show details | |

|
Check over 1 million property listings on Foreclosure.com!
|
browse all offers | |||


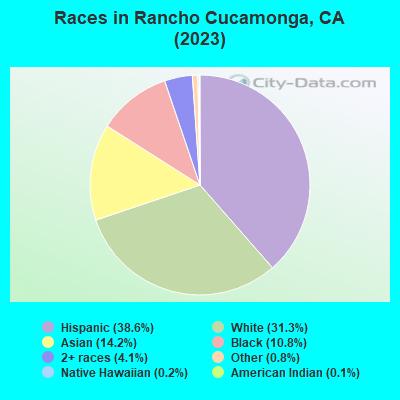
- 68,37538.8%Hispanic
- 60,28034.2%White alone
- 26,99815.3%Asian alone
- 13,6397.7%Black alone
- 5,1552.9%Two or more races
- 1,3620.8%Other race alone
- 4180.2%Native Hawaiian and Other
Pacific Islander alone - 1320.07%American Indian alone
According to our research of California and other state lists, there were 106 registered sex offenders living in Rancho Cucamonga, California as of April 27, 2024.
The ratio of all residents to sex offenders in Rancho Cucamonga is 1,665 to 1.
The ratio of registered sex offenders to all residents in this city is lower than the state average.
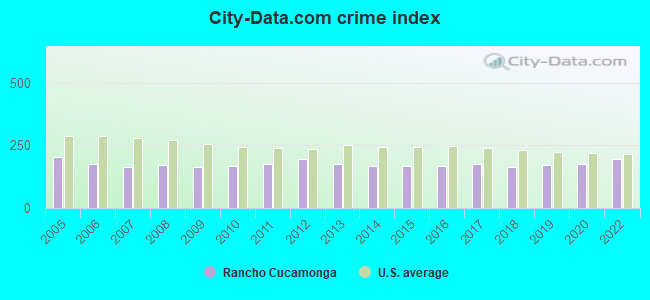
The City-Data.com crime index weighs serious crimes and violent crimes more heavily. Higher means more crime, U.S. average is 246.1. It adjusts for the number of visitors and daily workers commuting into cities.
- means the value is smaller than the state average.- means the value is about the same as the state average.
- means the value is bigger than the state average.
- means the value is much bigger than the state average.
Crime rate in Rancho Cucamonga detailed stats: murders, rapes, robberies, assaults, burglaries, thefts, arson
Full-time law enforcement employees in 2015, including police officers: 1 (1 officers - 1 male; 0 female).
| Officers per 1,000 residents here: | 0.01 |
| California average: | 1.98 |
 Recent articles from our blog. Our writers, many of them Ph.D. graduates or candidates, create easy-to-read articles on a wide variety of topics.


Latest news from Rancho Cucamonga, CA collected exclusively by city-data.com from local newspapers, TV, and radio stations
Ancestries: English (3.7%), American (3.2%), Irish (2.3%), German (2.2%), Italian (2.0%), European (1.7%).
Current Local Time: PST time zone
Elevation: 1200 feet
Land area: 37.4 square miles.
Population density: 4,709 people per square mile (average).
35,383 residents are foreign born (10.0% Asia, 8.0% Latin America).
| This city: | 20.1% |
| California: | 26.5% |
Median real estate property taxes paid for housing units with mortgages in 2022: $5,671 (0.7%)
Median real estate property taxes paid for housing units with no mortgage in 2022: $3,939 (0.5%)
Nearest city with pop. 200,000+: Riverside, CA  (16.0 miles , pop. 255,166).
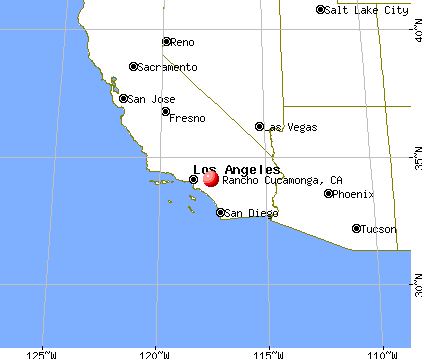
Nearest city with pop. 1,000,000+: Los Angeles, CA (45.7 miles , pop. 3,694,820).
Nearest cities:
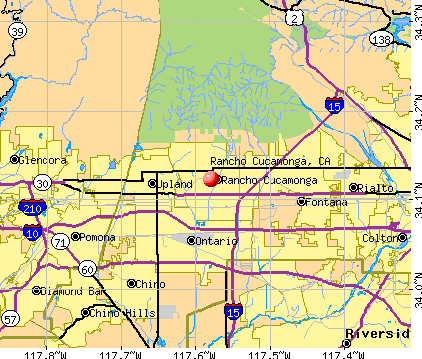
Latitude: 34.12 N, Longitude: 117.58 W
Daytime population change due to commuting: -7,755 (-4.4%)
Workers who live and work in this city: 24,920 (29.7%)
Area code commonly used in this area: 909
Property values in Rancho Cucamonga, CA
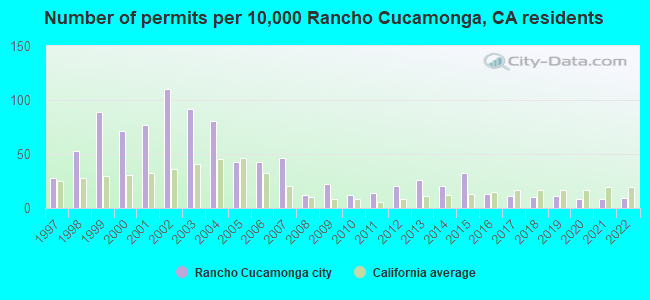
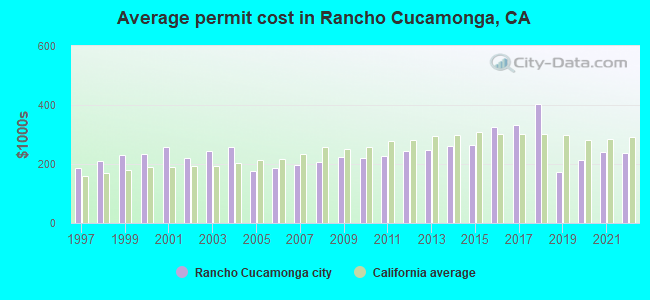
Single-family new house construction building permits:
- 2022: 121 buildings, average cost: $238,100
- 2021: 107 buildings, average cost: $239,700
- 2020: 98 buildings, average cost: $215,400
- 2019: 137 buildings, average cost: $174,400
- 2018: 127 buildings, average cost: $403,300
- 2017: 137 buildings, average cost: $332,900
- 2016: 168 buildings, average cost: $323,700
- 2015: 410 buildings, average cost: $266,200
- 2014: 255 buildings, average cost: $260,700
- 2013: 332 buildings, average cost: $247,500
- 2012: 251 buildings, average cost: $243,300
- 2011: 184 buildings, average cost: $225,500
- 2010: 155 buildings, average cost: $221,600
- 2009: 286 buildings, average cost: $223,700
- 2008: 159 buildings, average cost: $207,800
- 2007: 583 buildings, average cost: $196,100
- 2006: 546 buildings, average cost: $185,100
- 2005: 544 buildings, average cost: $177,300
- 2004: 1030 buildings, average cost: $256,000
- 2003: 1173 buildings, average cost: $242,500
- 2002: 1406 buildings, average cost: $221,500
- 2001: 989 buildings, average cost: $258,300
- 2000: 904 buildings, average cost: $234,000
- 1999: 1134 buildings, average cost: $229,300
- 1998: 679 buildings, average cost: $208,800
- 1997: 354 buildings, average cost: $187,900
| Here: | 3.7% |
| California: | 5.1% |
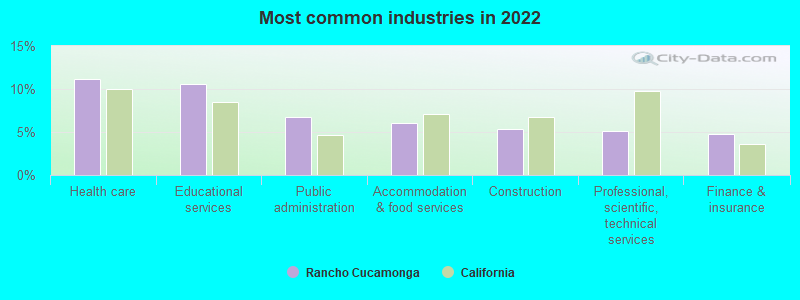
- Health care (11.1%)
- Educational services (10.6%)
- Public administration (6.8%)
- Accommodation & food services (6.0%)
- Construction (5.3%)
- Professional, scientific, technical services (5.1%)
- Finance & insurance (4.8%)
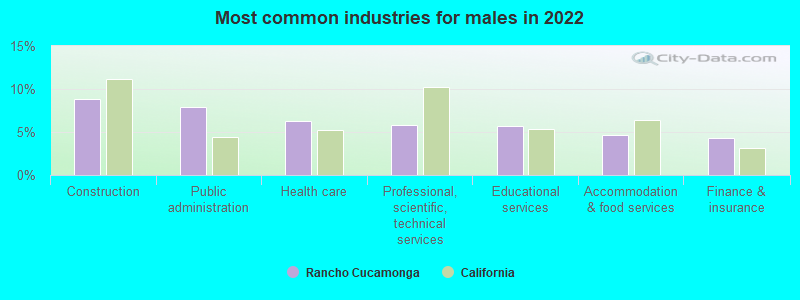
- Construction (8.8%)
- Public administration (7.9%)
- Health care (6.3%)
- Professional, scientific, technical services (5.8%)
- Educational services (5.7%)
- Accommodation & food services (4.7%)
- Finance & insurance (4.3%)
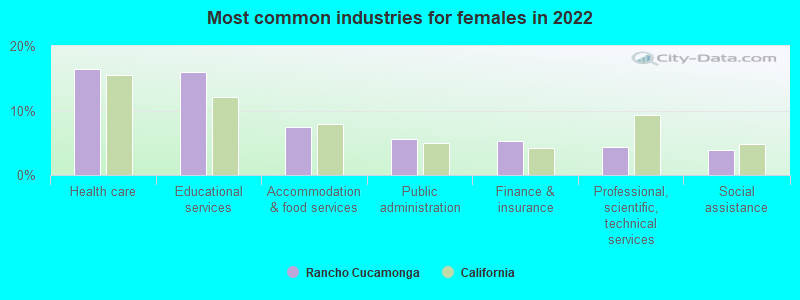
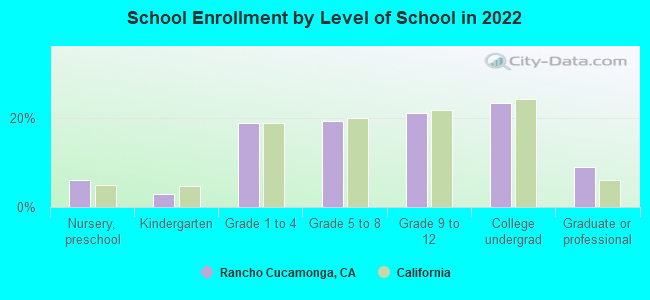
- Health care (16.5%)
- Educational services (15.9%)
- Accommodation & food services (7.5%)
- Public administration (5.6%)
- Finance & insurance (5.3%)
- Professional, scientific, technical services (4.4%)
- Social assistance (3.9%)
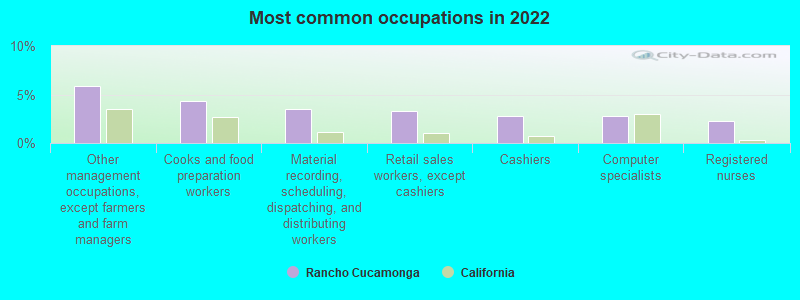
- Other management occupations, except farmers and farm managers (5.9%)
- Cooks and food preparation workers (4.3%)
- Material recording, scheduling, dispatching, and distributing workers (3.5%)
- Retail sales workers, except cashiers (3.3%)
- Cashiers (2.8%)
- Computer specialists (2.7%)
- Registered nurses (2.3%)
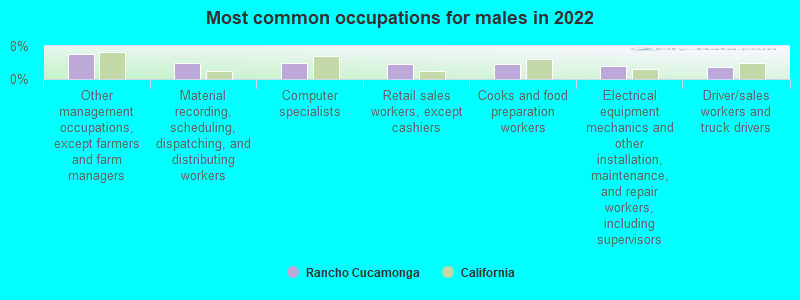
- Other management occupations, except farmers and farm managers (6.0%)
- Material recording, scheduling, dispatching, and distributing workers (3.8%)
- Computer specialists (3.8%)
- Retail sales workers, except cashiers (3.7%)
- Cooks and food preparation workers (3.6%)
- Electrical equipment mechanics and other installation, maintenance, and repair workers, including supervisors (3.1%)
- Driver/sales workers and truck drivers (3.0%)
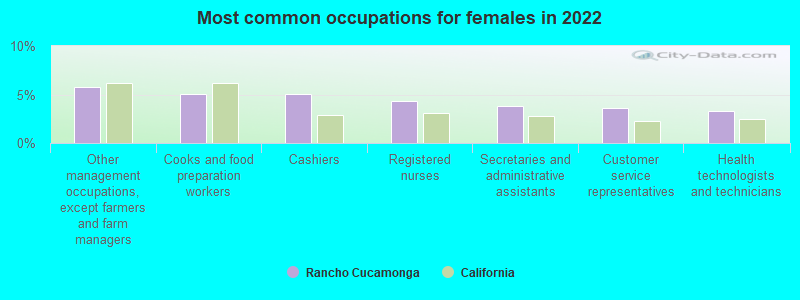
- Other management occupations, except farmers and farm managers (5.7%)
- Cooks and food preparation workers (5.1%)
- Cashiers (5.0%)
- Registered nurses (4.3%)
- Secretaries and administrative assistants (3.8%)
- Customer service representatives (3.6%)
- Health technologists and technicians (3.3%)
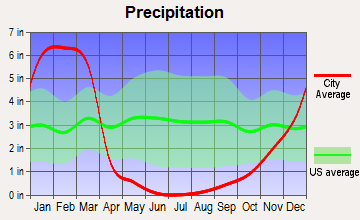
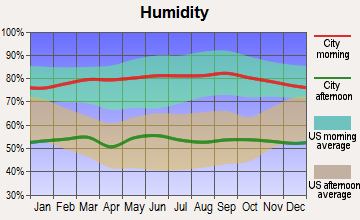
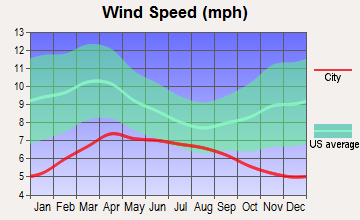
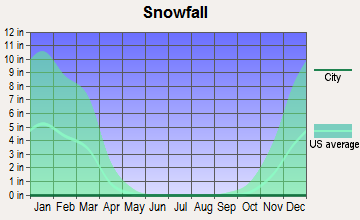
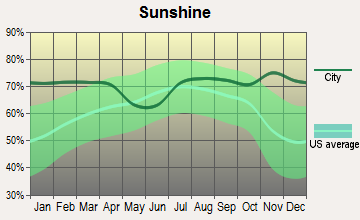
Average climate in Rancho Cucamonga, California
Based on data reported by over 4,000 weather stations


(lower is better)
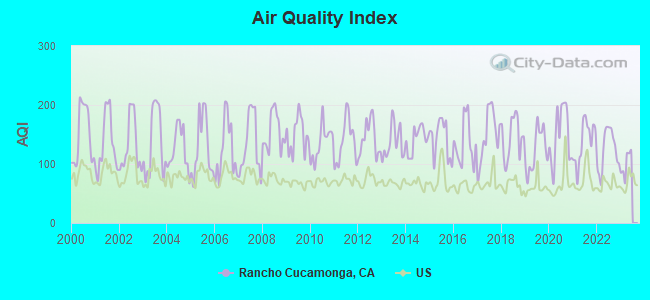
Air Quality Index (AQI) level in 2022 was 124. This is significantly worse than average.
| City: | 124 |
| U.S.: | 73 |
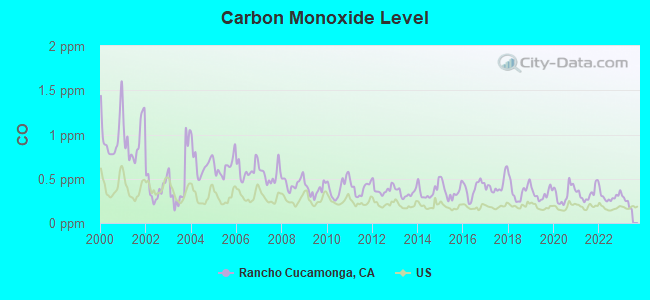
Carbon Monoxide (CO) [ppm] level in 2022 was 0.300. This is about average. Closest monitor was 3.2 miles away from the city center.
| City: | 0.300 |
| U.S.: | 0.251 |
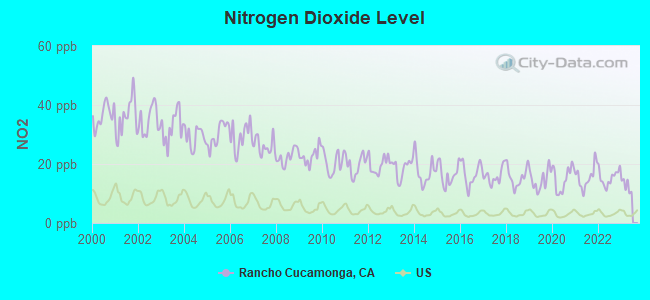
Nitrogen Dioxide (NO2) [ppb] level in 2022 was 15.4. This is significantly worse than average. Closest monitor was 3.2 miles away from the city center.
| City: | 15.4 |
| U.S.: | 5.1 |
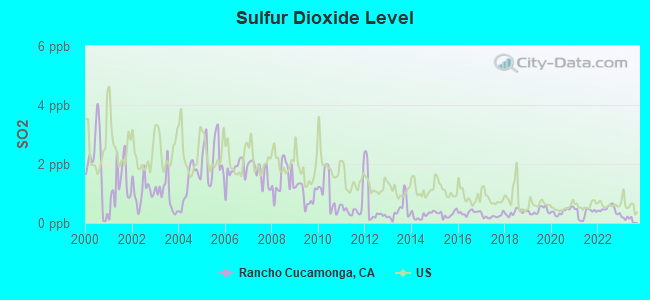
Sulfur Dioxide (SO2) [ppb] level in 2022 was 0.468. This is significantly better than average. Closest monitor was 3.2 miles away from the city center.
| City: | 0.468 |
| U.S.: | 1.515 |
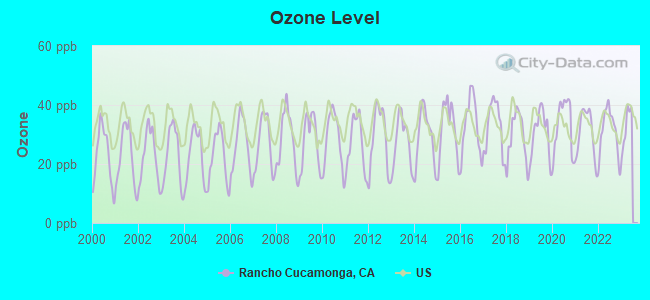
Ozone [ppb] level in 2022 was 31.0. This is about average. Closest monitor was 3.2 miles away from the city center.
| City: | 31.0 |
| U.S.: | 33.3 |
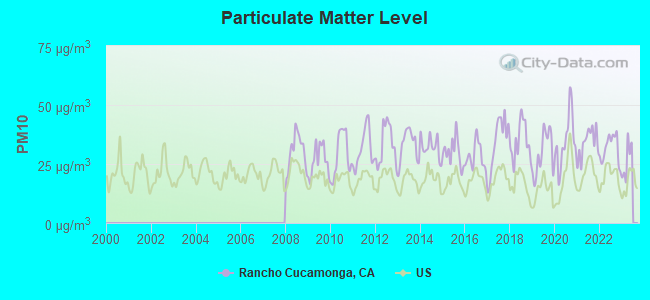
Particulate Matter (PM10) [µg/m3] level in 2022 was 31.5. This is significantly worse than average. Closest monitor was 3.2 miles away from the city center.
| City: | 31.5 |
| U.S.: | 19.2 |
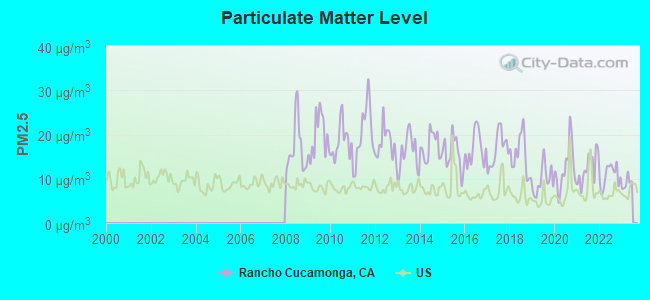
Particulate Matter (PM2.5) [µg/m3] level in 2022 was 10.7. This is worse than average. Closest monitor was 5.3 miles away from the city center.
| City: | 10.7 |
| U.S.: | 8.1 |
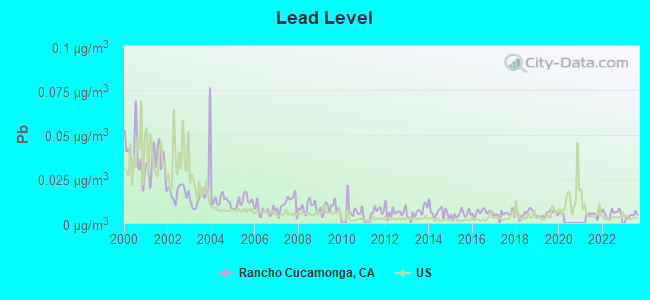
Lead (Pb) [µg/m3] level in 2023 was 0.00426. This is significantly better than average. Closest monitor was 3.2 miles away from the city center.
| City: | 0.00426 |
| U.S.: | 0.00931 |
Earthquake activity:
Rancho Cucamonga-area historical earthquake activity is significantly above California state average. It is 7331% greater than the overall U.S. average.On 6/28/1992 at 11:57:34, a magnitude 7.6 (6.2 MB, 7.6 MS, 7.3 MW, Depth: 0.7 mi, Class: Major, Intensity: VIII - XII) earthquake occurred 60.1 miles away from Rancho Cucamonga center, causing 3 deaths (1 shaking deaths, 2 other deaths) and 400 injuries, causing $100,000,000 total damage and $40,000,000 insured losses
On 7/21/1952 at 11:52:14, a magnitude 7.7 (7.7 UK) earthquake occurred 101.1 miles away from the city center, causing $50,000,000 total damage
On 10/16/1999 at 09:46:44, a magnitude 7.4 (6.3 MB, 7.4 MS, 7.2 MW, 7.3 ML) earthquake occurred 70.8 miles away from Rancho Cucamonga center
On 6/28/1992 at 15:05:30, a magnitude 6.9 (6.3 MB, 6.7 MS, 6.5 MW, 6.9 ME, Depth: 3.1 mi, Class: Strong, Intensity: VII - IX) earthquake occurred 45.1 miles away from the city center
On 4/21/1918 at 22:32:30, a magnitude 6.8 (6.8 UK) earthquake occurred 23.0 miles away from Rancho Cucamonga center
On 5/19/1940 at 04:36:40, a magnitude 7.2 (7.2 UK) earthquake occurred 125.0 miles away from Rancho Cucamonga center, causing $33,000,000 total damage
Magnitude types: body-wave magnitude (MB), energy magnitude (ME), local magnitude (ML), surface-wave magnitude (MS), moment magnitude (MW)
Natural disasters:
The number of natural disasters in San Bernardino County (46) is a lot greater than the US average (15).Major Disasters (Presidential) Declared: 27
Emergencies Declared: 2
Causes of natural disasters: Fires: 24, Floods: 18, Storms: 9, Winter Storms: 6, Landslides: 5, Mudslides: 4, Heavy Rains: 2, Earthquake: 1, Flash Flood: 1, Freeze: 1, Hurricane: 1, Snow: 1, Tornado: 1, Tropical Storm: 1, Wind: 1, Other: 1 (Note: some incidents may be assigned to more than one category).
Main business address for: Emrise CORP (INSTRUMENTS FOR MEAS & TESTING OF ELECTRICITY & ELEC SIGNALS), VINEYARD NATIONAL BANCORP (NATIONAL COMMERCIAL BANKS).
Hospitals in Rancho Cucamonga:
- COMMUNITY HOSPICE SERVICES, INC (8273 WHITE OAK AVENUE, SUITE 120)
- RANCHO SPECIALTY HOSPITAL (10841 WHITE OAK AVENUE)
- VICTORIA DIVISION (13342 VICTORIA)
- WEST COAST HOSPICE, INC (10700 CIVIC CENTER DRIVE, SUITE 100-A)
Dialysis Facilities in Rancho Cucamonga:
- FMC-RANCHO CUCAMONGA (10532 ACACIA STREET, SUITE B2-B3)
- HOME DIALYSIS CENTERS OF RANCHO CUCAMONGA (8221 ROCHESTER AVENUE, SUITE 130)
Home Health Centers in Rancho Cucamonga:
- EXCELLENT CARE HOME HEALTH SERVICES, INC (9439 ARCHIBALD AVE, SUITE 110)
- EXCELSIOR HOME HEALTH CARE, INC (9620 CENTER AVE, #130)
- HOME HEALTH CARE SOLUTIONS, INC (9581 BUSINESS CENTER DRIVE BLDG 12 SUITE H)
- INLAND HOME HEALTH PROVIDERS INC (9221 ARCHIBALD AVENUE)
- MORNING STAR HOME HEALTH SERVICES INC (10574 ACACIA STREET SUITE D2)
- NIGHTINGALE HOME HEALTH AGENCY, INC (9330 BASELINE ROAD SUITE 201)
- PLEXUS HEALTH CARE INC (7365 CARNELIAN STREET SUITE 116A)
- PRIME CARE HOME HEALTH AGENCY, INC (8401 WHITE OAK AVENUE #102)
- STAR MED HOME HEALTH CARE (10535 FOOTHILL BLVD #270)
- VANURA HOME HEALTH SERVICES, INC (10700 JERSEY BLVD SUITE 460)
Amtrak stations near Rancho Cucamonga:
- 6 miles: ONTARIO (228 S. PLUM ST.) . Services: fully wheelchair accessible, public payphones, vending machines, free short-term parking, call for taxi service.
- 9 miles: CLAREMONT (200 W. 1ST ST.) - Bus Station . Services: fully wheelchair accessible, public payphones, full-service food facilities, free short-term parking, free long-term parking, call for car rental service, call for taxi service, public transit connection.
- 11 miles: POMONA (156 W. COMMERCIAL ST.) . Services: partially wheelchair accessible, public payphones, free short-term parking, free long-term parking, call for taxi service, public transit connection.
Colleges/Universities in Rancho Cucamonga:
Other colleges/universities with over 2000 students near Rancho Cucamonga:
- University of La Verne (about 12 miles; La Verne, CA; Full-time enrollment: 6,983)
- DeVry University-California (about 14 miles; Pomona, CA; FT enrollment: 10,875)
- Norco College (about 15 miles; Norco, CA; FT enrollment: 4,916)
- California State Polytechnic University-Pomona (about 15 miles; Pomona, CA; FT enrollment: 18,141)
- California State University-San Bernardino (about 16 miles; San Bernardino, CA; FT enrollment: 15,748)
- San Bernardino Valley College (about 16 miles; San Bernardino, CA; FT enrollment: 7,444)
- Riverside City College (about 16 miles; Riverside, CA; FT enrollment: 10,661)
Public high schools in Rancho Cucamonga:
- LOS OSOS HIGH (Students: 2,245, Location: 6001 MILLIKEN AVE., Grades: 9-12)
- RANCHO CUCAMONGA HIGH (Students: 2,125, Location: 11801 LARK DR., Grades: 9-12)
- BALDY VIEW ROP (Location: 8265 ASPEN AVE., STE. 100, Grades: 9-12)
Private high schools in Rancho Cucamonga:
Biggest public elementary/middle schools in Rancho Cucamonga:
- RUTH MUSSER MIDDLE (Students: 931, Location: 10789 TERRA VISTA PKWY., Grades: 5-8)
- CUCAMONGA MIDDLE (Students: 836, Location: 7611 HELLMAN AVE., Grades: 6-8)
- RANCHO CUCAMONGA MIDDLE (Students: 759, Location: 10022 FERON BLVD., Grades: 6-8)
- TERRA VISTA ELEMENTARY (Students: 454, Location: 7497 MOUNTAIN VIEW DR., Grades: KG-5)
- COYOTE CANYON ELEMENTARY (Students: 416, Location: 7889 ELM AVE., Grades: KG-4)
- DONA MERCED ELEMENTARY (Students: 378, Location: 10333 PALO ALTO, Grades: KG-5)
- LOS AMIGOS ELEMENTARY (Students: 360, Location: 8496 NINTH ST., Grades: KG-5)
- CUCAMONGA ELEMENTARY (Students: 352, Location: 8677 ARCHIBALD AVE., Grades: KG-5)
- BEAR GULCH ELEMENTARY (Students: 337, Location: 8355 BEAR GULCH PL., Grades: KG-5)
- VALLE VISTA ELEMENTARY (Students: 309, Location: 7727 VALLE VISTA DR., Grades: KG-5)
Private elementary/middle schools in Rancho Cucamonga:
User-submitted facts and corrections:
- There are four high schools in RC: Alta Loma HS, Rancho Cucamonga HS, Etiwanda HS, and Los Osos HS.
Points of interest:
Notable locations in Rancho Cucamonga: John Rains House (A), Etiwanda (B), Red Hill Country Club (C), United States Forest Service San Bernardino National Forest Station 37 Etiwanda (D), American Medical Response Rancho Cucamonga (E), Rancho Cucamonga Fire Protection District Station 176 (F), Rancho Cucamonga Fire Protection District Station 175 (G), Rancho Cucamonga Fire Protection District Station 172 (H), Rancho Cucamonga Fire Protection District Station 171 (I), Rancho Cucamonga Fire Protection District Station 174 (J), Rancho Cucamonga Fire Protection District Station 173 (K), Montclair Ambulance Service (L), Rancho Cucamonga Branch San Bernardino County Library (M), Casa de Rancho Cucamonga County Museum (N), Wargin Hall (O), Earl Sicosky Gymnasium (P). Display/hide their locations on the map
Shopping Centers: Masi Plaza Shopping Center (1), Orchard Plaza Shopping Center (2), Rancho Town Center Shopping Center (3), Stater Brothers Plaza Shopping Center (4), Thomas Winery Plaza Shopping Center (5), Vineyard Gateway Center Shopping Center (6), Vineyards Marketplace Shopping Center (7), Victoria Gardens Shopping Center (8), Terra Vista Village Shopping Center (9). Display/hide their locations on the map
Main business address in Rancho Cucamonga include: Emrise CORP (A), VINEYARD NATIONAL BANCORP (B). Display/hide their locations on the map
Churches in Rancho Cucamonga include: Grace Fellowship Church (A), Community Baptist Church (B), Alta Loma Christian Church (C), First Baptist Church of Rancho Cucamonga (D), Loveland Church (E), New Life Evangelical Church (F), Our Lady of Mount Carmel Church (G), Sacred Heart Church (H), The Lords House (I). Display/hide their locations on the map
Parks in Rancho Cucamonga include: Grigsby Field (1), Lowder Baseball Field (2), Cucamonga Winery Historical Landmark (3), North East Community Park (4), Victoria Groves Park (5), Windrows Park (6), Hermosa Park (7), Heritage Community Park (8), Beryl Park East (9). Display/hide their locations on the map
Tourist attractions: Casa de Rancho Cucamonga (Cultural Attractions- Events- & Facilities; 8810 Hemlock Street) (1), Etiwanda Historical Society (Historical Places & Services; 7150 Etiwanda Avenue) (2), Chaffey Community Museum of Art (Cultural Attractions- Events- & Facilities; 12467 Baseline Road) (3), Chaffey-Garcia House (7150 Etiwanda Av) (4), CruiseOne (Recreational Trips & Guides; 14114 Crescenta Way) (5). Display/hide their approximate locations on the map
Hotel: Best Western Heritage Inn (8179 Spruce Avenue) (1). Display/hide its approximate location on the map
Courts: California State - Corrections Dept- Background Investigations Unit (9055 Haven Avenue) (1), San Bernardino County - District Attorney- Criminal- Rancho Cucamonga Branch- Branch Off (8303 Haven Avenue) (2). Display/hide their approximate locations on the map
Birthplace of: Kendall Williams - Basketball player, Gerald Alexander - Football safety, Paul Bonaccorsi - Busch series NASCAR driver (born: Rancho Cucamonga, CA), Brandon Fractious - College football player (East Carolina Pirates), Corey Starks - College basketball player (UMKC Kangaroos), Darren Collison - College basketball player (UCLA Bruins), Lionel Manuel - Football player, Matthew Rogers - Football player, Nero Evero - College football player (UC Davis Aggies), Rene Rougeau - College basketball player (UNLV Rebels).
| This city: | 3.0 people |
| California: | 2.9 people |
| This city: | 76.0% |
| Whole state: | 68.7% |
| This city: | 6.3% |
| Whole state: | 7.2% |
Likely homosexual households (counted as self-reported same-sex unmarried-partner households)
- Lesbian couples: 0.4% of all households
- Gay men: 0.3% of all households
People in group quarters in Rancho Cucamonga in 2010:
- 2,887 people in local jails and other municipal confinement facilities
- 73 people in nursing facilities/skilled-nursing facilities
- 72 people in group homes intended for adults
- 35 people in residential treatment centers for adults
- 25 people in workers' group living quarters and job corps centers
- 17 people in group homes for juveniles (non-correctional)
- 11 people in residential treatment centers for juveniles (non-correctional)
- 4 people in other noninstitutional facilities
People in group quarters in Rancho Cucamonga in 2000:
- 1,770 people in local jails and other confinement facilities (including police lockups)
- 1,491 people in other nonhousehold living situations
- 122 people in homes for the mentally retarded
- 99 people in other noninstitutional group quarters
- 44 people in homes for the physically handicapped
- 42 people in hospitals/wards and hospices for chronically ill
- 42 people in other hospitals or wards for chronically ill
- 40 people in homes for abused, dependent, and neglected children
- 12 people in homes or halfway houses for drug/alcohol abuse
- 6 people in schools, hospitals, or wards for the intellectually disabled
Banks with most branches in Rancho Cucamonga (2011 data):
- U.S. Bank National Association: 7 branches. Info updated 2012/01/30: Bank assets: $330,470.8 mil, Deposits: $236,091.5 mil, headquarters in Cincinnati, OH, positive income, 3121 total offices, Holding Company: U.S. Bancorp
- Wells Fargo Bank, National Association: Highland & Daycreek, Rancho Cucamonga Branch, Victoria Garden Branch. Info updated 2011/04/05: Bank assets: $1,161,490.0 mil, Deposits: $905,653.0 mil, headquarters in Sioux Falls, SD, positive income, 6395 total offices, Holding Company: Wells Fargo & Company
- Bank of America, National Association: The Mills Branch at 11570 4th Street, branch established on 2007/12/05; Victoria Branch at 7387 Day Creek Boulevard, branch established on 2005/12/05. Info updated 2009/11/18: Bank assets: $1,451,969.3 mil, Deposits: $1,077,176.8 mil, headquarters in Charlotte, NC, positive income, 5782 total offices, Holding Company: Bank Of America Corporation
- Citibank, National Association: Rancho Cucamonga - Foothill Branch at 12379 Foothill Boulevard, branch established on 2007/11/13; Rancho Cucamonga Branch at 10590 Baseline Rd., branch established on 1991/03/01. Info updated 2012/01/10: Bank assets: $1,288,658.0 mil, Deposits: $882,541.0 mil, headquarters in Sioux Falls, SD, positive income, International Specialization, 1048 total offices, Holding Company: Citigroup Inc.
- JPMorgan Chase Bank, National Association: Milliken Branch at 8108 Milliken Avenue, branch established on 2006/12/18; 8730 Nineteenth Street Branch at 8730 19th St., branch established on 1919/01/01. Info updated 2011/11/10: Bank assets: $1,811,678.0 mil, Deposits: $1,190,738.0 mil, headquarters in Columbus, OH, positive income, International Specialization, 5577 total offices, Holding Company: Jpmorgan Chase & Co.
- California Business Bank: Rancho Cucamonga Branch at 9267 Haven Ave, branch established on 2008/08/11. Info updated 2006/11/03: Bank assets: $88.8 mil, Deposits: $83.5 mil, headquarters in Los Angeles, CA, negative income in the last year, Commercial Lending Specialization, 2 total offices
- Chino Commercial Bank, N.A.: Rancho Cucamonga Branch at 8229 Rochester Avenue, branch established on 2010/04/05. Info updated 2011/01/28: Bank assets: $109.6 mil, Deposits: $98.1 mil, headquarters in Chino, CA, positive income, Commercial Lending Specialization, 3 total offices, Holding Company: Chino Commercial Bancorp
- Union Bank, National Association: Rancho Cucamonga Branch at 11551 Foothill Blvd, branch established on 1990/10/22. Info updated 2011/09/01: Bank assets: $88,967.5 mil, Deposits: $65,286.4 mil, headquarters in San Francisco, CA, positive income, Commercial Lending Specialization, 403 total offices, Holding Company: Mitsubishi Ufj Financial Group, Inc.
- Wilshire State Bank: Rancho Cucamonga Branch at 8045 Archibald Avenue #100, branch established on 2006/07/24. Info updated 2012/02/10: Bank assets: $2,691.4 mil, Deposits: $2,212.8 mil, headquarters in Los Angeles, CA, negative income in the last year, Commercial Lending Specialization, 24 total offices, Holding Company: Wilshire Bancorp, Inc.
- 7 other banks with 7 local branches
For population 15 years and over in Rancho Cucamonga:
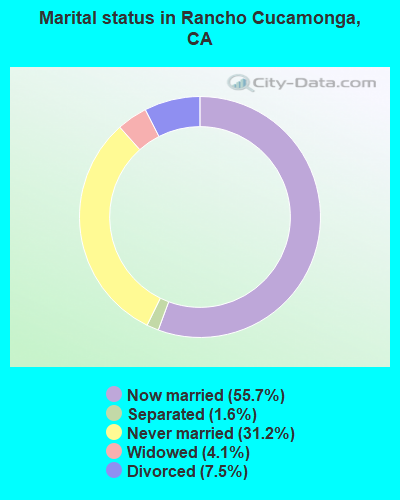
- Never married: 31.2%
- Now married: 55.7%
- Separated: 1.6%
- Widowed: 4.1%
- Divorced: 7.5%
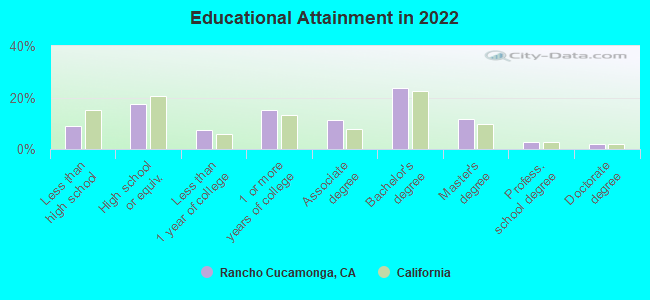
For population 25 years and over in Rancho Cucamonga:
- High school or higher: 91.2%
- Bachelor's degree or higher: 39.9%
- Graduate or professional degree: 16.1%
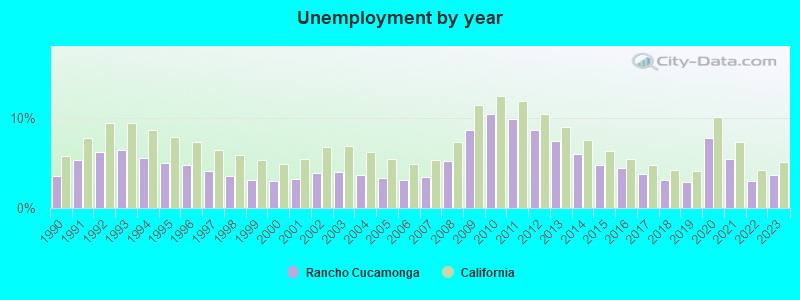
- Unemployed: 5.4%
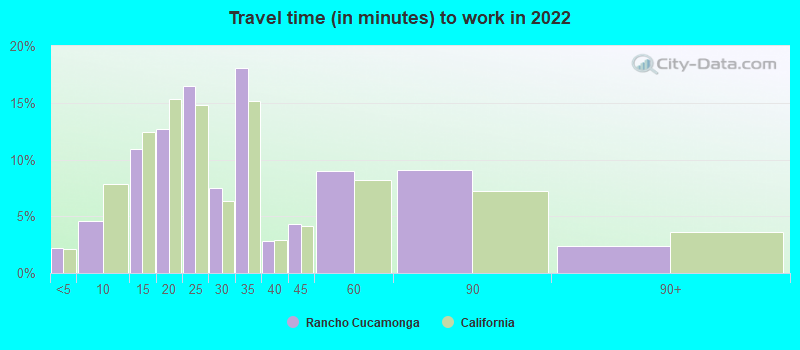
- Mean travel time to work (commute): 27.7 minutes
| Here: | 12.1 |
| California average: | 15.5 |
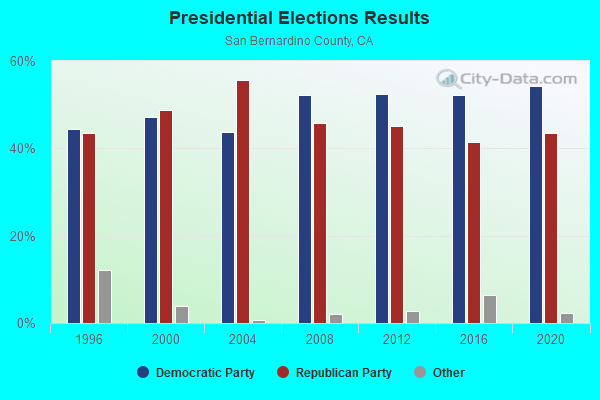
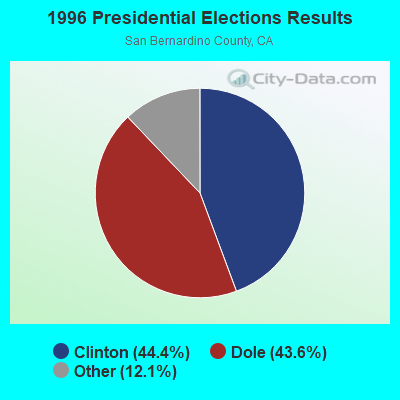
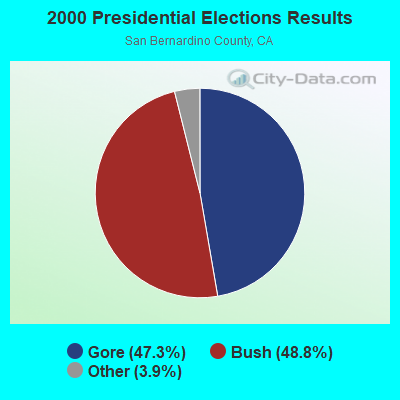
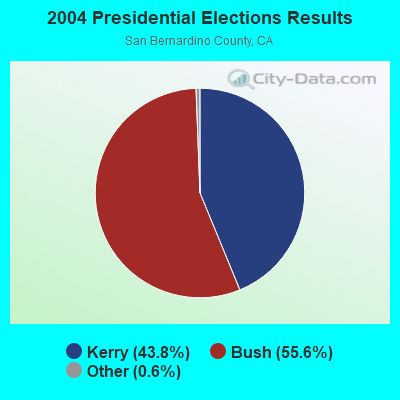
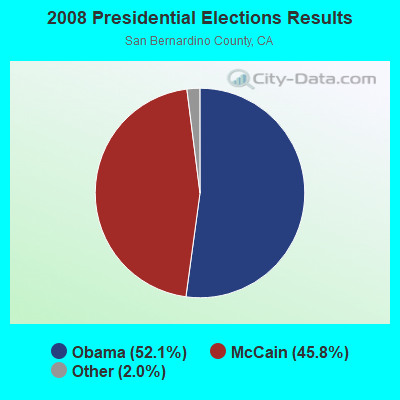
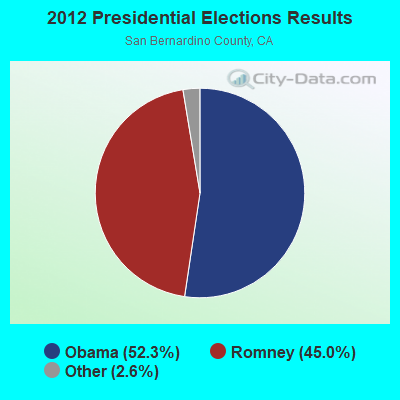
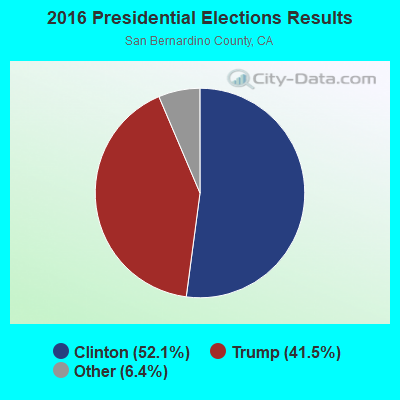
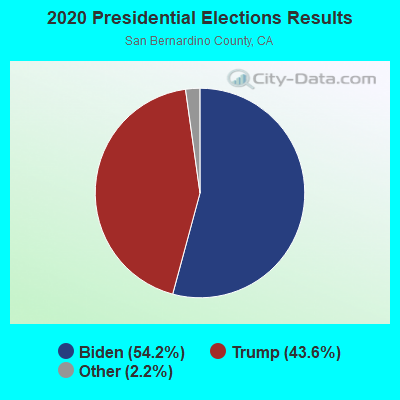
Graphs represent county-level data. Detailed 2008 Election Results
Political contributions by individuals in Rancho Cucamonga, CA
Neighborhoods in Rancho Cucamonga:
(Rancho Cucamonga, California Neighborhood Map)Religion statistics for Rancho Cucamonga, CA (based on San Bernardino County data)
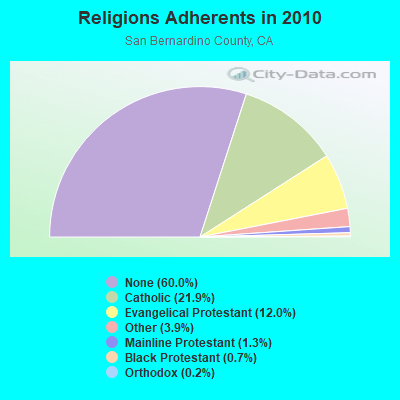
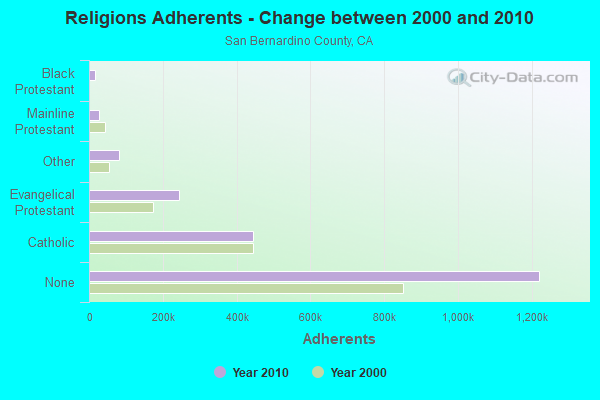
| Religion | Adherents | Congregations |
|---|---|---|
| Catholic | 445,334 | 55 |
| Evangelical Protestant | 243,524 | 832 |
| Other | 80,047 | 205 |
| Mainline Protestant | 26,062 | 135 |
| Black Protestant | 14,969 | 37 |
| Orthodox | 3,868 | 10 |
| None | 1,221,406 | - |
Food Environment Statistics:
| This county: | 1.50 / 10,000 pop. |
| State: | 2.14 / 10,000 pop. |
| This county: | 0.05 / 10,000 pop. |
| California: | 0.04 / 10,000 pop. |
| This county: | 0.57 / 10,000 pop. |
| State: | 0.62 / 10,000 pop. |
| San Bernardino County: | 1.60 / 10,000 pop. |
| State: | 1.49 / 10,000 pop. |
| This county: | 4.69 / 10,000 pop. |
| California: | 7.42 / 10,000 pop. |
| Here: | 7.4% |
| California: | 7.3% |
| San Bernardino County: | 27.1% |
| California: | 21.3% |
| Here: | 16.2% |
| State: | 17.9% |
Health and Nutrition:
| Here: | 50.0% |
| California: | 49.4% |
| This city: | 49.5% |
| California: | 48.0% |
| Rancho Cucamonga: | 28.4 |
| California: | 28.1 |
| This city: | 19.7% |
| California: | 20.2% |
| Here: | 10.0% |
| State: | 11.2% |
| Rancho Cucamonga: | 6.8 |
| California: | 6.8 |
| Rancho Cucamonga: | 32.8% |
| California: | 31.5% |
| This city: | 58.1% |
| State: | 56.4% |
| Rancho Cucamonga: | 82.2% |
| California: | 80.9% |
More about Health and Nutrition of Rancho Cucamonga, CA Residents
| Local government employment and payroll (March 2022) | |||||
| Function | Full-time employees | Monthly full-time payroll | Average yearly full-time wage | Part-time employees | Monthly part-time payroll |
|---|---|---|---|---|---|
| Solid Waste Management | 103 | $582,318 | $67,843 | 50 | $100,167 |
| Firefighters | 91 | $1,434,746 | $189,197 | 0 | $0 |
| Streets and Highways | 73 | $508,344 | $83,563 | 6 | $19,013 |
| Other Government Administration | 51 | $349,423 | $82,217 | 6 | $15,096 |
| Financial Administration | 46 | $327,819 | $85,518 | 6 | $15,697 |
| Parks and Recreation | 45 | $295,469 | $78,792 | 205 | $191,471 |
| Other and Unallocable | 29 | $201,403 | $83,339 | 7 | $14,752 |
| Local Libraries | 26 | $140,995 | $65,075 | 49 | $72,953 |
| Fire - Other | 24 | $212,432 | $106,216 | 5 | $8,122 |
| Totals for Government | 488 | $4,052,949 | $99,663 | 334 | $437,271 |
Rancho Cucamonga government finances - Expenditure in 2021 (per resident):
- Construction - Regular Highways: $17,669,000 ($100.20)
Police Protection: $11,400,000 ($64.65)
Local Fire Protection: $7,326,000 ($41.55)
General - Other: $2,761,000 ($15.66)
Health - Other: $731,000 ($4.15)
Parks and Recreation: $692,000 ($3.92)
Housing and Community Development: $3,000 ($0.02)
- Current Operations - Local Fire Protection: $85,257,000 ($483.49)
Police Protection: $43,507,000 ($246.73)
General - Other: $22,042,000 ($125.00)
Regular Highways: $20,291,000 ($115.07)
Central Staff Services: $18,598,000 ($105.47)
Protective Inspection and Regulation - Other: $11,715,000 ($66.44)
Electric Utilities: $9,800,000 ($55.58)
Libraries: $5,898,000 ($33.45)
Parks and Recreation: $5,676,000 ($32.19)
Health - Other: $5,122,000 ($29.05)
Solid Waste Management: $1,276,000 ($7.24)
Housing and Community Development: $606,000 ($3.44)
- General - Interest on Debt: $3,196,000 ($18.12)
Rancho Cucamonga government finances - Revenue in 2021 (per resident):
- Charges - Other: $20,290,000 ($115.06)
Parks and Recreation: $366,000 ($2.08)
- Federal Intergovernmental - Housing and Community Development: $1,655,000 ($9.39)
Other: $424,000 ($2.40)
- Local Intergovernmental - Other: $3,499,000 ($19.84)
- Miscellaneous - General Revenue - Other: $18,129,000 ($102.81)
Special Assessments: $16,987,000 ($96.33)
Interest Earnings: $7,251,000 ($41.12)
Fines and Forfeits: $1,344,000 ($7.62)
Rents: $363,000 ($2.06)
Donations From Private Sources: $249,000 ($1.41)
Sale of Property: $29,000 ($0.16)
- Revenue - Electric Utilities: $12,664,000 ($71.82)
- State Intergovernmental - Other: $16,731,000 ($94.88)
Highways: $7,095,000 ($40.24)
Electric Utilities: $489,000 ($2.77)
General Local Government Support: $227,000 ($1.29)
- Tax - Property: $159,416,000 ($904.05)
General Sales and Gross Receipts: $38,494,000 ($218.30)
Public Utilities Sales: $9,229,000 ($52.34)
Other License: $7,909,000 ($44.85)
Occupation and Business License - Other: $2,930,000 ($16.62)
Other Selective Sales: $2,727,000 ($15.46)
Documentary and Stock Transfer: $1,318,000 ($7.47)
Rancho Cucamonga government finances - Debt in 2021 (per resident):
- Long Term Debt - Beginning Outstanding - Unspecified Public Purpose: $79,924,000 ($453.25)
Outstanding Unspecified Public Purpose: $75,337,000 ($427.24)
Retired Unspecified Public Purpose: $4,587,000 ($26.01)
Rancho Cucamonga government finances - Cash and Securities in 2021 (per resident):
- Bond Funds - Cash and Securities: $9,978,000 ($56.59)
- Other Funds - Cash and Securities: $657,205,000 ($3727.00)
- Sinking Funds - Cash and Securities: $22,819,000 ($129.41)
6.45% of this county's 2021 resident taxpayers lived in other counties in 2020 ($54,954 average adjusted gross income)
| Here: | 6.45% |
| California average: | 5.19% |
0.03% of residents moved from foreign countries ($259 average AGI)
San Bernardino County: 0.03% California average: 0.03%
Top counties from which taxpayers relocated into this county between 2020 and 2021:
| from Los Angeles County, CA | |
| from Riverside County, CA | |
| from Orange County, CA |
6.46% of this county's 2020 resident taxpayers moved to other counties in 2021 ($59,647 average adjusted gross income)
| Here: | 6.46% |
| California average: | 6.14% |
0.03% of residents moved to foreign countries ($253 average AGI)
San Bernardino County: 0.03% California average: 0.02%
Top counties to which taxpayers relocated from this county between 2020 and 2021:
| to Riverside County, CA | |
| to Los Angeles County, CA | |
| to Orange County, CA |
| Businesses in Rancho Cucamonga, CA | ||||
| Name | Count | Name | Count | |
|---|---|---|---|---|
| 24 Hour Fitness | 1 | J. Jill | 1 | |
| 7-Eleven | 3 | JCPenney | 2 | |
| 99 Cents Only Stores | 1 | Jamba Juice | 1 | |
| ALDO | 1 | JoS. A. Bank | 1 | |
| AT&T | 2 | Johnny Rockets | 1 | |
| Abercrombie & Fitch | 1 | Jones New York | 4 | |
| Abercrombie Kids | 1 | Journeys | 1 | |
| Ace Hardware | 1 | KFC | 2 | |
| Aeropostale | 1 | Kroger | 4 | |
| Albertsons | 2 | LA Fitness | 1 | |
| American Eagle Outfitters | 1 | Lane Bryant | 2 | |
| Ann Taylor | 1 | Lane Furniture | 1 | |
| Apple Store | 1 | Levi Strauss & Co. | 1 | |
| Applebee's | 1 | Little Caesars Pizza | 1 | |
| Arby's | 1 | Lowe's | 1 | |
| AutoZone | 2 | Macy's | 1 | |
| Avenue | 1 | Marriott | 2 | |
| Bakers | 1 | MasterBrand Cabinets | 8 | |
| Bally Total Fitness | 1 | McDonald's | 5 | |
| Banana Republic | 1 | Men's Wearhouse | 1 | |
| Barnes & Noble | 1 | Motherhood Maternity | 2 | |
| Baskin-Robbins | 3 | New Balance | 2 | |
| Bath & Body Works | 2 | Nike | 13 | |
| Bebe | 1 | Office Depot | 1 | |
| Ben & Jerry's | 1 | OfficeMax | 1 | |
| Best Western | 1 | Old Navy | 1 | |
| Big O Tires | 1 | On The Border | 1 | |
| Blockbuster | 2 | Pac Sun | 1 | |
| Brookstone | 1 | Panda Express | 2 | |
| Brunswick Bowling & Billiards | 1 | Panera Bread | 1 | |
| Buffalo Wild Wings | 1 | Papa John's Pizza | 1 | |
| CVS | 2 | Payless | 2 | |
| Cache | 1 | Penske | 1 | |
| Carl\s Jr. | 3 | PetSmart | 1 | |
| Casual Male XL | 1 | Pier 1 Imports | 1 | |
| Chick-Fil-A | 1 | Pizza Hut | 2 | |
| Chico's | 1 | Popeyes | 1 | |
| Chipotle | 3 | Pottery Barn | 1 | |
| Chuck E. Cheese's | 1 | Quiznos | 3 | |
| Circle K | 2 | Red Robin | 1 | |
| Cold Stone Creamery | 1 | Rite Aid | 3 | |
| Coldwater Creek | 1 | Ryder Rental & Truck Leasing | 1 | |
| Costco | 1 | SONIC Drive-In | 1 | |
| Crate & Barrel | 1 | Safeway | 2 | |
| Curves | 2 | Sephora | 2 | |
| DHL | 1 | Skechers USA | 1 | |
| Dairy Queen | 1 | Sprint Nextel | 3 | |
| Decora Cabinetry | 2 | Starbucks | 11 | |
| Dennys | 1 | T-Mobile | 7 | |
| Domino's Pizza | 1 | T.G.I. Driday's | 1 | |
| Eddie Bauer | 1 | Taco Bell | 4 | |
| El Pollo Loco | 2 | Target | 1 | |
| FedEx | 15 | The Cheesecake Factory | 1 | |
| Finish Line | 1 | The Room Place | 1 | |
| Forever 21 | 1 | Trader Joe's | 1 | |
| GameStop | 2 | U-Haul | 5 | |
| Gap | 2 | UPS | 13 | |
| Gymboree | 1 | Urban Outfitters | 1 | |
| H&M | 1 | Vans | 4 | |
| H&R Block | 3 | Verizon Wireless | 4 | |
| Hobby Lobby | 1 | Victoria's Secret | 1 | |
| Holiday Inn | 1 | Vons | 2 | |
| Home Depot | 1 | Walgreens | 2 | |
| HomeTown Buffet | 1 | Walmart | 1 | |
| Hot Topic | 1 | Wendy's | 3 | |
| IHOP | 1 | YMCA | 2 | |
Strongest AM radio stations in Rancho Cucamonga:
- KSPA (1510 AM; 10 kW; ONTARIO, CA; Owner: ONTARIO BROADCASTING, LLC)
- KPLS (830 AM; 50 kW; ORANGE, CA; Owner: CRN LICENSES, LLC)
- KLAC (570 AM; 50 kW; LOS ANGELES, CA; Owner: AMFM RADIO LICENSES, L.L.C.)
- KTNQ (1020 AM; 50 kW; LOS ANGELES, CA; Owner: KTNQ-AM LICENSE CORP.)
- KFI (640 AM; 50 kW; LOS ANGELES, CA; Owner: CAPSTAR TX LIMITED PARTNERSHIP)
- KDIS (1110 AM; 50 kW; PASADENA, CA; Owner: ABC,INC.)
- KXTA (1150 AM; 50 kW; LOS ANGELES, CA; Owner: CITICASTERS LICENSES, L.P.)
- KFWB (980 AM; 50 kW; LOS ANGELES, CA; Owner: INFINITY BROADCASTING OPERATIONS, INC.)
- KSPN (710 AM; 50 kW; LOS ANGELES, CA; Owner: KABC-AM RADIO, INC.)
- KMNY (1600 AM; 5 kW; POMONA, CA; Owner: MULTICULTURAL RADIO BROADCASTING, INC.)
- KMPC (1540 AM; 50 kW; LOS ANGELES, CA; Owner: ROSE CITY RADIO CORPORATION)
- KBLA (1580 AM; 50 kW; SANTA MONICA, CA)
- KNX (1070 AM; 50 kW; LOS ANGELES, CA; Owner: INFINITY BROADCASTING OPERATIONS, INC.)
Strongest FM radio stations in Rancho Cucamonga:
- K264AF (100.7 FM; GUASTI, CA; Owner: EDUCATIONAL MEDIA FOUNDATION)
- K295AI (106.9 FM; MUSCOY, CA; Owner: ASSOCIATION FOR COMMUNITY EDUCATION, INC.)
- KUOR-FM (89.1 FM; REDLANDS, CA; Owner: UNIVERSITY OF REDLANDS)
- KCBS-FM (93.1 FM; LOS ANGELES, CA; Owner: INFINITY BROADCASTING OPERATIONS, INC.)
- KSCA (101.9 FM; GLENDALE, CA; Owner: HBC LICENSE CORPORATION)
- KLOS (95.5 FM; LOS ANGELES, CA; Owner: KLOS-FM RADIO, INC.)
- K212FA (90.3 FM; TEMPLE CITY, CA; Owner: EDUCATIONAL MEDIA FOUNDATION)
- KOST (103.5 FM; LOS ANGELES, CA; Owner: CAPSTAR TX LIMITED PARTNERSHIP)
- KLVE (107.5 FM; LOS ANGELES, CA; Owner: KLVE-FM LICENSE CORP.)
- KIIS-FM (102.7 FM; LOS ANGELES, CA; Owner: CITICASTERS LICENSES, L.P.)
- KRCV (98.3 FM; WEST COVINA, CA; Owner: HBC LICENSE CORPORATION)
- KPCC (89.3 FM; PASADENA, CA; Owner: PASADENA AREA COMMUNITY COLLEGE DISTRICT)
- KHHT (92.3 FM; LOS ANGELES, CA; Owner: AMFM RADIO LICENSES, L.L.C.)
- KBIG-FM (104.3 FM; LOS ANGELES, CA; Owner: AMFM RADIO LICENSES, L.L.C.)
- KMZT-FM (105.1 FM; LOS ANGELES, CA; Owner: MOUNT WILSON FM BROADCASTERS, INC.)
- KCXX (103.9 FM; LAKE ARROWHEAD, CA; Owner: ALL-PRO BROADCASTING, INC.)
- KTWV (94.7 FM; LOS ANGELES, CA; Owner: INFINITY BROADCASTING OPERATIONS, INC.)
- KPFK (90.7 FM; LOS ANGELES, CA; Owner: PACIFICA FOUNDATION, INC)
- K216EM (91.1 FM; ARCADIA, CA; Owner: LIFE ON THE WAY COMMUNICATIONS, INC.)
- KOLA (99.9 FM; SAN BERNARDINO, CA; Owner: INLAND EMPIRE BROADCASTING CORP.)
TV broadcast stations around Rancho Cucamonga:
- KTRO-LP (Channel 50; LANCASTER, CA; Owner: ROBERT D. ADELMAN)
- KHIZ (Channel 64; BARSTOW, CA; Owner: SUNBELT TELEVISION, INC.)
- KCBS-TV (Channel 2; LOS ANGELES, CA; Owner: CBS BROADCASTING INC.)
- KRCA (Channel 62; RIVERSIDE, CA; Owner: KRCA LICENSE CORP.)
- KPXN (Channel 30; SAN BERNARDINO, CA; Owner: PAXSON LOS ANGELES LICENSE, INC.)
- KTLA-TV (Channel 5; LOS ANGELES, CA; Owner: KTLA INC.)
- KABC-TV (Channel 7; LOS ANGELES, CA; Owner: ABC HOLDING COMPANY, INC.)
- KCAL-TV (Channel 9; LOS ANGELES, CA; Owner: VIACOM TELEVISION STATIONS GROUP OF LOS ANGELES LLC)
- KNBC (Channel 4; LOS ANGELES, CA; Owner: NBC SUBSIDIARY (KNBC-TV), INC.)
- KVCR-TV (Channel 24; SAN BERNARDINO, CA; Owner: SAN BERNARDINO COMMUNITY COLLEGE DISTRICT)

- National Bridge Inventory (NBI) Statistics
- 155Number of bridges
- 1,831ft / 558mTotal length
- 7,745,903Total average daily traffic
- 493,264Total average daily truck traffic
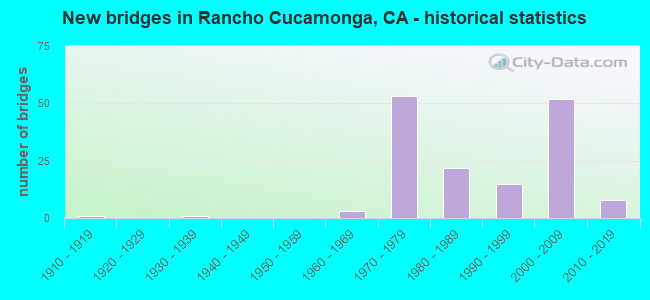
- New bridges - historical statistics
- 11910-1919
- 11930-1939
- 31960-1969
- 531970-1979
- 221980-1989
- 151990-1999
- 522000-2009
- 82010-2019
FCC Registered Private Land Mobile Towers: 1 (See the full list of FCC Registered Private Land Mobile Towers in Rancho Cucamonga, CA)
FCC Registered Broadcast Land Mobile Towers: 69 (See the full list of FCC Registered Broadcast Land Mobile Towers)
FCC Registered Microwave Towers: 102 (See the full list of FCC Registered Microwave Towers in this town)
FCC Registered Paging Towers: 1 (See the full list of FCC Registered Paging Towers)
FCC Registered Amateur Radio Licenses: 624 (See the full list of FCC Registered Amateur Radio Licenses in Rancho Cucamonga)
FAA Registered Aircraft Manufacturers and Dealers: 4 (See the full list of FAA Registered Manufacturers and Dealers in Rancho Cucamonga)
FAA Registered Aircraft: 98 (See the full list of FAA Registered Aircraft)
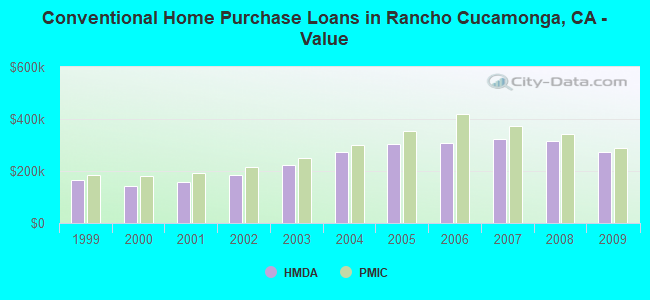
| Home Mortgage Disclosure Act Aggregated Statistics For Year 2009 (Based on 7 full and 4 partial tracts) | ||||||||||||||
| A) FHA, FSA/RHS & VA Home Purchase Loans | B) Conventional Home Purchase Loans | C) Refinancings | D) Home Improvement Loans | E) Loans on Dwellings For 5+ Families | F) Non-occupant Loans on < 5 Family Dwellings (A B C & D) | G) Loans On Manufactured Home Dwelling (A B C & D) | ||||||||
|---|---|---|---|---|---|---|---|---|---|---|---|---|---|---|
| Number | Average Value | Number | Average Value | Number | Average Value | Number | Average Value | Number | Average Value | Number | Average Value | Number | Average Value | |
| LOANS ORIGINATED | 753 | $284,393 | 826 | $271,294 | 2,407 | $262,143 | 112 | $184,717 | 4 | $25,967,675 | 198 | $211,282 | 13 | $68,108 |
| APPLICATIONS APPROVED, NOT ACCEPTED | 60 | $258,681 | 134 | $261,593 | 309 | $278,991 | 44 | $40,253 | 0 | $0 | 32 | $209,437 | 13 | $64,828 |
| APPLICATIONS DENIED | 110 | $281,763 | 201 | $256,000 | 841 | $301,174 | 63 | $120,349 | 0 | $0 | 93 | $228,984 | 25 | $63,086 |
| APPLICATIONS WITHDRAWN | 134 | $266,936 | 138 | $295,771 | 553 | $288,736 | 36 | $162,602 | 1 | $165,380 | 42 | $232,024 | 0 | $0 |
| FILES CLOSED FOR INCOMPLETENESS | 25 | $287,886 | 39 | $272,590 | 187 | $295,359 | 6 | $152,682 | 0 | $0 | 17 | $227,119 | 2 | $82,535 |
Detailed mortgage data for all 11 tracts in Rancho Cucamonga, CA
| Private Mortgage Insurance Companies Aggregated Statistics For Year 2009 (Based on 7 full and 3 partial tracts) | ||||
| A) Conventional Home Purchase Loans | B) Refinancings | |||
|---|---|---|---|---|
| Number | Average Value | Number | Average Value | |
| LOANS ORIGINATED | 88 | $287,173 | 24 | $298,225 |
| APPLICATIONS APPROVED, NOT ACCEPTED | 46 | $281,314 | 21 | $320,274 |
| APPLICATIONS DENIED | 17 | $280,788 | 12 | $364,497 |
| APPLICATIONS WITHDRAWN | 8 | $289,109 | 4 | $275,508 |
| FILES CLOSED FOR INCOMPLETENESS | 9 | $422,976 | 1 | $394,000 |

2005 - 2018 National Fire Incident Reporting System (NFIRS) incidents
- Fire incident types reported to NFIRS in Rancho Cucamonga, CA
- 1,05840.2%Outside Fires
- 92235.0%Structure Fires
- 57721.9%Mobile Property/Vehicle Fires
- 752.8%Other
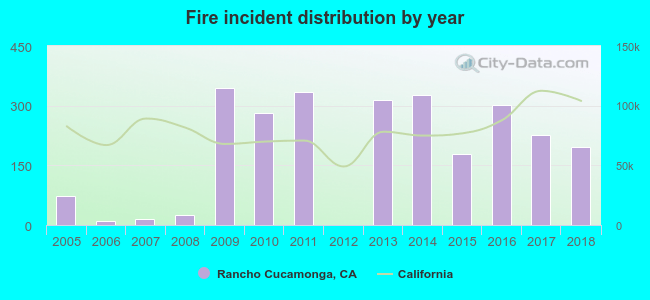 Based on the data from the years 2005 - 2018 the average number of fires per year is 188. The highest number of fire incidents - 345 took place in 2009, and the least - 1 in 2012. The data has a rising trend.
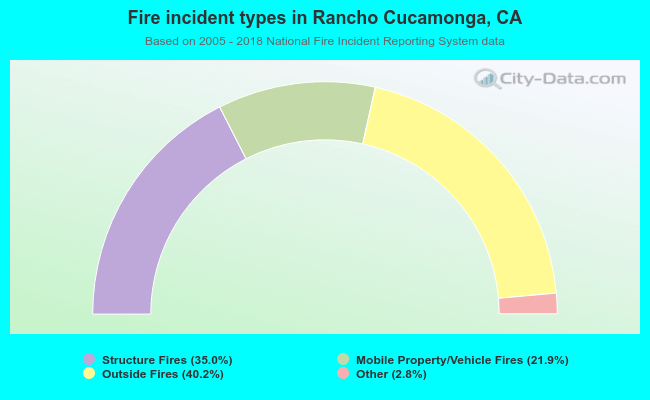 When looking into fire subcategories, the most reports belonged to: Outside Fires (40.2%), and Structure Fires (35.0%).
Fire-safe hotels and motels in Rancho Cucamonga, California:
- Best Western Heritage Inn, 8179 Spruce Ave, Rancho Cucamonga, California 91730 , Phone: (909) 466-1111, Fax: (909) 466-3876
- Holiday Inn Express Hotel & Suites, 9589 Milliken Ave, Rancho Cucamonga, California 91730 , Phone: (909) 472-9012, Fax: (909) 472-9016
- Towneplace Suites, 9625 Milliken Ave, Rancho Cucamonga, California 91730 , Phone: (909) 466-1100, Fax: (909) 466-1101
- Courtyard By Marriott, 11525 Msn Vista Dr, Rancho Cucamonga, California 91730 , Phone: (909) 481-6476, Fax: (909) 481-0260
- Homewood Suites, 11433 Mission Vista Dr, Rancho Cucamonga, California 91730 , Phone: (909) 481-6480, Fax: (909) 481-0313
- Hilton Garden Inn, 11481 Msn Vista Dr, Rancho Cucamonga, California 91730 , Phone: (909) 481-1800, Fax: (909) 481-5001
- Aloft Ontario-Rancho Cucamonga, 10480 Fourth St, Rancho Cucamonga, California 91730 , Phone: (909) 484-2018, Fax: (909) 484-6491
- Four Points by Sheraton, 11960 Foothill Blvd, Rancho Cucamonga, California 91739 , Phone: (909) 204-6100, Fax: (909) 204-6111
- Residence Inn by Marriott Ontario/Rancho Cucamonga, 9299 Haven Ave, Rancho Cucamonga, California 91730 , Phone: (909) 367-5855
| Most common first names in Rancho Cucamonga, CA among deceased individuals | ||
| Name | Count | Lived (average) |
|---|---|---|
| Mary | 128 | 78.0 years |
| John | 113 | 72.3 years |
| William | 101 | 72.4 years |
| Robert | 93 | 71.1 years |
| James | 71 | 69.2 years |
| Charles | 64 | 69.8 years |
| Joseph | 58 | 71.7 years |
| Helen | 57 | 81.8 years |
| George | 55 | 72.4 years |
| Frank | 52 | 73.4 years |
| Most common last names in Rancho Cucamonga, CA among deceased individuals | ||
| Last name | Count | Lived (average) |
|---|---|---|
| Smith | 56 | 70.6 years |
| Martinez | 44 | 74.5 years |
| Johnson | 37 | 73.5 years |
| Garcia | 30 | 72.0 years |
| Rodriguez | 25 | 69.8 years |
| Hernandez | 25 | 75.3 years |
| Jones | 24 | 71.1 years |
| Perez | 23 | 68.2 years |
| Brown | 22 | 71.0 years |
| Anderson | 22 | 73.4 years |

- 83.9%Utility gas
- 11.9%Electricity
- 2.2%Bottled, tank, or LP gas
- 0.8%Solar energy
- 0.8%No fuel used
- 0.2%Fuel oil, kerosene, etc.
- 0.1%Wood
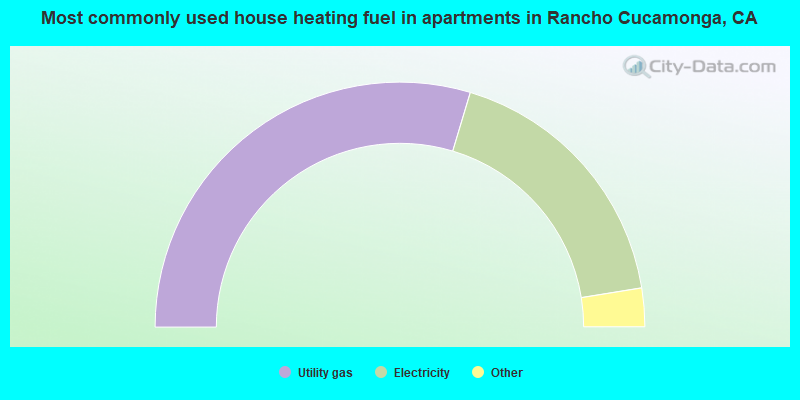
- 59.3%Utility gas
- 35.6%Electricity
- 2.1%Bottled, tank, or LP gas
- 1.9%No fuel used
- 0.7%Other fuel
- 0.3%Wood
Rancho Cucamonga compared to California state average:
- Unemployed percentage significantly below state average.
- Black race population percentage above state average.
- House age below state average.
- Percentage of population with a bachelor's degree or higher above state average.
Rancho Cucamonga, CA compared to other similar cities:
Rancho Cucamonga on our top lists:
- #20 on the list of "Top 100 cities with highest median household income and median resident age less than 35 (pop. 50,000+)"
- #22 on the list of "Top 101 cities with largest percentage of males in occupations: health diagnosing and treating practitioners and other technical occupations (population 50,000+)"
- #24 on the list of "Top 101 cities with largest percentage of females in industries: utilities (population 50,000+)"
- #29 on the list of "Top 101 cities with largest percentage of females in industries: real estate and rental and leasing (population 50,000+)"
- #35 on the list of "Top 101 larger cities with the highest increase in house/condo value from 2000 (population 50,000+)"
- #48 on the list of "Top 101 cities with largest percentage of females in industries: public administration (population 50,000+)"
- #51 on the list of "Top 101 cities with largest percentage of males in occupations: fire fighting and prevention workers including supervisors (population 50,000+)"
- #57 on the list of "Top 101 cities with the highest percentage of family households, population 100,000+"
- #62 on the list of "Top 101 cities with the smallest sunshine amount differences during a year (population 50,000+)"
- #67 on the list of "Top 101 cities with largest percentage of males in industries: health care and social assistance (population 50,000+)"
- #69 on the list of "Top 101 cities with largest percentage of males in occupations: law enforcement workers including supervisors (population 50,000+)"
- #71 on the list of "Top 101 cities with largest percentage of females in industries: wholesale trade (population 50,000+)"
- #74 on the list of "Top 101 cities with largest percentage of males in industries: utilities (population 50,000+)"
- #83 on the list of "Top 101 cities with largest percentage of males in occupations: business and financial operations occupations (population 50,000+)"
- #83 on the list of "Top 101 cities with the largest percentage of people in other nonhousehold living situations (population 1,000+)"
- #86 on the list of "Top 101 cities with largest percentage of females in occupations: community and social service occupations (population 50,000+)"
- #87 on the list of "Top 101 cities with the largest city-data.com crime index increase from 2011 to 2012 (population 50,000+)"
- #88 on the list of "Top 101 cities with the lowest number of rapes per 100,000 residents (population 50,000+)"
- #88 on the list of "Top 101 cities with the most cars per house, population 50,000+"
- #90 on the list of "Top 100 most racially diverse cities (pop. 50,000+)"
- #82 (91737) on the list of "Top 101 zip codes with the largest percentage of Arab first ancestries (pop 5,000+)"
- #5 on the list of "Top 101 counties with the highest Nitrogen Dioxide air pollution readings in 2012 (ppm)"
- #5 on the list of "Top 101 counties with the highest ground withdrawal of fresh water for public supply"
- #10 on the list of "Top 101 counties with the most Evangelical Protestant congregations"
- #14 on the list of "Top 101 counties with the highest total withdrawal of fresh water for public supply"
- #15 on the list of "Top 101 counties with the most Evangelical Protestant adherents (pop. 50,000+)"

|
|
Total of 423 patent applications in 2008-2024.