Housing density: 1,684 houses/condos per square mile
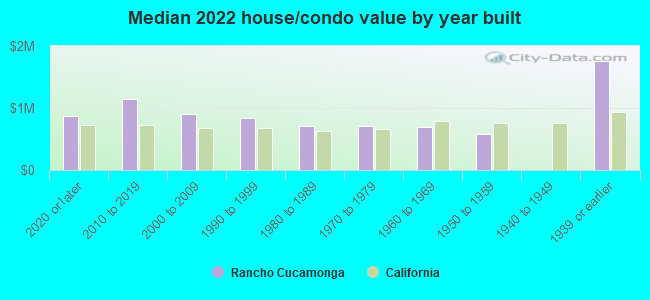
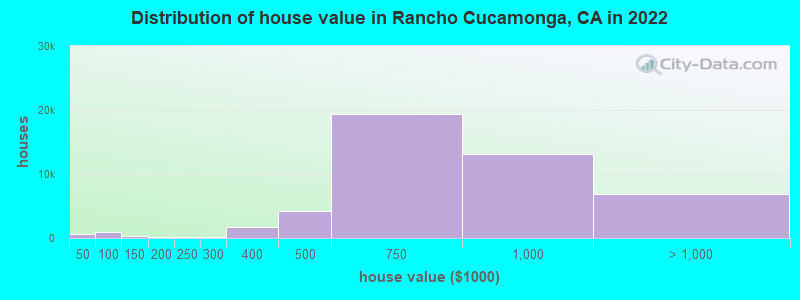
Median price asked for vacant for-sale houses and condos in 2022: $873,067.
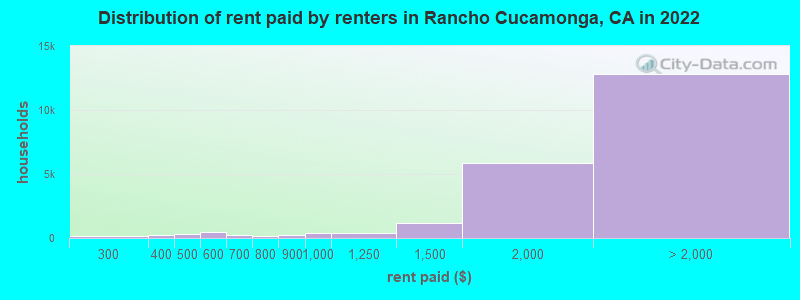
Median contract rent in 2022: over $2,000 (lower quartile is $1,637, upper quartile is over $2,000)
Median rent asked for vacant for-rent units in 2022: $3,357
Median gross rent in Rancho Cucamonga, CA in 2022: over $2,000
Housing units in Rancho Cucamonga with a mortgage: 27,805 (2,630 second mortgage, 0 home equity loan, 2,126 both second mortgage and home equity loan) Houses without a mortgage: 452
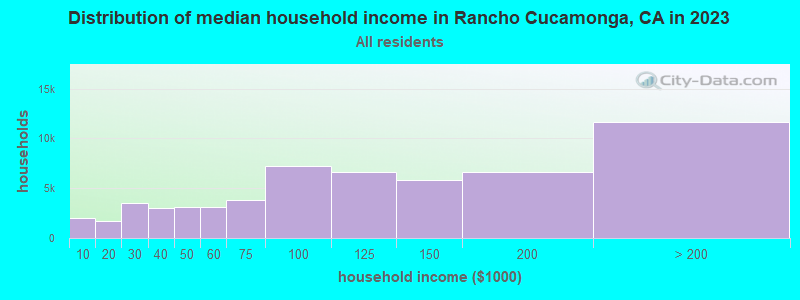
Median household income for houses/condos with a mortgage: $143,608
Median household income for apartments without a mortgage: $103,977
Median monthly housing costs: $2,239
Compare current foreclosures in Rancho Cucamonga, CA:
Size of family households: 17,561 2-persons, 12,647 3-persons, 9,575 4-persons, 5,644 5-persons, 775 6-persons, 697 7-or-more-persons.
Size of nonfamily households: 11,488 1-person, 1,915 2-persons, 43 3-persons.
29,525 married couples with children.
5,752 single-parent households (1,331 men, 4,421 women).
65.9% of residents of Rancho Cucamonga speak English at home.
19.7% of residents speak Spanish at home (80% speak English very well, 13% speak English well, 6% speak English not well, 1% don't speak English at all).
2.7% of residents speak other Indo-European language at home (79% speak English very well, 6% speak English well, 7% speak English not well, 9% don't speak English at all).
9.6% of residents speak Asian or Pacific Island language at home (58% speak English very well, 27% speak English well, 11% speak English not well, 5% don't speak English at all).
2.1% of residents speak other language at home (58% speak English very well, 30% speak English well, 12% speak English not well).
Foreign born population: 32,685 (18.5%)
(66.2% of them are naturalized citizens)
Percentage of workers working in this county: 71.0% Number of people working at home: 12,721 (15.1% of all workers)
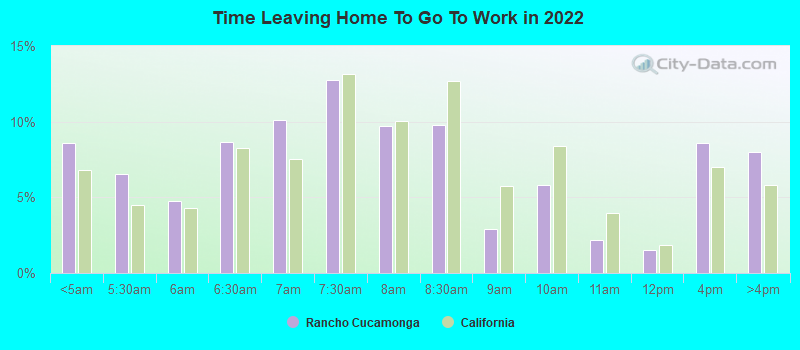
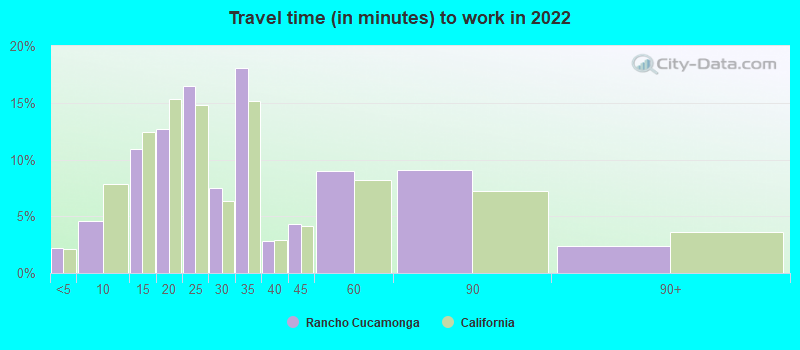
Travel time to work (commute)
Less than 5 minutes: 1,419
5 to 9 minutes: 4,231
10 to 14 minutes: 6,733
15 to 19 minutes: 6,228
20 to 24 minutes: 12,321
25 to 29 minutes: 4,385
30 to 34 minutes: 11,168
35 to 39 minutes: 2,933
40 to 44 minutes: 3,276
45 to 59 minutes: 6,269
60 to 89 minutes: 9,322
90 or more minutes: 3,002
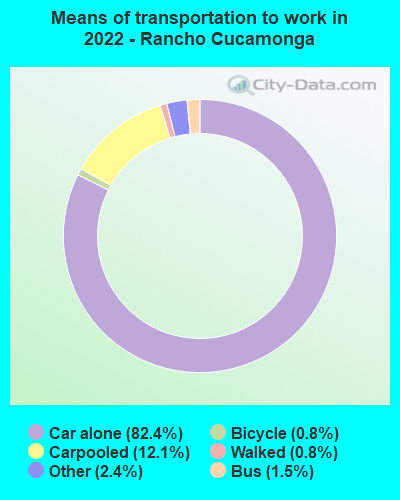
Means of transportation to work:
Drove a car alone: 52,327 (68.6%)
Carpooled: 7,690 (10.1%)
Bus: 930 (1.2%)
Taxi: 1,550 (2.0%)
Bicycle: 504 (0.7%)
Walked: 531 (0.7%)
Worked at home: 12,721 (16.7%)
Unemployment by race in 2022
Unemployment rate for White non-Hispanic residents
6.9%Males
8.3%Females
Unemployment rate for Black residents
24.0%Females
Unemployment rate for Asian residents
4.1%Males
3.6%Females
Unemployment rate for other race residents
3.6%Males
7.4%Females
Unemployment rate for two or more race residents
3.2%Males
9.0%Females
Unemployment rate for Hispanic or Latino residents
3.1%Males
5.9%Females
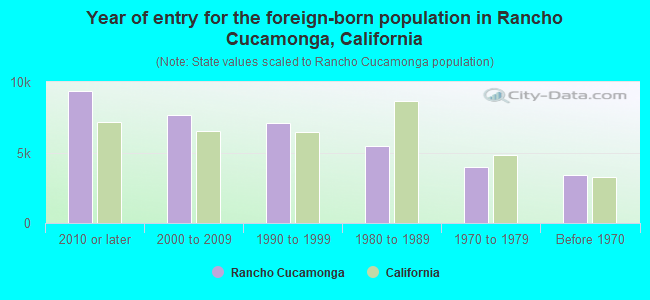
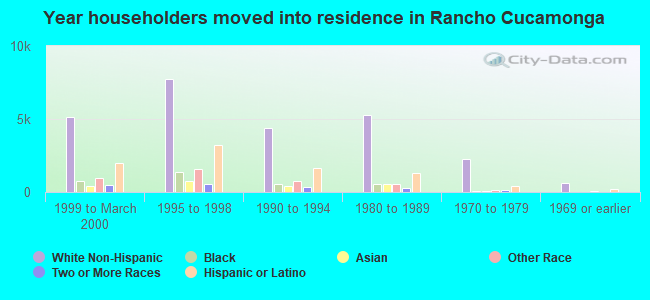
Year of entry for the foreign-born population in Rancho Cucamonga, California
9,3652010 or later
7,6552000 to 2009
7,0591990 to 1999
5,4481980 to 1989
3,9461970 to 1979
3,409Before 1970
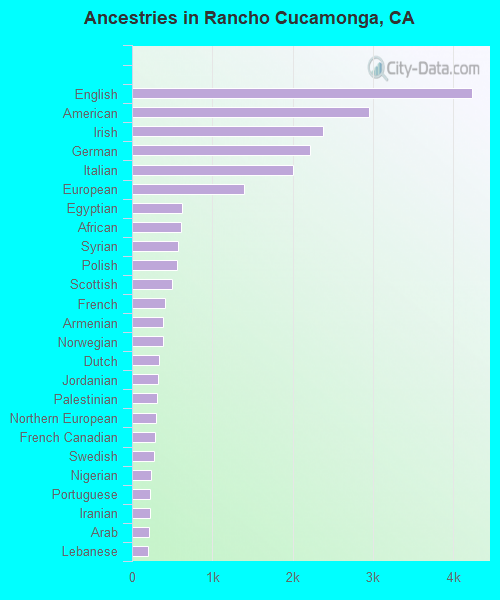
First ancestries reported:
English: 4,234 (4.4%)
American: 2,955 (3.1%)
Irish: 2,381 (2.5%)
German: 2,213 (2.3%)
Italian: 2,010 (2.1%)
European: 1,390 (1.5%)
Egyptian: 622 (0.6%)
African: 606 (0.6%)
Syrian: 575 (0.6%)
Polish: 556 (0.6%)
Scottish: 497 (0.5%)
French: 408 (0.4%)
Armenian: 391 (0.4%)
Norwegian: 388 (0.4%)
Dutch: 336 (0.4%)
Jordanian: 318 (0.3%)
Palestinian: 314 (0.3%)
Northern European: 301 (0.3%)
French Canadian: 287 (0.3%)
Swedish: 274 (0.3%)
Nigerian: 238 (0.2%)
Portuguese: 228 (0.2%)
Iranian: 228 (0.2%)
Arab: 207 (0.2%)
Lebanese: 202 (0.2%)
Trinidadian and Tobagonian: 202 (0.2%)
Scotch-Irish: 178 (0.2%)
Ghanaian: 166 (0.2%)
British: 162 (0.2%)
Afghan: 153 (0.2%)
Ukrainian: 133 (0.1%)
Welsh: 128 (0.1%)
Belizean: 127 (0.1%)
Russian: 119 (0.1%)
Danish: 117 (0.1%)
Jamaican: 106 (0.1%)
Eastern European: 103 (0.1%)
Canadian: 99 (0.1%)
Scandinavian: 96 (0.1%)
Czech: 80 (0.08%)
West Indian: 79 (0.08%)
Basque: 64 (0.07%)
Iraqi: 59 (0.06%)
Guyanese: 51 (0.05%)
Maltese: 51 (0.05%)
Greek: 44 (0.05%)
Austrian: 42 (0.04%)
Hungarian: 38 (0.04%)
Serbian: 37 (0.04%)
Finnish: 35 (0.04%)
Lithuanian: 35 (0.04%)
Haitian: 34 (0.04%)
Turkish: 34 (0.04%)
Romanian: 28 (0.03%)
Sudanese: 28 (0.03%)
Slovene: 27 (0.03%)
Croatian: 22 (0.02%)
Yugoslavian: 22 (0.02%)
Slovak: 21 (0.02%)
Czechoslovakian: 19 (0.02%)
Celtic: 13 (0.01%)
Slavic: 12 (0.01%)
Swiss: 9 (0.01%)
Moroccan: 7 (0.01%)
Cape Verdean: 7 (0.01%)
Estonian: 6 (0.01%)
Most common places of birth for foreign-born residents (%):
Mexico
Rancho Cucamonga:
24.9% (8,808)
California:
37.2% (3,881,193)
China, excluding Hong Kong and Taiwan
Rancho Cucamonga:
11.7% (4,138)
California:
6.6% (684,672)
Philippines
Rancho Cucamonga:
8.5% (3,021)
California:
7.8% (818,297)
India
Rancho Cucamonga:
5.3% (1,892)
California:
5.2% (539,184)
Korea
Rancho Cucamonga:
4.4% (1,558)
California:
3.0% (315,248)
Egypt
Rancho Cucamonga:
2.8% (1,006)
California:
0.4% (42,718)
Taiwan
Rancho Cucamonga:
2.8% (998)
California:
1.7% (176,274)
Vietnam
Rancho Cucamonga:
2.7% (962)
California:
4.9% (512,335)
El Salvador
Rancho Cucamonga:
2.7% (938)
California:
4.2% (440,287)
Peru
Rancho Cucamonga:
2.3% (823)
California:
0.7% (74,025)
Colombia
Rancho Cucamonga:
2.1% (726)
California:
0.5% (55,249)
Indonesia
Rancho Cucamonga:
1.9% (672)
California:
0.4% (39,097)
Hong Kong
Rancho Cucamonga:
1.7% (595)
California:
1.0% (105,215)
Guatemala
Rancho Cucamonga:
1.7% (589)
California:
2.8% (290,436)
Place of birth for U.S.-born residents:
This state: 118,244
Other state: 21,928
Northeast: 5,031
Midwest: 7,133
South: 6,957
West: 2,807
89.5% of Rancho Cucamonga residents lived in the same house 1 years ago. Out of people who lived in different houses, 38.1% lived in this county. Out of people who lived in different counties, 70.7% lived in California.
Rancho Cucamonga:
89.5%
State average:
88.9%
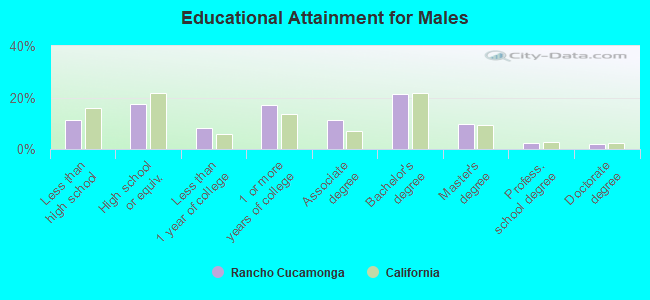
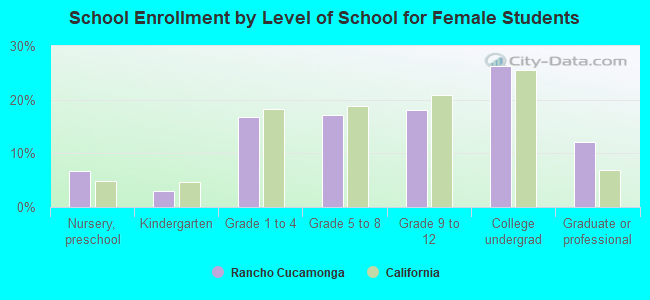
Education attainment for males 25 years and older:
No schooling: 2,195
Nursery to 4th grade: 76
5th and 6th grade: 884
7th and 8th grade: 227
9th grade: 1,123
10th grade: 217
11th grade: 780
12th grade, no diploma: 1,262
High school graduate (or equivalency): 10,608
Less than 1 year of college: 4,967
Some college more than 1 year, no degree: 10,311
Associate degree: 6,840
Bachelor's degree: 12,869
Master's degree: 5,811
Professional school degree: 1,342
Doctorate degree: 1,178
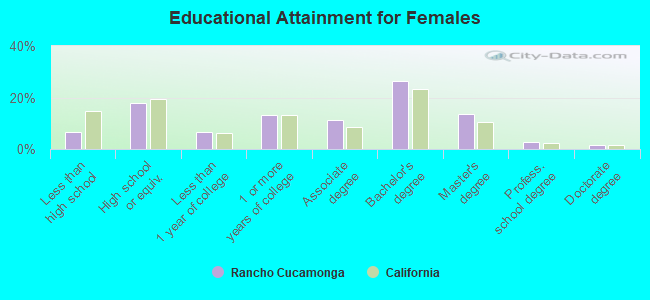
Education attainment for females 25 years and older:
No schooling: 1,073
Nursery to 4th grade: 210
5th and 6th grade: 431
7th and 8th grade: 181
9th grade: 0
10th grade: 50
11th grade: 315
12th grade, no diploma: 2,116
High school graduate (or equivalency): 11,561
Less than 1 year of college: 4,361
Some college more than 1 year, no degree: 8,591
Associate degree: 7,274
Bachelor's degree: 17,151
Master's degree: 8,975
Professional school degree: 1,860
Doctorate degree: 1,073
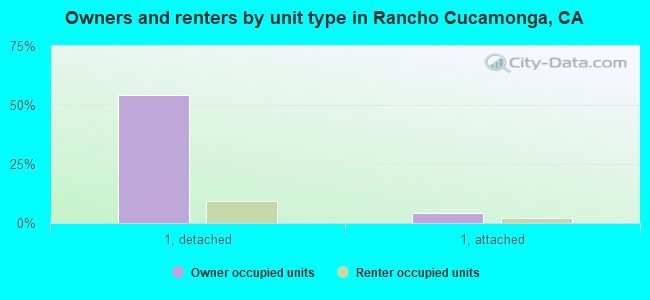
Housing units in structures:
One, detached: 40,526
One, attached: 4,605
Two: 85
3 or 4: 3,526
5 to 9: 2,749
10 to 19: 1,909
20 to 49: 1,646
50 or more: 6,661
Mobile homes: 1,254
Boats, RVs, vans, etc.: 86
Median worth of mobile homes: $172,200
Housing units lacking complete plumbing facilities in 2022: 0.6%
Housing units lacking complete kitchen facilities in 2022: 1.6%
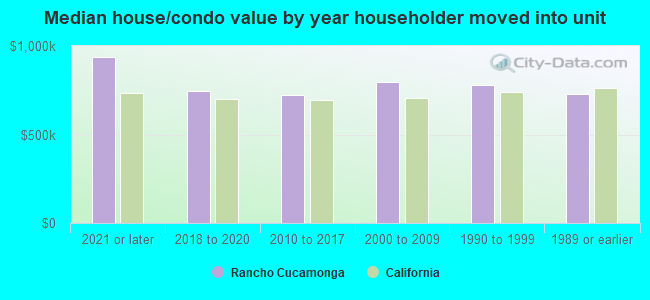
House/condo owner moved in on average 13 years ago