Ontario, California
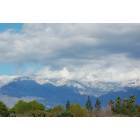
Ontario: Snow on the peaks, palm trees down in the valley.
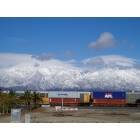
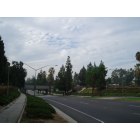
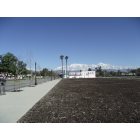
Ontario: MISSION & GROVE /AFTER THE RAIN IN ONTARIO,CA.
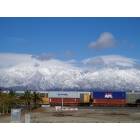
Ontario: MISSION & GROVE / A DAY AFTER THE RAIN IN ONTARIO, CA.
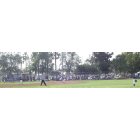
Ontario: Homer Briggs Park Baseball Field
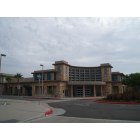
Ontario: Ontario, CA
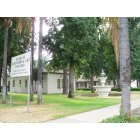
Ontario: Ontario, CA
Ontario: Ontario, CA
Ontario: Ontario, CA
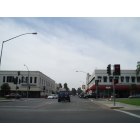
Ontario: View of Euclid Avenue at C Street Ontario, CA

Ontario: Citizens Business Bank Arena
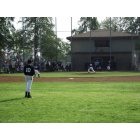
Ontario: Homer Briggs Park Baseball Field
- see
36
more - add
your
Submit your own pictures of this city and show them to the world
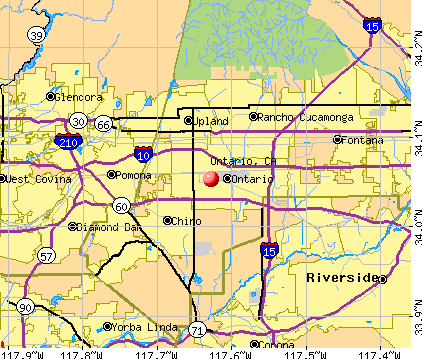
- OSM Map
- General Map
- Google Map
- MSN Map
Population change since 2000: +13.3%
 |
| Males: 87,095 | |
| Females: 91,966 |
| Median resident age: | 33.6 years |
| California median age: | 37.9 years |
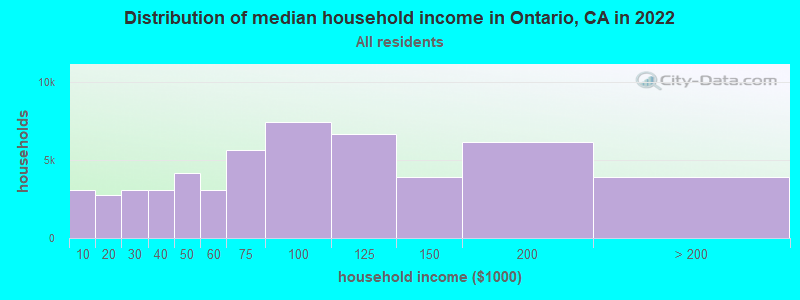
| Ontario: | $79,129 |
| CA: | $91,551 |
Estimated per capita income in 2022: $29,135 (it was $14,244 in 2000)
Ontario city income, earnings, and wages data
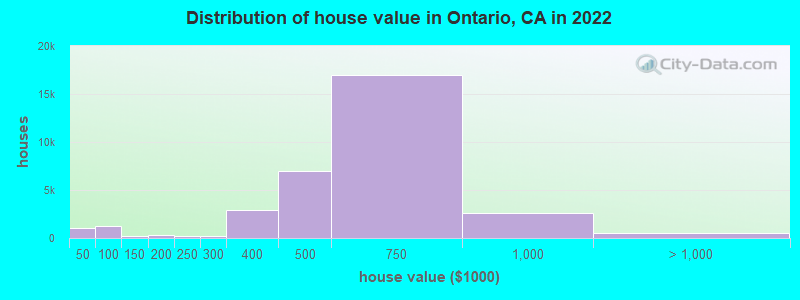
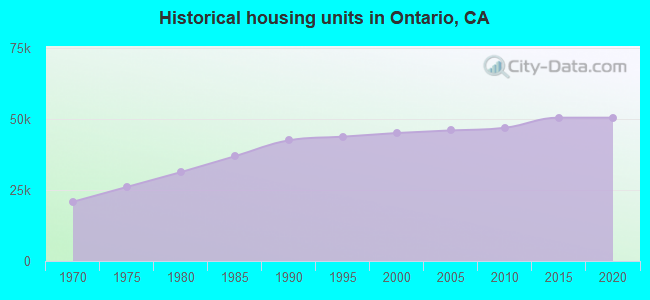
Estimated median house or condo value in 2022: $584,600 (it was $136,300 in 2000)
| Ontario: | $584,600 |
| CA: | $715,900 |
Mean prices in 2022: all housing units: $563,782; detached houses: $606,654; townhouses or other attached units: $494,330; in 2-unit structures: $473,308; in 3-to-4-unit structures: $456,555; in 5-or-more-unit structures: $371,878; mobile homes: $140,027
Median gross rent in 2022: $1,879.
(7.4% for White Non-Hispanic residents, 18.2% for Black residents, 12.9% for Hispanic or Latino residents, 6.8% for American Indian residents, 4.7% for Native Hawaiian and other Pacific Islander residents, 15.2% for other race residents, 10.6% for two or more races residents)
Detailed information about poverty and poor residents in Ontario, CA


Compare current foreclosures in Ontario, CA:
| Photo | Address | Area | Beds / Baths | Price | Details |
|---|---|---|---|---|---|

|
#1
E G St
Ontario, CA 91764
|
1,036 sq. feet
|
1 baths 3 beds |
$577,200
|
show details |

|
#2
W 4th St
Ontario, CA 91762
|
1,248 sq. feet
|
2 baths 3 beds |
show details | |

|
#3
E Spruce St
Ontario, CA 91761
|
1,199 sq. feet
|
2 baths 3 beds |
show details | |

|
#4
East Chip Smith Way
Ontario, CA 91762
|
1,656 sq. feet
|
2 baths 3 beds |
show details | |

|
#5
Amador Ave
Ontario, CA 91764
|
1,154 sq. feet
|
2 baths 4 beds |
show details | |

|
#6
S Lassen Ave
Ontario, CA 91761
|
1,498 sq. feet
|
2 baths 4 beds |
show details | |

|
#7
Foxglen Loop
Ontario, CA 91761
|
1,760 sq. feet
|
3 baths 4 beds |
show details | |

|
#8
E Merion St
Ontario, CA 91761
|
2,220 sq. feet
|
2 baths 4 beds |
show details | |

|
#9
S Malcolm Ave
Ontario, CA 91761
|
1,566 sq. feet
|
2 baths 3 beds |
show details | |

|
#10
Plaza Serena
Ontario, CA 91764
|
1,614 sq. feet
|
1 baths 3 beds |
show details |
| Photo | Address | Area | Beds / Baths | Price | Details |
|---|---|---|---|---|---|

|
#11
Virginia Ave
Ontario, CA 91764
|
1,786 sq. feet
|
2 baths 4 beds |
show details | |

|
#12
Platinum Ct
Ontario, CA 91762
|
1,188 sq. feet
|
2 baths 4 beds |
show details | |

|
#13
S Pleasant Ave
Ontario, CA 91761
|
1,920 sq. feet
|
2 baths 4 beds |
show details | |

|
#14
Harbour Town Trl
Ontario, CA 91761
|
1,826 sq. feet
|
2 baths 4 beds |
show details | |

|
#15
E D St Unit 9
Ontario, CA 91764
|
1,048 sq. feet
|
2 baths 2 beds |
show details | |

|
#16
S Parkside Dr
Ontario, CA 91761
|
1,726 sq. feet
|
2 baths 3 beds |
show details | |

|
#17
Russian River Dr
Ontario, CA 91761
|
1,595 sq. feet
|
2 baths 3 beds |
show details | |

|
#18
Alder Dr
Ontario, CA 91761
|
1,298 sq. feet
|
2 baths 3 beds |
show details | |

|
#19
E 7th St
Ontario, CA 91764
|
1,200 sq. feet
|
2 baths 4 beds |
show details | |

|
#20
E Spruce St
Ontario, CA 91761
|
1,199 sq. feet
|
2 baths 3 beds |
show details |
| Photo | Address | Area | Beds / Baths | Price | Details |
|---|---|---|---|---|---|

|
#21
E Riverside Dr Spc 202
Ontario, CA 91761
|
1,344 sq. feet
|
2 baths 3 beds |
show details | |

|
#22
S Sultana Ave Spc 292
Ontario, CA 91761
|
960 sq. feet
|
2 baths 2 beds |
show details | |

|
#23
Manzanita Ct
Ontario, CA 91762
|
1,580 sq. feet
|
2 baths 4 beds |
show details | |

|
#24
W Sunkist St
Ontario, CA 91762
|
932 sq. feet
|
1 baths 3 beds |
show details | |

|
#25
E Cottonwood Ct
Ontario, CA 91761
|
1,936 sq. feet
|
2 baths 3 beds |
show details | |

|
#26
S Euclid Ave
Ontario, CA 91762
|
1,460 sq. feet
|
2 baths 4 beds |
show details | |

|
#27
N Barranca Ave
Ontario, CA 91764
|
1,128 sq. feet
|
2 baths 3 beds |
show details | |

|
#28
N Baker Ave
Ontario, CA 91764
|
1,460 sq. feet
|
2 baths 4 beds |
show details | |

|
#29
N Turner Ave Apt 114
Ontario, CA 91764
|
1,382 sq. feet
|
2 baths 2 beds |
show details | |

|
#30
S Campus Ave Apt 101
Ontario, CA 91761
|
1,000 sq. feet
|
2 baths 2 beds |
show details |
| Photo | Address | Area | Beds / Baths | Price | Details |
|---|---|---|---|---|---|

|
#31
Marin Ave
Ontario, CA 91764
|
1,504 sq. feet
|
2 baths 3 beds |
show details | |

|
#32
S Cedar Ridge Pl
Ontario, CA 91761
|
1,460 sq. feet
|
2 baths 3 beds |
show details | |

|
#33
S Imperial Pl
Ontario, CA 91761
|
1,746 sq. feet
|
2 baths 4 beds |
show details | |

|
#34
W Nevada St
Ontario, CA 91762
|
720 sq. feet
|
1 baths 3 beds |
show details | |

|
#35
Plum Ln
Ontario, CA 91761
|
1,448 sq. feet
|
2 baths 3 beds |
show details | |

|
#36
E G St
Ontario, CA 91764
|
936 sq. feet
|
1 baths 3 beds |
show details | |

|
#37
E Nocta St
Ontario, CA 91764
|
1,026 sq. feet
|
1 baths 2 beds |
show details | |

|
#38
N Del Norte Ave
Ontario, CA 91764
|
1,150 sq. feet
|
2 baths 4 beds |
show details | |

|
#39
S Woodlark Dr
Ontario, CA 91761
|
1,864 sq. feet
|
2 baths 4 beds |
show details | |

|
#40
N Imperial 514c
Ontario, CA 91764
|
788 sq. feet
|
1 baths 2 beds |
show details |
| Photo | Address | Area | Beds / Baths | Price | Details |
|---|---|---|---|---|---|

|
#41
E Rosewood Ct
Ontario, CA 91764
|
1,305 sq. feet
|
2 baths 3 beds |
show details | |

|
#42
E Philadelphia St Spc 77
Ontario, CA 91761
|
820 sq. feet
|
2 baths 2 beds |
show details | |

|
#43
E El Morado Ct
Ontario, CA 91764
|
1,040 sq. feet
|
2 baths 3 beds |
show details | |

|
#44
S Malcolm Ave
Ontario, CA 91761
|
1,566 sq. feet
|
2 baths 3 beds |
show details | |

|
#45
W H St
Ontario, CA 91762
|
1,260 sq. feet
|
1 baths 4 beds |
show details | |

|
#46
W E St
Ontario, CA 91762
|
1,467 sq. feet
|
2 baths 3 beds |
show details | |

|
#47
E Black Horse Dr
Ontario, CA 91761
|
2,390 sq. feet
|
3 baths 5 beds |
show details | |

|
#48
Greenwood Pl
Ontario, CA 91761
|
1,061 sq. feet
|
2 baths 2 beds |
show details | |

|
#49
E H St
Ontario, CA 91764
|
1,808 sq. feet
|
2 baths 4 beds |
show details | |

|
Check over 1 million property listings on Foreclosure.com!
|
browse all offers | |||


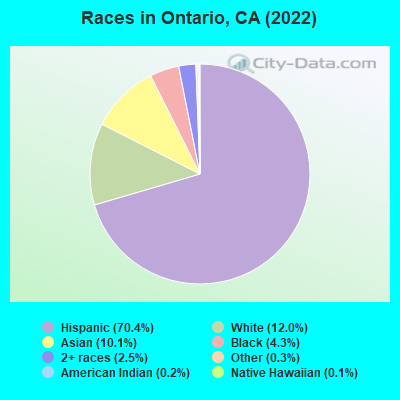
- 126,07170.4%Hispanic
- 21,45212.0%White alone
- 18,13210.1%Asian alone
- 7,6694.3%Black alone
- 4,5372.5%Two or more races
- 5230.3%Other race alone
- 4170.2%American Indian alone
- 2610.1%Native Hawaiian and Other
Pacific Islander alone
According to our research of California and other state lists, there were 202 registered sex offenders living in Ontario, California as of April 27, 2024.
The ratio of all residents to sex offenders in Ontario is 857 to 1.
The ratio of registered sex offenders to all residents in this city is near the state average.
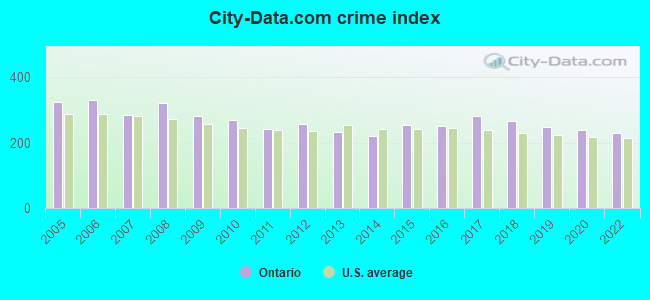
The City-Data.com crime index weighs serious crimes and violent crimes more heavily. Higher means more crime, U.S. average is 246.1. It adjusts for the number of visitors and daily workers commuting into cities.
- means the value is smaller than the state average.- means the value is about the same as the state average.
- means the value is bigger than the state average.
- means the value is much bigger than the state average.
Crime rate in Ontario detailed stats: murders, rapes, robberies, assaults, burglaries, thefts, arson
Full-time law enforcement employees in 2021, including police officers: 339 (261 officers - 238 male; 23 female).
| Officers per 1,000 residents here: | 1.41 |
| California average: | 2.30 |
 Recent articles from our blog. Our writers, many of them Ph.D. graduates or candidates, create easy-to-read articles on a wide variety of topics.

 | Ontario Ranch/Eastvale School situation (0 replies) |
| Good Places to go Biking in R.C./Ontario Areas? (24 replies) |
| Looking into buying a home in Ontario Ranch (61 replies) |
| Internet Service Providers in Ontario Ranch (3 replies) |
| New Haven, Ontario Ranch? (4 replies) |
| Park place Ontario community (8 replies) |
Latest news from Ontario, CA collected exclusively by city-data.com from local newspapers, TV, and radio stations
Ancestries: American (2.1%), German (1.1%).
Current Local Time: PST time zone
Elevation: 988 feet
Land area: 49.8 square miles.
Population density: 3,597 people per square mile (average).
48,939 residents are foreign born (21.5% Latin America, 5.2% Asia).
| This city: | 27.6% |
| California: | 26.5% |
Median real estate property taxes paid for housing units with mortgages in 2022: $3,810 (0.6%)
Median real estate property taxes paid for housing units with no mortgage in 2022: $2,135 (0.4%)
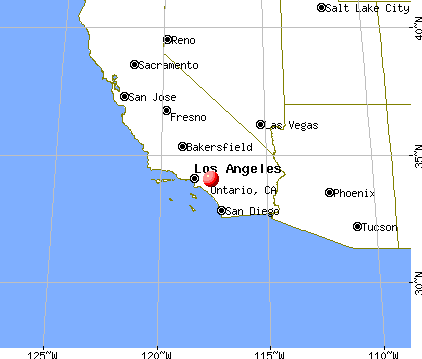
Nearest city with pop. 200,000+: East San Gabriel Valley, CA  (13.6 miles , pop. 933,557).
Nearest city with pop. 1,000,000+: Los Angeles, CA (42.9 miles , pop. 3,694,820).
Nearest cities:
), Latitude: 34.05 N, Longitude: 117.63 W
Daytime population change due to commuting: +45,637 (+25.5%)
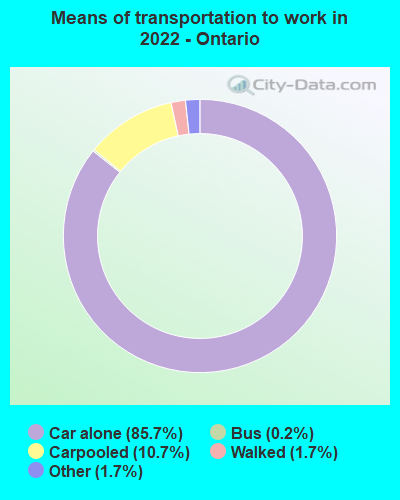
Workers who live and work in this city: 27,244 (32.7%)
Area code: 909
Property values in Ontario, CA

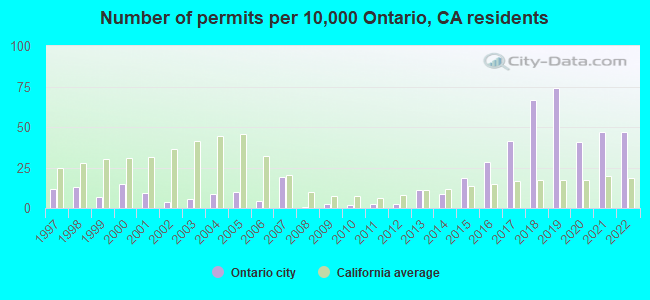
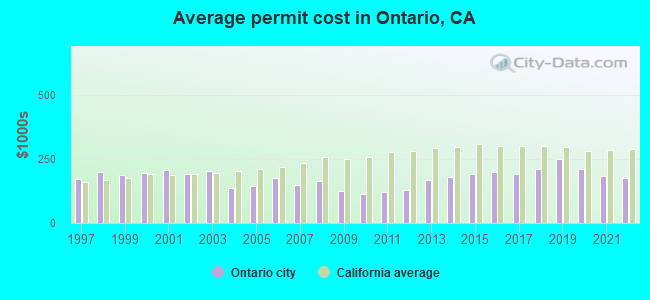
Single-family new house construction building permits:
- 2022: 746 buildings, average cost: $177,900
- 2021: 738 buildings, average cost: $182,500
- 2020: 645 buildings, average cost: $212,100
- 2019: 1167 buildings, average cost: $249,600
- 2018: 1056 buildings, average cost: $209,900
- 2017: 649 buildings, average cost: $190,300
- 2016: 448 buildings, average cost: $198,400
- 2015: 291 buildings, average cost: $192,900
- 2014: 132 buildings, average cost: $180,100
- 2013: 171 buildings, average cost: $167,600
- 2012: 37 buildings, average cost: $131,100
- 2011: 36 buildings, average cost: $122,100
- 2010: 30 buildings, average cost: $111,800
- 2009: 35 buildings, average cost: $125,100
- 2008: 8 buildings, average cost: $164,100
- 2007: 307 buildings, average cost: $148,800
- 2006: 69 buildings, average cost: $177,700
- 2005: 153 buildings, average cost: $145,400
- 2004: 132 buildings, average cost: $138,400
- 2003: 87 buildings, average cost: $204,700
- 2002: 60 buildings, average cost: $191,100
- 2001: 149 buildings, average cost: $205,800
- 2000: 236 buildings, average cost: $197,200
- 1999: 109 buildings, average cost: $187,600
- 1998: 207 buildings, average cost: $198,400
- 1997: 186 buildings, average cost: $171,900
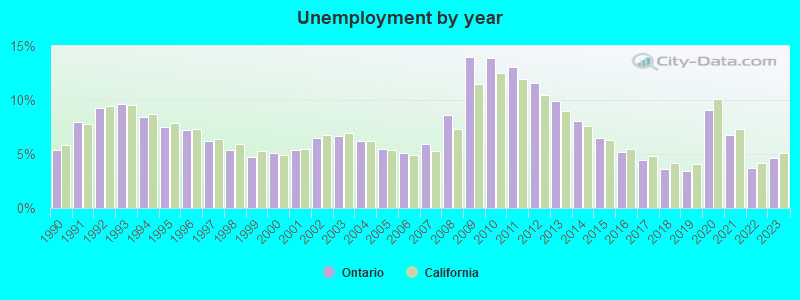
| Here: | 4.6% |
| California: | 5.1% |
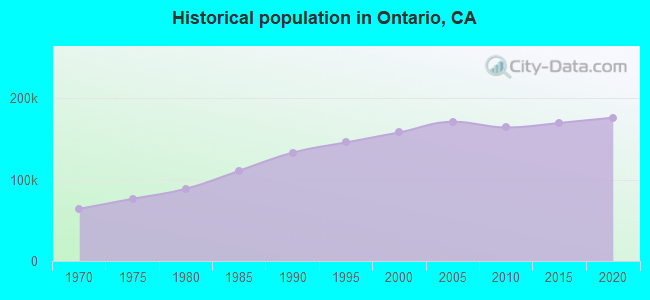
Population change in the 1990s: +22,882 (+16.9%).
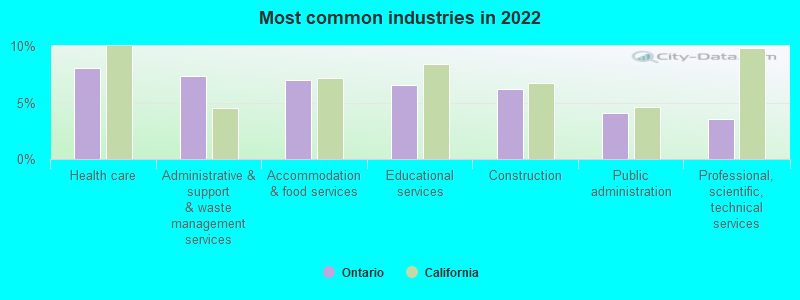
- Health care (8.1%)
- Administrative & support & waste management services (7.4%)
- Accommodation & food services (7.0%)
- Educational services (6.6%)
- Construction (6.2%)
- Public administration (4.1%)
- Professional, scientific, technical services (3.5%)
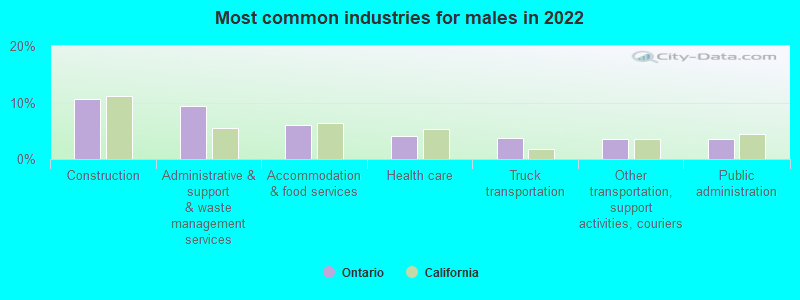
- Construction (10.7%)
- Administrative & support & waste management services (9.4%)
- Accommodation & food services (6.1%)
- Health care (4.1%)
- Truck transportation (3.8%)
- Other transportation, support activities, couriers (3.6%)
- Public administration (3.5%)
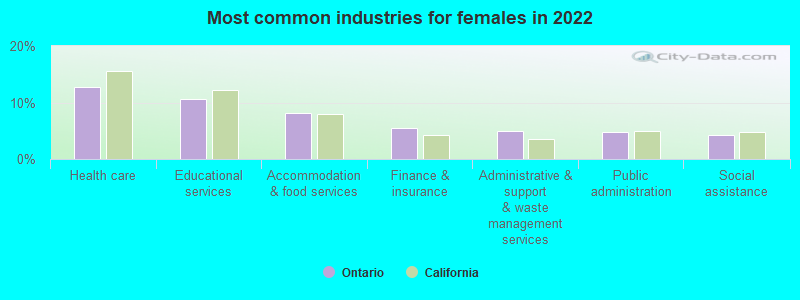
- Health care (12.8%)
- Educational services (10.7%)
- Accommodation & food services (8.1%)
- Finance & insurance (5.6%)
- Administrative & support & waste management services (4.9%)
- Public administration (4.8%)
- Social assistance (4.2%)
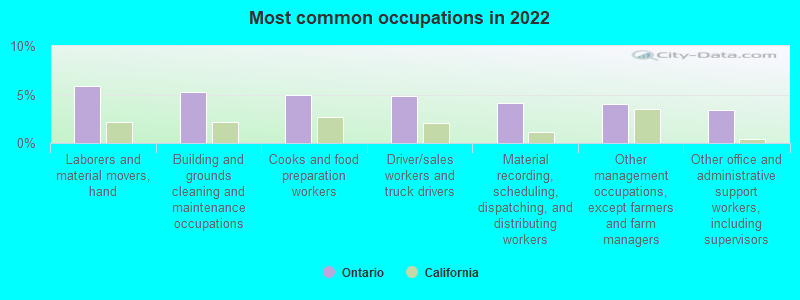
- Laborers and material movers, hand (5.9%)
- Building and grounds cleaning and maintenance occupations (5.2%)
- Cooks and food preparation workers (5.0%)
- Driver/sales workers and truck drivers (4.8%)
- Material recording, scheduling, dispatching, and distributing workers (4.2%)
- Other management occupations, except farmers and farm managers (4.0%)
- Other office and administrative support workers, including supervisors (3.4%)
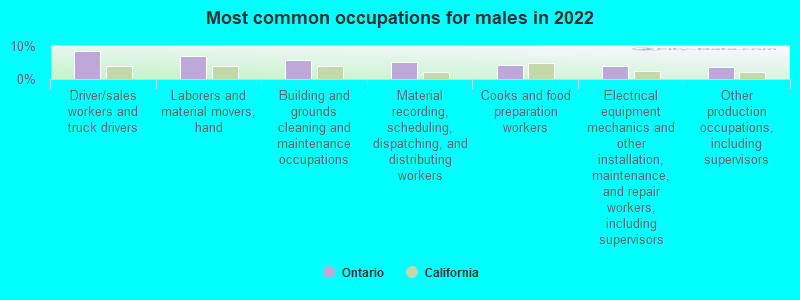
- Driver/sales workers and truck drivers (8.5%)
- Laborers and material movers, hand (7.1%)
- Building and grounds cleaning and maintenance occupations (5.8%)
- Material recording, scheduling, dispatching, and distributing workers (5.0%)
- Cooks and food preparation workers (4.1%)
- Electrical equipment mechanics and other installation, maintenance, and repair workers, including supervisors (4.0%)
- Other production occupations, including supervisors (3.5%)
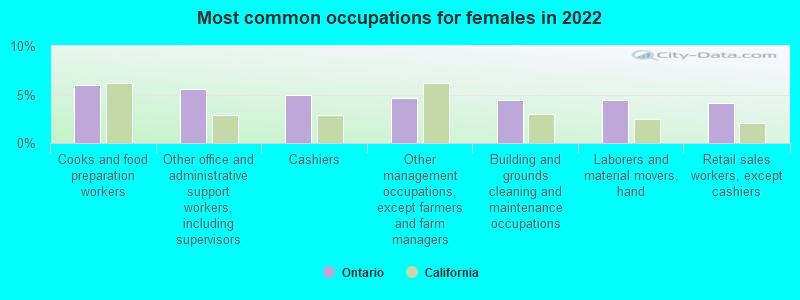
- Cooks and food preparation workers (6.0%)
- Other office and administrative support workers, including supervisors (5.6%)
- Cashiers (5.0%)
- Other management occupations, except farmers and farm managers (4.6%)
- Building and grounds cleaning and maintenance occupations (4.5%)
- Laborers and material movers, hand (4.4%)
- Retail sales workers, except cashiers (4.1%)
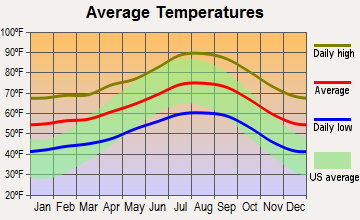
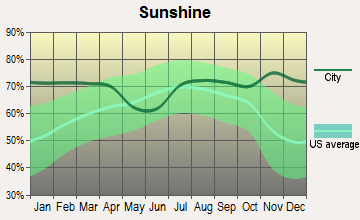
Average climate in Ontario, California
Based on data reported by over 4,000 weather stations


|
|

(lower is better)
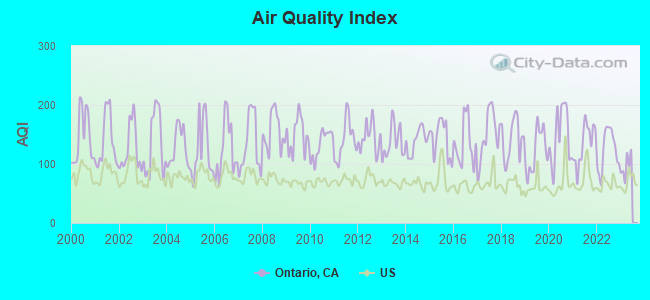
Air Quality Index (AQI) level in 2022 was 124. This is significantly worse than average.
| City: | 124 |
| U.S.: | 73 |
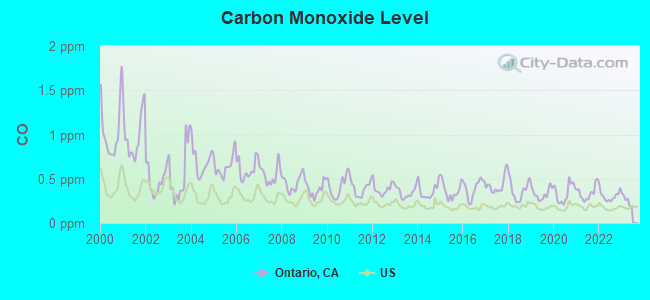
Carbon Monoxide (CO) [ppm] level in 2022 was 0.306. This is worse than average. Closest monitor was 2.2 miles away from the city center.
| City: | 0.306 |
| U.S.: | 0.251 |
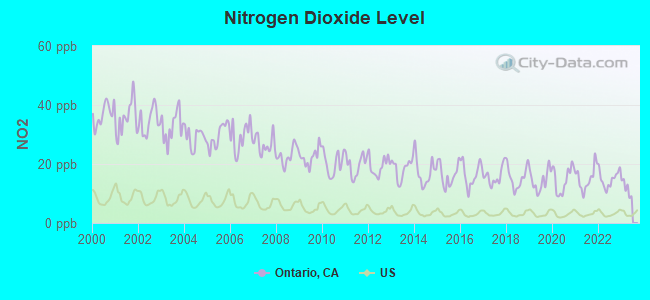
Nitrogen Dioxide (NO2) [ppb] level in 2022 was 14.9. This is significantly worse than average. Closest monitor was 2.2 miles away from the city center.
| City: | 14.9 |
| U.S.: | 5.1 |
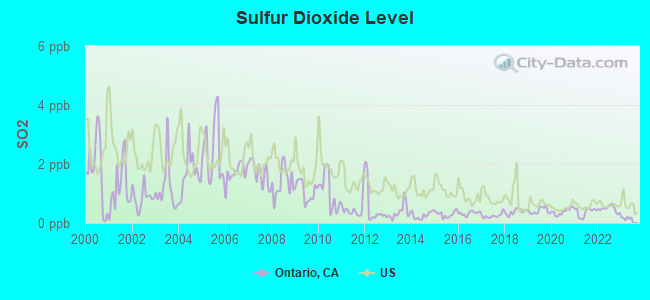
Sulfur Dioxide (SO2) [ppb] level in 2022 was 0.481. This is significantly better than average. Closest monitor was 3.5 miles away from the city center.
| City: | 0.481 |
| U.S.: | 1.515 |
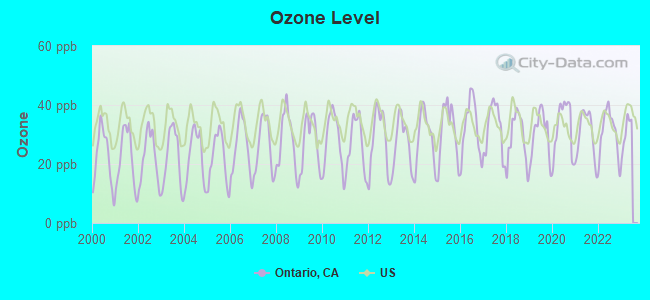
Ozone [ppb] level in 2022 was 30.6. This is about average. Closest monitor was 3.4 miles away from the city center.
| City: | 30.6 |
| U.S.: | 33.3 |
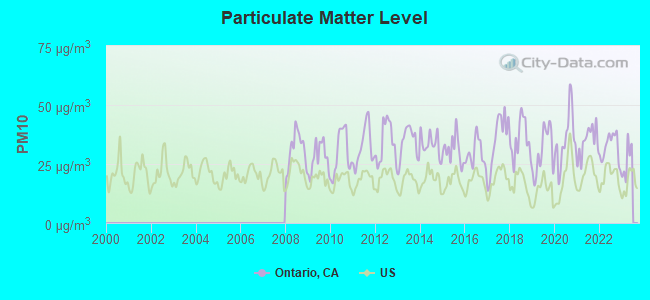
Particulate Matter (PM10) [µg/m3] level in 2022 was 32.0. This is significantly worse than average. Closest monitor was 2.2 miles away from the city center.
| City: | 32.0 |
| U.S.: | 19.2 |
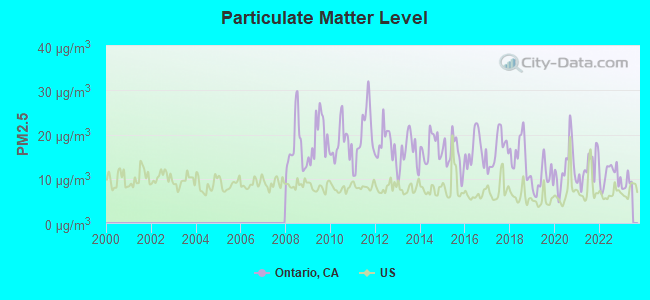
Particulate Matter (PM2.5) [µg/m3] level in 2022 was 10.7. This is worse than average. Closest monitor was 1.6 miles away from the city center.
| City: | 10.7 |
| U.S.: | 8.1 |
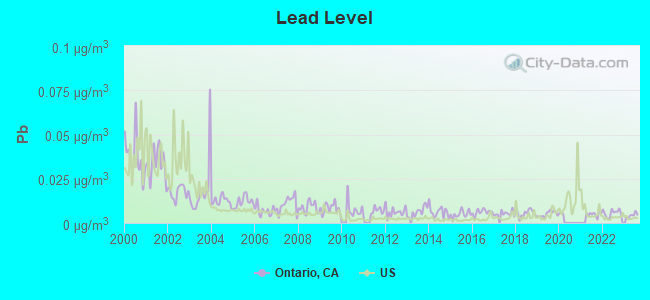
Lead (Pb) [µg/m3] level in 2023 was 0.00426. This is significantly better than average. Closest monitor was 2.2 miles away from the city center.
| City: | 0.00426 |
| U.S.: | 0.00931 |
Earthquake activity:
Ontario-area historical earthquake activity is significantly above California state average. It is 7258% greater than the overall U.S. average.On 6/28/1992 at 11:57:34, a magnitude 7.6 (6.2 MB, 7.6 MS, 7.3 MW, Depth: 0.7 mi, Class: Major, Intensity: VIII - XII) earthquake occurred 63.4 miles away from the city center, causing 3 deaths (1 shaking deaths, 2 other deaths) and 400 injuries, causing $100,000,000 total damage and $40,000,000 insured losses
On 7/21/1952 at 11:52:14, a magnitude 7.7 (7.7 UK) earthquake occurred 102.0 miles away from the city center, causing $50,000,000 total damage
On 10/16/1999 at 09:46:44, a magnitude 7.4 (6.3 MB, 7.4 MS, 7.2 MW, 7.3 ML) earthquake occurred 75.3 miles away from the city center
On 4/21/1918 at 22:32:30, a magnitude 6.8 (6.8 UK, Class: Strong, Intensity: VII - IX) earthquake occurred 19.8 miles away from Ontario center
On 6/28/1992 at 15:05:30, a magnitude 6.9 (6.3 MB, 6.7 MS, 6.5 MW, 6.9 ME, Depth: 3.1 mi) earthquake occurred 49.2 miles away from Ontario center
On 5/19/1940 at 04:36:40, a magnitude 7.2 (7.2 UK) earthquake occurred 125.2 miles away from Ontario center, causing $33,000,000 total damage
Magnitude types: body-wave magnitude (MB), energy magnitude (ME), local magnitude (ML), surface-wave magnitude (MS), moment magnitude (MW)
Natural disasters:
The number of natural disasters in San Bernardino County (46) is a lot greater than the US average (15).Major Disasters (Presidential) Declared: 27
Emergencies Declared: 2
Causes of natural disasters: Fires: 24, Floods: 18, Storms: 9, Winter Storms: 6, Landslides: 5, Mudslides: 4, Heavy Rains: 2, Earthquake: 1, Flash Flood: 1, Freeze: 1, Hurricane: 1, Snow: 1, Tornado: 1, Tropical Storm: 1, Wind: 1, Other: 1 (Note: some incidents may be assigned to more than one category).
Main business address for: KAISER VENTURES LLC (LESSORS OF REAL PROPERTY, NEC), CVB FINANCIAL CORP (STATE COMMERCIAL BANKS).
Hospitals in Ontario:
- KINDRED HOSPITAL (550 NORTH MONTEREY)
- MANZANITA HOME (708 MANZANITA COURT)
- ODESSEY HOME (2032 OLIVE COURT)
- VENCOR HOSPITAL - ONTARIO (550 N MONTEREY AVE)
Nursing Homes in Ontario:
- BELLA VISTA HEALTHCARE CENTER (933 EAST DEODAR STREET)
- HOME OF ANGELS (540 W MAPLE STREET)
- INLAND CHRISTIAN HOME (1950 S. MOUNTAIN AVE)
- ONTARIO HEALTHCARE CENTER (1661 SOUTH EUCLID AVENUE)
- PLOTT NURSING HOME (800 EAST FIFTH STREET)
Dialysis Facilities in Ontario:
- DAVITA-ONTARIO DIALYSIS (1950-A GROVE AVENUE, SUITE 101)
- DIALYSIS CENTER OF ONTARIO, LLC (2850 INLAND EMPIRE BLVD., SUITE C)
- ONTARIO DIALYSIS INC. (1001 W. SIXTH STREET, SUITE A)
Home Health Centers in Ontario:
- ACCENTCARE HOME HEALTH OF CALIFORNIA, INC (1455 SOUTH AUTO CENTER DRIVE)
- ADEPT HOME HEALTH SERVICES, INC (1131 W 6TH STREET #270)
- AJA PLUS HOME HEALTH SERVICES, INC (4295 EAST JURUPA STREET SUITE 213)
- ALLCARE HEALTH SERVICES, INC (360 SOUTH MILLIKEN AVENUE SUITE F&G)
- BEST HOME HEALTH CARE INC (1630 E FRANCIS STREET SUITE K)
- QUALITY HOME HEALTH AGENCY (4375 E LOWELL STREET SUITE I)
Airports located in Ontario:
- Ontario International Airport (ONT) (Runways: 2, Commercial Ops: 50,783, Air Taxi Ops: 16,286, Itinerant Ops: 12,009, Local Ops: 4,045, Military Ops: 575)
Colleges/Universities in Ontario:
- West Coast University-Ontario (Full-time enrollment: 1,887; Location: 2855 E. Guasti Rd; Private, for-profit; Website: westcoastuniversity.edu/campuses/ontario.html)
- American Career College-Ontario (Full-time enrollment: 1,312; Location: 3130 East Sedona Court; Private, for-profit; Website: www.americancareercollege.edu)
- Everest College-Ontario Metro (Full-time enrollment: 1,266; Location: 1819 South Excise Avenue; Private, for-profit; Website: www.everest.edu/campus/ontario_metro)
- Everest College-Ontario (Full-time enrollment: 1,132; Location: 1460 S. Milliken Ave; Private, for-profit; Website: www.everest.edu/campus/ontario)
- San Joaquin Valley College-Ontario (Full-time enrollment: 1,008; Location: 4580 Ontario Mills Parkway; Private, for-profit; Website: sjvc.edu)
- Platt College-Ontario (Full-time enrollment: 575; Location: 3700 Inland Empire Boulevard; Private, for-profit; Website: www.plattcollege.edu)
- Argosy University-Inland Empire (Full-time enrollment: 558; Location: 3401 Centre Lake Drive, Suite 200; Private, for-profit; Website: www.argosy.edu/inlandempire; Offers Doctor's degree)
- Franklin Career College (Location: 1274 Slater Cir; Private, for-profit; Website: www.franklincareercollege.com)
Colleges/universities with over 2000 students nearest to Ontario:
- Universal Technical Institute of California Inc (about 4 miles; Rancho Cucamonga, CA; Full-time enrollment: 4,158)
- Chaffey College (about 8 miles; Rancho Cucamonga, CA; FT enrollment: 10,496)
- University of La Verne (about 9 miles; La Verne, CA; FT enrollment: 6,983)
- Norco College (about 11 miles; Norco, CA; FT enrollment: 4,916)
- DeVry University-California (about 11 miles; Pomona, CA; FT enrollment: 10,875)
- California State Polytechnic University-Pomona (about 11 miles; Pomona, CA; FT enrollment: 18,141)
- Mt San Antonio College (about 13 miles; Walnut, CA; FT enrollment: 19,891)
Public high schools in Ontario:
- CHAFFEY HIGH (Students: 2,394, Location: 1245 N. EUCLID AVE., Grades: 9-12)
- ONTARIO HIGH (Students: 1,990, Location: 901 W. FRANCIS ST., Grades: 9-12)
- COLONY HIGH (Students: 1,562, Location: 3850 E. RIVERSIDE DR., Grades: 9-12)
- VALLEY VIEW HIGH (CONTINUATION) (Students: 68, Location: 1801 E. SIXTH ST., Grades: 9-12)
- CHAFFEY COMMUNITY DAY (Students: 45, Location: 1802 E. SEVENTH ST., Grades: 9-12)
- CHAFFEY DISTRICT ONLINE HIGH (Location: 1802 E. 7TH ST., Grades: 9-12)
Private high schools in Ontario:
Biggest public elementary/middle schools in Ontario:
- VINA DANKS MIDDLE (Students: 1,091, Location: 1020 N. VINE AVE., Grades: 7-8)
- GRACE YOKLEY MIDDLE (Students: 979, Location: 2947 S. TURNER AVE., Grades: 6-8)
- OAKS MIDDLE (Students: 907, Location: 1221 S. OAKS AVE., Grades: 7-8)
- RAY WILTSEY MIDDLE (Students: 854, Location: 1450 E. G ST., Grades: 6-8)
- DE ANZA MIDDLE (Students: 846, Location: 1450 S. SULTANA AVE., Grades: 7-8)
- RICHARD HAYNES ELEMENTARY (Students: 547, Location: 715 W. FRANCIS ST., Grades: KG-6)
- BERLYN ELEMENTARY (Students: 542, Location: 1320 N. BERLYN AVE., Grades: KG-6)
- SULTANA ELEMENTARY (Students: 525, Location: 1845 S. SULTANA AVE., Grades: KG-6)
- BON VIEW ELEMENTARY (Students: 506, Location: 2121 S. BON VIEW AVE., Grades: KG-6)
- HAWTHORNE ELEMENTARY (Students: 495, Location: 705 W. HAWTHORNE ST., Grades: KG-6)
Private elementary/middle schools in Ontario:
Library in Ontario:
Points of interest:
Notable locations in Ontario: Voortman's Egg Ranch (A), Three Palms Dairy (B), Bacho's Dairy (C), Bangma Dairy (D), Brothers Three Dairy (E), Chino Dairy (F), Dehoog Dairy (G), Dykstra Dairy (H), Heims Pride Dairy (I), Jai Alai Dairy (J), K and B Dairy (K), L and M Dairy (L), Pyrenees Dairy (M), Veenendaal Dairy (N), Two B Dairy (O), Tiva Dairy (P), Sultana Dairy (Q), R and V Dairy (R), Woodcrest Dairy (S), Venegas Dairy (T). Display/hide their locations on the map
Shopping Centers: Plaza Continental Shopping Center (1), Ontario Village Shopping Center (2), Ontario Plaza Shopping Center (3), Ontario Plaza Shopping Center (4), Galvin Park Shopping Center (5), Vineyard Freeway Shopping Center (6), The Vineyard Shopping Center (7), The Vineyard Ontario Shopping Center (8), Ontario Vineyard Marketplace Shopping Center (9). Display/hide their locations on the map
Main business address in Ontario include: KAISER VENTURES LLC (A), CVB FINANCIAL CORP (B). Display/hide their locations on the map
Churches in Ontario include: Archibald Ranch Community Church (A), Army of the Word World Church (B), Brethren In Christ Church (C), Church of Secundo d'Asti (D), First Church of God (E), Fourth Street Baptist Church (F), Iglesia Evangelica Cristo (G), Church of Christ (H), The Church of Jesus Christ of Latter Day Saints (I). Display/hide their locations on the map
Cemetery: Bellview Cemetery (1). Display/hide its location on the map
Creek: Deer Creek (A). Display/hide its location on the map
Parks in Ontario include: Bon View Park (1), Colony Park (2), Del Rancho Park (3), Galanis Park (4), Galvin Park (5), Memorial Grove Park (6), Cucamonga-Gusti Regional Park (7), Vineyard Park (8), Oaks Avenue Pioneer Park (9). Display/hide their locations on the map
Tourist attraction: American Wilderness Zoo & Aquarium (Cultural Attractions- Events- & Facilities; 4557 Mills Circle) (1). Display/hide its approximate location on the map
Hotels: Best Western Ontario (209 North Vineyard Avenue) (1), Best Western Ontario Airport (209 North Vineyard Avenue) (2), Amerisuites Ontario Mills (4760 Mills Cir) (3), AmeriSuites Hotel (4760 E Mills Circle) (4), Best Western Inn (209 North Vineyard Avenue) (5), American Inn (755 North Euclid Av) (6), Bright Star Motel (1530 West Mission Boulevard) (7). Display/hide their approximate locations on the map
Court: California State - Corrections Dept- Parole & Community Services Div- Ontario (1511 East Holt Boulevard) (1). Display/hide its approximate location on the map
Birthplace of: Del Crandall - Baseball player and coach, Anthony Muñoz - Football player, Antonio Pierce - 2005 NFL player (New York Giants, born: Oct 26, 1978), Charles G. Irion - Businessperson, Cle Kooiman - Soccer player-coach, Jason Bowles - Stock car racing driver, Jeff Pendergraph - Basketball player, Omar Bolden - Football defensive back, Prince Fielder - 2005 Major League Baseball player (Milwaukee Brewers, born: May 18, 1984), Reuben Duran - Martial artist.
Drinking water stations with addresses in Ontario that have no violations reported:
- MACLIN MARKETS (Population served: 1,000, Primary Water Source Type: Groundwater)
- HOLCOMB VALLEY SCOUT RANCH (Population served: 250, Primary Water Source Type: Groundwater)
- CHINO BASIN DESALTER AUTH. - DESALTER 2 (Population served: 0, Primary Water Source Type: Groundwater)
- CHINO BASIN DESALTER AUTH. - DESALTER 1 (Population served: 0, Primary Water Source Type: Groundwater)
| This city: | 3.6 people |
| California: | 2.9 people |
| This city: | 79.2% |
| Whole state: | 68.7% |
| This city: | 8.6% |
| Whole state: | 7.2% |
Likely homosexual households (counted as self-reported same-sex unmarried-partner households)
- Lesbian couples: 0.5% of all households
- Gay men: 0.4% of all households
People in group quarters in Ontario in 2010:
- 347 people in nursing facilities/skilled-nursing facilities
- 152 people in other noninstitutional facilities
- 141 people in group homes intended for adults
- 47 people in college/university student housing
- 41 people in emergency and transitional shelters (with sleeping facilities) for people experiencing homelessness
- 28 people in workers' group living quarters and job corps centers
- 2 people in residential treatment centers for adults
People in group quarters in Ontario in 2000:
- 557 people in other noninstitutional group quarters
- 412 people in nursing homes
- 82 people in homes for the mentally retarded
- 45 people in homes or halfway houses for drug/alcohol abuse
- 14 people in homes for the mentally ill
- 10 people in agriculture workers' dormitories on farms
- 6 people in homes for abused, dependent, and neglected children
- 5 people in orthopedic wards and institutions for the physically handicapped
- 5 people in unknown juvenile institutions
- 5 people in other group homes
Banks with most branches in Ontario (2011 data):
- Wells Fargo Bank, National Association: South Ontario Branch, Ontario Mills Branch, Ontario Branch, Albertsons Ontario Branch, Inland Empire Rcbo Branch. Info updated 2011/04/05: Bank assets: $1,161,490.0 mil, Deposits: $905,653.0 mil, headquarters in Sioux Falls, SD, positive income, 6395 total offices, Holding Company: Wells Fargo & Company
- U.S. Bank National Association: Ontario Ralphs Branch, Ontario - Euclid Avenue Branch, Ontario - Grove Avenue Branch, Ontario Branch. Info updated 2012/01/30: Bank assets: $330,470.8 mil, Deposits: $236,091.5 mil, headquarters in Cincinnati, OH, positive income, 3121 total offices, Holding Company: U.S. Bancorp
- Pacific Western Bank: Ontario Branch at 2401 South Grove Avenue, branch established on 1983/01/10; Limited Service Branch (Courier) at 845 North Euclid Avenue, branch established on 1985/10/17. Info updated 2011/03/14: Bank assets: $5,513.1 mil, Deposits: $4,614.5 mil, headquarters in Los Angeles, CA, positive income, Commercial Lending Specialization, 78 total offices, Holding Company: Capgen Capital Group Ii Lp
- Bank of America, National Association: Ontario Branch at 735 North Euclid Avenue, branch established on 1923/05/28; Ontario Plaza Branch at 910 North Mountain Avenue, branch established on 1957/04/08. Info updated 2009/11/18: Bank assets: $1,451,969.3 mil, Deposits: $1,077,176.8 mil, headquarters in Charlotte, NC, positive income, 5782 total offices, Holding Company: Bank Of America Corporation
- Cathay Bank: Ontario Branch at 2000a South Grove Avenue, Suite 103, branch established on 2007/07/23. Info updated 2010/12/08: Bank assets: $10,628.9 mil, Deposits: $7,249.8 mil, headquarters in Los Angeles, CA, positive income, Commercial Lending Specialization, 52 total offices, Holding Company: Cathay General Bancorp
- Inland Community Bank, National Association: Ontario Regional Branch at 3999 Inland Empire Blvd, branch established on 1995/01/11. Info updated 2006/09/19: Bank assets: $223.2 mil, Deposits: $194.4 mil, headquarters in Rialto, CA, negative income in the last year, Commercial Lending Specialization, 5 total offices, Holding Company: Fa Capital, Llc
- Compass Bank: Ontario Superior Branch at 815 W Holt Blvd, branch established on 2006/06/30. Info updated 2011/02/24: Bank assets: $63,107.0 mil, Deposits: $46,232.4 mil, headquarters in Birmingham, AL, negative income in the last year, Commercial Lending Specialization, 720 total offices, Holding Company: Banco Bilbao Vizcaya Argentaria, S.A.
- Community Bank: Ontario Branch at 3110 East Guasti Road, Suite 500, branch established on 2005/01/03. Info updated 2010/02/16: Bank assets: $2,601.3 mil, Deposits: $1,941.4 mil, headquarters in Pasadena, CA, positive income, Commercial Lending Specialization, 17 total offices
- Manufacturers Bank: Ontario Office Branch at 2855 E. Guasti Rd., Suite 212, branch established on 2008/11/01. Info updated 2011/09/29: Bank assets: $1,982.9 mil, Deposits: $1,480.0 mil, headquarters in Los Angeles, CA, positive income, Commercial Lending Specialization, 10 total offices, Holding Company: Sumitomo Mitsui Financial Group, Inc.
- 9 other banks with 9 local branches
For population 15 years and over in Ontario:
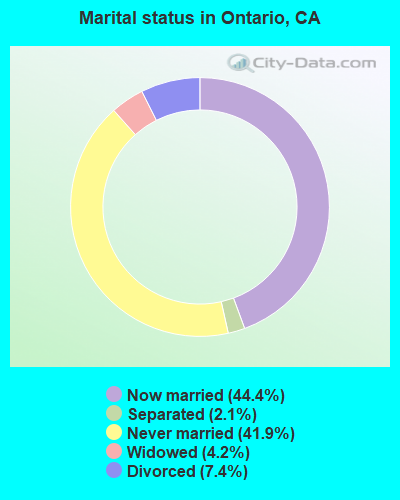
- Never married: 41.9%
- Now married: 44.4%
- Separated: 2.1%
- Widowed: 4.2%
- Divorced: 7.4%
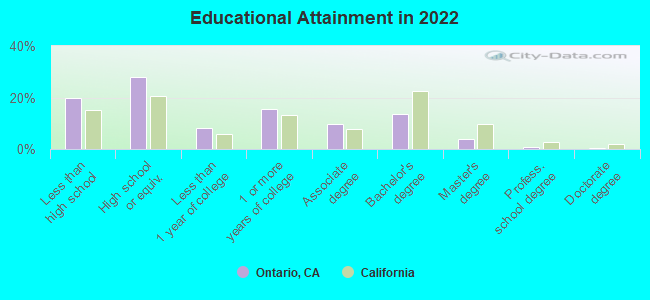
For population 25 years and over in Ontario:
- High school or higher: 80.0%
- Bachelor's degree or higher: 18.5%
- Graduate or professional degree: 4.9%
- Unemployed: 8.9%
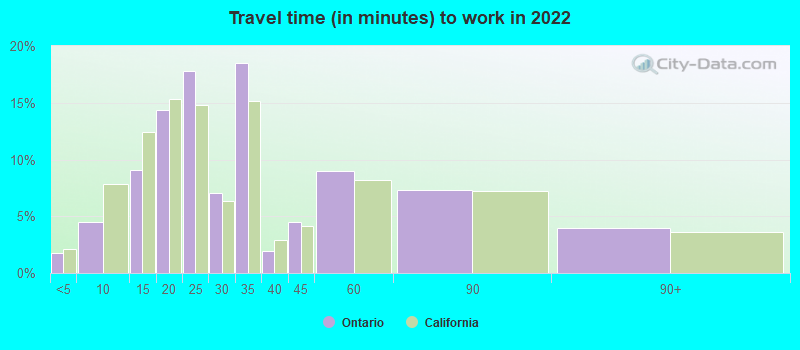
- Mean travel time to work (commute): 28.1 minutes
| Here: | 16.4 |
| California average: | 15.5 |
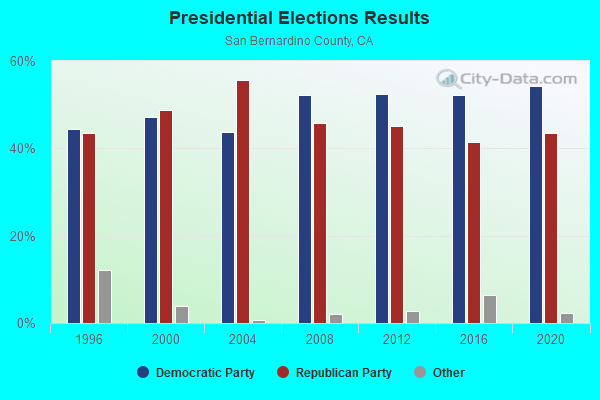
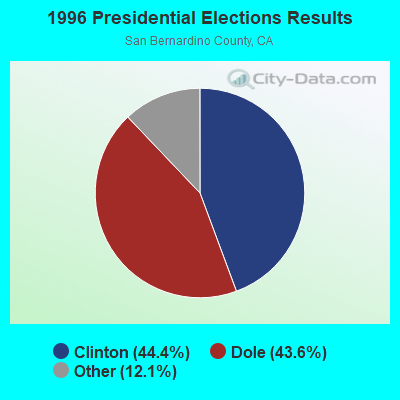
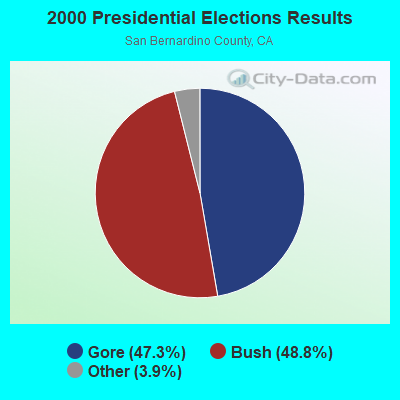
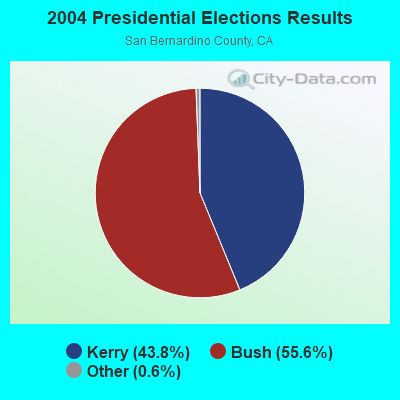
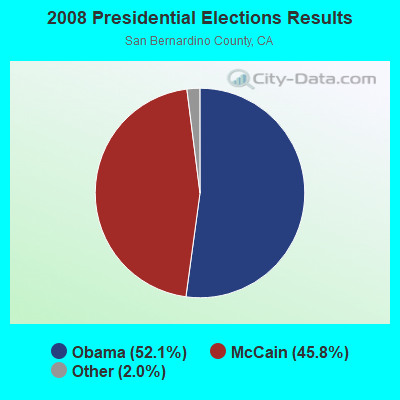
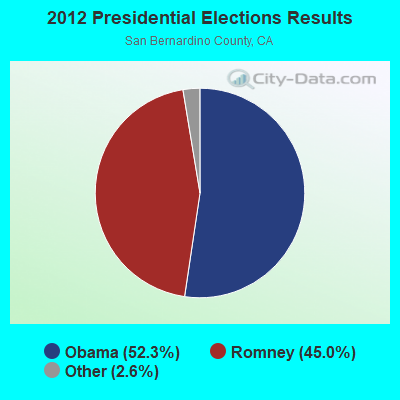
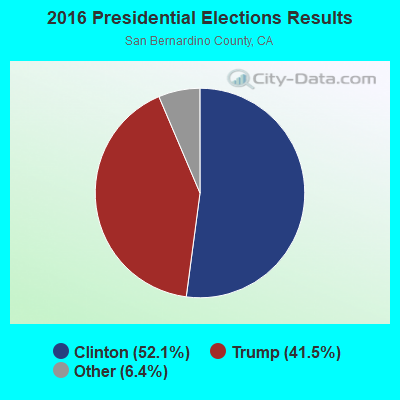
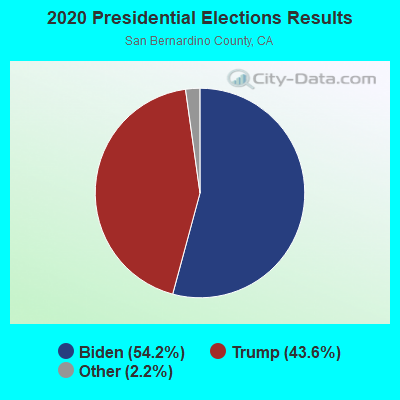
Graphs represent county-level data. Detailed 2008 Election Results
Neighborhoods in Ontario:
(Ontario, California Neighborhood Map)Religion statistics for Ontario, CA (based on San Bernardino County data)
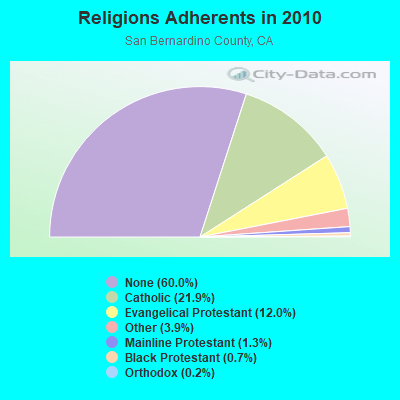
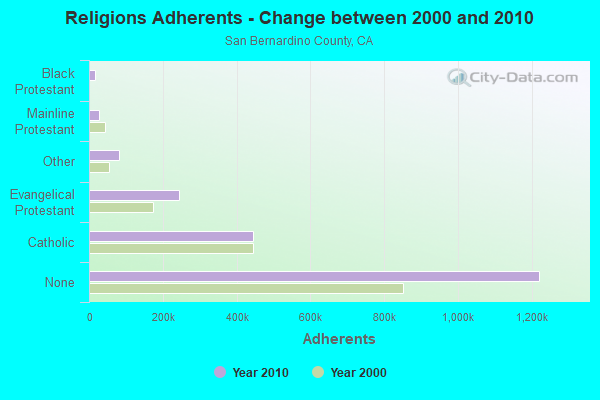
| Religion | Adherents | Congregations |
|---|---|---|
| Catholic | 445,334 | 55 |
| Evangelical Protestant | 243,524 | 832 |
| Other | 80,047 | 205 |
| Mainline Protestant | 26,062 | 135 |
| Black Protestant | 14,969 | 37 |
| Orthodox | 3,868 | 10 |
| None | 1,221,406 | - |
Food Environment Statistics:
| This county: | 1.50 / 10,000 pop. |
| State: | 2.14 / 10,000 pop. |
| San Bernardino County: | 0.05 / 10,000 pop. |
| California: | 0.04 / 10,000 pop. |
| Here: | 0.57 / 10,000 pop. |
| State: | 0.62 / 10,000 pop. |
| San Bernardino County: | 1.60 / 10,000 pop. |
| State: | 1.49 / 10,000 pop. |
| This county: | 4.69 / 10,000 pop. |
| California: | 7.42 / 10,000 pop. |
| Here: | 7.4% |
| California: | 7.3% |
| This county: | 27.1% |
| California: | 21.3% |
| San Bernardino County: | 16.2% |
| California: | 17.9% |
Health and Nutrition:
| Ontario: | 46.8% |
| California: | 49.4% |
| Ontario: | 47.1% |
| California: | 48.0% |
| This city: | 28.4 |
| California: | 28.1 |
| Ontario: | 21.7% |
| California: | 20.2% |
| Here: | 10.0% |
| California: | 11.2% |
| This city: | 6.7 |
| State: | 6.8 |
| This city: | 31.6% |
| State: | 31.5% |
| Here: | 55.5% |
| California: | 56.4% |
| Here: | 82.2% |
| California: | 80.9% |
More about Health and Nutrition of Ontario, CA Residents
| Local government employment and payroll (March 2022) | |||||
| Function | Full-time employees | Monthly full-time payroll | Average yearly full-time wage | Part-time employees | Monthly part-time payroll |
|---|---|---|---|---|---|
| Police Protection - Officers | 224 | $3,411,448 | $182,756 | 0 | $0 |
| Firefighters | 142 | $2,283,374 | $192,961 | 0 | $0 |
| Other and Unallocable | 110 | $1,275,278 | $139,121 | 5 | $7,212 |
| Water Supply | 108 | $978,629 | $108,737 | 11 | $24,593 |
| Solid Waste Management | 96 | $743,199 | $92,900 | 0 | $0 |
| Parks and Recreation | 83 | $663,883 | $95,983 | 197 | $175,507 |
| Airports | 80 | $1,351,708 | $202,756 | 0 | $0 |
| Police - Other | 73 | $626,063 | $102,914 | 16 | $23,794 |
| Other Government Administration | 72 | $830,874 | $138,479 | 22 | $29,748 |
| Financial Administration | 67 | $778,347 | $139,405 | 11 | $18,708 |
| Fire - Other | 37 | $366,063 | $118,723 | 13 | $31,375 |
| Local Libraries | 21 | $158,755 | $90,717 | 43 | $72,086 |
| Housing and Community Development (Local) | 14 | $175,460 | $150,394 | 2 | $4,977 |
| Totals for Government | 1,127 | $13,643,083 | $145,268 | 320 | $388,001 |
Ontario government finances - Expenditure in 2021 (per resident):
- Current Operations - General - Other: $145,850,000 ($814.53)
Police Protection: $102,216,000 ($570.84)
Local Fire Protection: $76,152,000 ($425.29)
Central Staff Services: $75,565,000 ($422.01)
Water Utilities: $51,672,000 ($288.57)
Solid Waste Management: $41,308,000 ($230.69)
Regular Highways: $34,303,000 ($191.57)
Parks and Recreation: $27,307,000 ($152.50)
Sewerage: $24,256,000 ($135.46)
Protective Inspection and Regulation - Other: $21,475,000 ($119.93)
Housing and Community Development: $12,533,000 ($69.99)
Libraries: $5,271,000 ($29.44)
Health - Other: $1,742,000 ($9.73)
- General - Interest on Debt: $16,155,000 ($90.22)
- Water Utilities - Interest on Debt: $3,154,000 ($17.61)
Ontario government finances - Revenue in 2021 (per resident):
- Charges - Other: $53,695,000 ($299.87)
Solid Waste Management: $41,913,000 ($234.07)
Sewerage: $30,012,000 ($167.61)
Parks and Recreation: $210,000 ($1.17)
- Federal Intergovernmental - Other: $28,676,000 ($160.15)
Housing and Community Development: $27,000 ($0.15)
- Miscellaneous - General Revenue - Other: $107,290,000 ($599.18)
Interest Earnings: $7,825,000 ($43.70)
Rents: $838,000 ($4.68)
Fines and Forfeits: $679,000 ($3.79)
- Revenue - Water Utilities: $61,508,000 ($343.50)
- State Intergovernmental - Other: $21,251,000 ($118.68)
Highways: $7,388,000 ($41.26)
Water Utilities: $2,577,000 ($14.39)
General Local Government Support: $313,000 ($1.75)
- Tax - General Sales and Gross Receipts: $107,310,000 ($599.29)
Property: $71,900,000 ($401.54)
Other License: $63,577,000 ($355.06)
Other Selective Sales: $12,339,000 ($68.91)
Occupation and Business License - Other: $8,559,000 ($47.80)
Public Utilities Sales: $3,512,000 ($19.61)
Documentary and Stock Transfer: $1,782,000 ($9.95)
Ontario government finances - Debt in 2021 (per resident):
- Long Term Debt - Outstanding Unspecified Public Purpose: $707,394,000 ($3950.58)
Beginning Outstanding - Unspecified Public Purpose: $675,346,000 ($3771.60)
Issue, Unspecified Public Purpose: $66,380,000 ($370.71)
Beginning Outstanding - Public Debt for Private Purpose: $48,300,000 ($269.74)
Outstanding Nonguaranteed - Industrial Revenue: $48,250,000 ($269.46)
Retired Unspecified Public Purpose: $34,332,000 ($191.73)
Retired Nonguaranteed - Public Debt for Private Purpose: $50,000 ($0.28)
Ontario government finances - Cash and Securities in 2021 (per resident):
- Bond Funds - Cash and Securities: $243,685,000 ($1360.90)
- Other Funds - Cash and Securities: $299,253,000 ($1671.23)
- Sinking Funds - Cash and Securities: $60,628,000 ($338.59)
6.45% of this county's 2021 resident taxpayers lived in other counties in 2020 ($54,954 average adjusted gross income)
| Here: | 6.45% |
| California average: | 5.19% |
0.03% of residents moved from foreign countries ($259 average AGI)
San Bernardino County: 0.03% California average: 0.03%
Top counties from which taxpayers relocated into this county between 2020 and 2021:
| from Los Angeles County, CA | |
| from Riverside County, CA | |
| from Orange County, CA |
6.46% of this county's 2020 resident taxpayers moved to other counties in 2021 ($59,647 average adjusted gross income)
| Here: | 6.46% |
| California average: | 6.14% |
0.03% of residents moved to foreign countries ($253 average AGI)
San Bernardino County: 0.03% California average: 0.02%
Top counties to which taxpayers relocated from this county between 2020 and 2021:
| to Riverside County, CA | |
| to Los Angeles County, CA | |
| to Orange County, CA |
| Businesses in Ontario, CA | ||||
| Name | Count | Name | Count | |
|---|---|---|---|---|
| 24 Hour Fitness | 1 | KFC | 3 | |
| 7-Eleven | 8 | Kincaid | 1 | |
| 99 Cents Only Stores | 1 | Kmart | 2 | |
| ALDO | 1 | Knights Inn | 1 | |
| AT&T | 1 | Kohl's | 1 | |
| Aeropostale | 1 | Kroger | 3 | |
| Albertsons | 2 | La Quinta | 1 | |
| American Eagle Outfitters | 1 | La-Z-Boy | 1 | |
| Ann Taylor | 1 | Lane Furniture | 1 | |
| Applebee's | 1 | LensCrafters | 1 | |
| Arby's | 2 | Levi Strauss & Co. | 1 | |
| AutoZone | 5 | Little Caesars Pizza | 5 | |
| Avenue | 1 | Lowe's | 1 | |
| BMW | 1 | Marriott | 2 | |
| Baja Fresh Mexican Grill | 1 | Marshalls | 1 | |
| Bakers | 1 | MasterBrand Cabinets | 2 | |
| Banana Republic | 1 | Mazda | 1 | |
| Baskin-Robbins | 2 | McDonald's | 6 | |
| Bath & Body Works | 1 | Motel 6 | 2 | |
| Bed Bath & Beyond | 1 | Motherhood Maternity | 1 | |
| Best Western | 2 | New Balance | 2 | |
| Big O Tires | 1 | Nike | 9 | |
| Blockbuster | 1 | Nissan | 1 | |
| Budget Car Rental | 1 | Nordstrom | 1 | |
| Burger King | 7 | Office Depot | 1 | |
| Burlington Coat Factory | 1 | Old Navy | 1 | |
| CVS | 2 | Olive Garden | 1 | |
| CarMax | 1 | Outback | 1 | |
| Carl\s Jr. | 8 | Outback Steakhouse | 1 | |
| Casual Male XL | 1 | Pac Sun | 1 | |
| Charlotte Russe | 1 | Panda Express | 2 | |
| Chevrolet | 1 | Papa John's Pizza | 1 | |
| Chick-Fil-A | 1 | Payless | 1 | |
| Church's Chicken | 1 | Penske | 1 | |
| Cinnabon | 1 | PetSmart | 1 | |
| Circle K | 4 | Pizza Hut | 3 | |
| Clarks | 1 | Popeyes | 2 | |
| Cold Stone Creamery | 2 | Qdoba Mexican Grill | 1 | |
| Curves | 1 | Quality | 1 | |
| DHL | 1 | Quiznos | 2 | |
| Dairy Queen | 1 | RadioShack | 2 | |
| Days Inn | 1 | Ramada | 1 | |
| Decora Cabinetry | 1 | Red Lobster | 1 | |
| Dennys | 4 | Red Roof Inn | 1 | |
| Discount Tire | 1 | Rite Aid | 4 | |
| Domino's Pizza | 2 | Rodeway Inn | 1 | |
| DressBarn | 1 | Sam's Club | 1 | |
| Econo Lodge | 1 | Sears | 4 | |
| El Pollo Loco | 4 | Sheraton | 1 | |
| Extended Stay America | 1 | Skechers USA | 1 | |
| Famous Footwear | 1 | Spencer Gifts | 1 | |
| FedEx | 12 | Sprint Nextel | 3 | |
| Finish Line | 1 | Staples | 1 | |
| Foot Locker | 1 | Starbucks | 9 | |
| Forever 21 | 1 | Subaru | 1 | |
| Fredericks Of Hollywood | 1 | Subway | 7 | |
| GNC | 2 | Super 8 | 1 | |
| GameStop | 1 | T-Mobile | 6 | |
| Gap | 1 | T.G.I. Driday's | 2 | |
| Gymboree | 1 | Taco Bell | 5 | |
| H&M | 1 | Target | 1 | |
| H&R Block | 5 | The Room Place | 1 | |
| Haagen-Dazs | 1 | Torrid | 1 | |
| Hilton | 3 | Toyota | 1 | |
| Holiday Inn | 2 | Toys"R"Us | 2 | |
| Home Depot | 1 | U-Haul | 5 | |
| Honda | 1 | UPS | 22 | |
| Hot Topic | 1 | Vans | 6 | |
| IHOP | 2 | Verizon Wireless | 2 | |
| J.Crew | 1 | Victoria's Secret | 1 | |
| JCPenney | 1 | Volkswagen | 1 | |
| Jack In The Box | 11 | Walgreens | 2 | |
| Jamba Juice | 1 | Wendy's | 3 | |
| Journeys | 1 | Wet Seal | 1 | |
| Justice | 1 | YMCA | 1 | |
Strongest AM radio stations in Ontario:
- KPLS (830 AM; 50 kW; ORANGE, CA; Owner: CRN LICENSES, LLC)
- KSPA (1510 AM; 10 kW; ONTARIO, CA; Owner: ONTARIO BROADCASTING, LLC)
- KLAC (570 AM; 50 kW; LOS ANGELES, CA; Owner: AMFM RADIO LICENSES, L.L.C.)
- KTNQ (1020 AM; 50 kW; LOS ANGELES, CA; Owner: KTNQ-AM LICENSE CORP.)
- KFI (640 AM; 50 kW; LOS ANGELES, CA; Owner: CAPSTAR TX LIMITED PARTNERSHIP)
- KXTA (1150 AM; 50 kW; LOS ANGELES, CA; Owner: CITICASTERS LICENSES, L.P.)
- KDIS (1110 AM; 50 kW; PASADENA, CA; Owner: ABC,INC.)
- KMNY (1600 AM; 5 kW; POMONA, CA; Owner: MULTICULTURAL RADIO BROADCASTING, INC.)
- KFWB (980 AM; 50 kW; LOS ANGELES, CA; Owner: INFINITY BROADCASTING OPERATIONS, INC.)
- KMPC (1540 AM; 50 kW; LOS ANGELES, CA; Owner: ROSE CITY RADIO CORPORATION)
- KSPN (710 AM; 50 kW; LOS ANGELES, CA; Owner: KABC-AM RADIO, INC.)
- KBLA (1580 AM; 50 kW; SANTA MONICA, CA)
- KNX (1070 AM; 50 kW; LOS ANGELES, CA; Owner: INFINITY BROADCASTING OPERATIONS, INC.)
Strongest FM radio stations in Ontario:
- K264AF (100.7 FM; GUASTI, CA; Owner: EDUCATIONAL MEDIA FOUNDATION)
- K295AI (106.9 FM; MUSCOY, CA; Owner: ASSOCIATION FOR COMMUNITY EDUCATION, INC.)
- KCBS-FM (93.1 FM; LOS ANGELES, CA; Owner: INFINITY BROADCASTING OPERATIONS, INC.)
- KSCA (101.9 FM; GLENDALE, CA; Owner: HBC LICENSE CORPORATION)
- KLOS (95.5 FM; LOS ANGELES, CA; Owner: KLOS-FM RADIO, INC.)
- K212FA (90.3 FM; TEMPLE CITY, CA; Owner: EDUCATIONAL MEDIA FOUNDATION)
- KOST (103.5 FM; LOS ANGELES, CA; Owner: CAPSTAR TX LIMITED PARTNERSHIP)
- KRCV (98.3 FM; WEST COVINA, CA; Owner: HBC LICENSE CORPORATION)
- KIIS-FM (102.7 FM; LOS ANGELES, CA; Owner: CITICASTERS LICENSES, L.P.)
- KLVE (107.5 FM; LOS ANGELES, CA; Owner: KLVE-FM LICENSE CORP.)
- KUOR-FM (89.1 FM; REDLANDS, CA; Owner: UNIVERSITY OF REDLANDS)
- KPCC (89.3 FM; PASADENA, CA; Owner: PASADENA AREA COMMUNITY COLLEGE DISTRICT)
- KHHT (92.3 FM; LOS ANGELES, CA; Owner: AMFM RADIO LICENSES, L.L.C.)
- KBIG-FM (104.3 FM; LOS ANGELES, CA; Owner: AMFM RADIO LICENSES, L.L.C.)
- KMZT-FM (105.1 FM; LOS ANGELES, CA; Owner: MOUNT WILSON FM BROADCASTERS, INC.)
- KTWV (94.7 FM; LOS ANGELES, CA; Owner: INFINITY BROADCASTING OPERATIONS, INC.)
- KPFK (90.7 FM; LOS ANGELES, CA; Owner: PACIFICA FOUNDATION, INC)
- K216EM (91.1 FM; ARCADIA, CA; Owner: LIFE ON THE WAY COMMUNICATIONS, INC.)
- KOLA (99.9 FM; SAN BERNARDINO, CA; Owner: INLAND EMPIRE BROADCASTING CORP.)
- KZLA-FM (93.9 FM; LOS ANGELES, CA; Owner: EMMIS RADIO LICENSE CORPORATION)
TV broadcast stations around Ontario:
- KTRO-LP (Channel 50; LANCASTER, CA; Owner: ROBERT D. ADELMAN)
- KHIZ (Channel 64; BARSTOW, CA; Owner: SUNBELT TELEVISION, INC.)
- KCBS-TV (Channel 2; LOS ANGELES, CA; Owner: CBS BROADCASTING INC.)
- KRCA (Channel 62; RIVERSIDE, CA; Owner: KRCA LICENSE CORP.)
- KPXN (Channel 30; SAN BERNARDINO, CA; Owner: PAXSON LOS ANGELES LICENSE, INC.)
- KTLA-TV (Channel 5; LOS ANGELES, CA; Owner: KTLA INC.)
- KABC-TV (Channel 7; LOS ANGELES, CA; Owner: ABC HOLDING COMPANY, INC.)
- KCAL-TV (Channel 9; LOS ANGELES, CA; Owner: VIACOM TELEVISION STATIONS GROUP OF LOS ANGELES LLC)
- KNBC (Channel 4; LOS ANGELES, CA; Owner: NBC SUBSIDIARY (KNBC-TV), INC.)
- KVCR-TV (Channel 24; SAN BERNARDINO, CA; Owner: SAN BERNARDINO COMMUNITY COLLEGE DISTRICT)
- National Bridge Inventory (NBI) Statistics
- 156Number of bridges
- 1,709ft / 521mTotal length
- $1,897,000Total costs
- 11,238,700Total average daily traffic
- 1,092,420Total average daily truck traffic
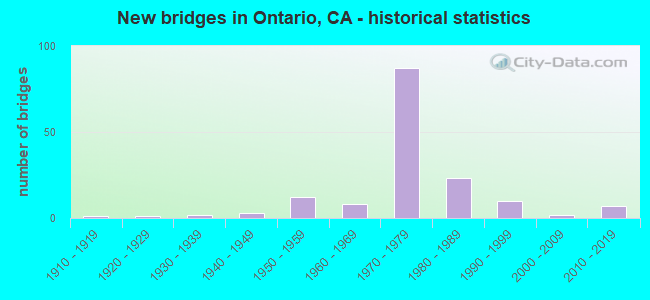
- New bridges - historical statistics
- 11910-1919
- 11920-1929
- 21930-1939
- 31940-1949
- 121950-1959
- 81960-1969
- 871970-1979
- 231980-1989
- 101990-1999
- 22000-2009
- 72010-2019
FCC Registered Private Land Mobile Towers: 5 (See the full list of FCC Registered Private Land Mobile Towers in Ontario, CA)
FCC Registered Broadcast Land Mobile Towers: 143 (See the full list of FCC Registered Broadcast Land Mobile Towers)
FCC Registered Microwave Towers: 184 (See the full list of FCC Registered Microwave Towers in this town)
FCC Registered Paging Towers: 2 (See the full list of FCC Registered Paging Towers)
FCC Registered Maritime Coast & Aviation Ground Towers: 34 (See the full list of FCC Registered Maritime Coast & Aviation Ground Towers)
FCC Registered Amateur Radio Licenses: 510 (See the full list of FCC Registered Amateur Radio Licenses in Ontario)
FAA Registered Aircraft Manufacturers and Dealers: 4 (See the full list of FAA Registered Manufacturers and Dealers in Ontario)
FAA Registered Aircraft: 56 (See the full list of FAA Registered Aircraft)
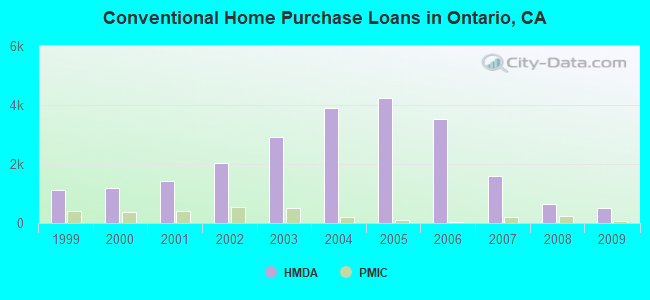
| Home Mortgage Disclosure Act Aggregated Statistics For Year 2009 (Based on 14 full and 5 partial tracts) | ||||||||||||||
| A) FHA, FSA/RHS & VA Home Purchase Loans | B) Conventional Home Purchase Loans | C) Refinancings | D) Home Improvement Loans | E) Loans on Dwellings For 5+ Families | F) Non-occupant Loans on < 5 Family Dwellings (A B C & D) | G) Loans On Manufactured Home Dwelling (A B C & D) | ||||||||
|---|---|---|---|---|---|---|---|---|---|---|---|---|---|---|
| Number | Average Value | Number | Average Value | Number | Average Value | Number | Average Value | Number | Average Value | Number | Average Value | Number | Average Value | |
| LOANS ORIGINATED | 1,019 | $225,288 | 513 | $185,944 | 1,233 | $213,213 | 60 | $132,374 | 11 | $2,559,281 | 156 | $163,551 | 11 | $42,021 |
| APPLICATIONS APPROVED, NOT ACCEPTED | 101 | $232,639 | 100 | $195,498 | 202 | $217,827 | 32 | $41,973 | 0 | $0 | 35 | $171,474 | 4 | $40,558 |
| APPLICATIONS DENIED | 187 | $229,145 | 169 | $175,585 | 689 | $228,131 | 88 | $78,513 | 0 | $0 | 107 | $151,758 | 24 | $64,809 |
| APPLICATIONS WITHDRAWN | 208 | $215,680 | 94 | $193,238 | 365 | $220,111 | 18 | $117,601 | 1 | $210,620 | 41 | $159,963 | 1 | $33,430 |
| FILES CLOSED FOR INCOMPLETENESS | 57 | $202,468 | 36 | $203,245 | 117 | $240,939 | 10 | $135,879 | 0 | $0 | 17 | $167,044 | 0 | $0 |
Detailed mortgage data for all 19 tracts in Ontario, CA
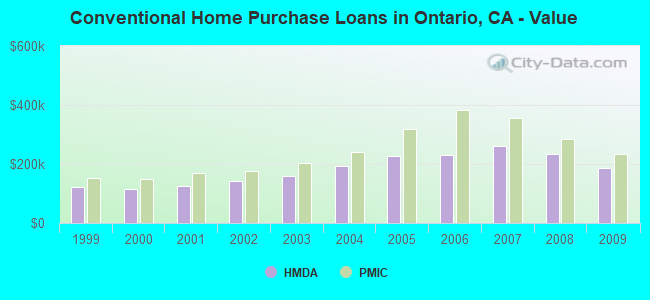
| Private Mortgage Insurance Companies Aggregated Statistics For Year 2009 (Based on 14 full and 4 partial tracts) | ||||||
| A) Conventional Home Purchase Loans | B) Refinancings | C) Non-occupant Loans on < 5 Family Dwellings (A & B) | ||||
|---|---|---|---|---|---|---|
| Number | Average Value | Number | Average Value | Number | Average Value | |
| LOANS ORIGINATED | 71 | $232,294 | 15 | $257,164 | 0 | $0 |
| APPLICATIONS APPROVED, NOT ACCEPTED | 46 | $231,312 | 9 | $265,887 | 1 | $225,000 |
| APPLICATIONS DENIED | 12 | $226,410 | 4 | $252,145 | 0 | $0 |
| APPLICATIONS WITHDRAWN | 6 | $283,458 | 1 | $287,870 | 0 | $0 |
| FILES CLOSED FOR INCOMPLETENESS | 6 | $228,768 | 1 | $289,770 | 1 | $121,000 |
2005 - 2017 National Fire Incident Reporting System (NFIRS) incidents
- Fire incident types reported to NFIRS in Ontario, CA
- 2,34441.4%Outside Fires
- 1,68129.7%Structure Fires
- 1,61128.5%Mobile Property/Vehicle Fires
- 250.4%Other
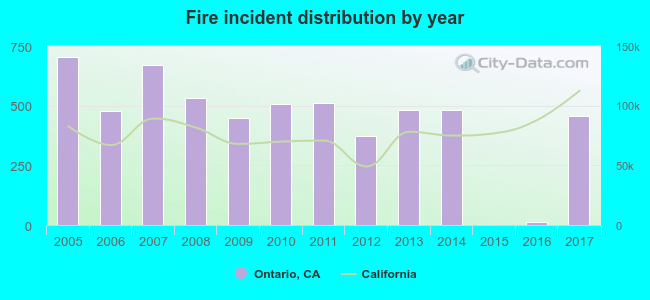 Based on the data from the years 2005 - 2017 the average number of fire incidents per year is 435. The highest number of fires - 703 took place in 2005, and the least - 2 in 2015. The data has a dropping trend.
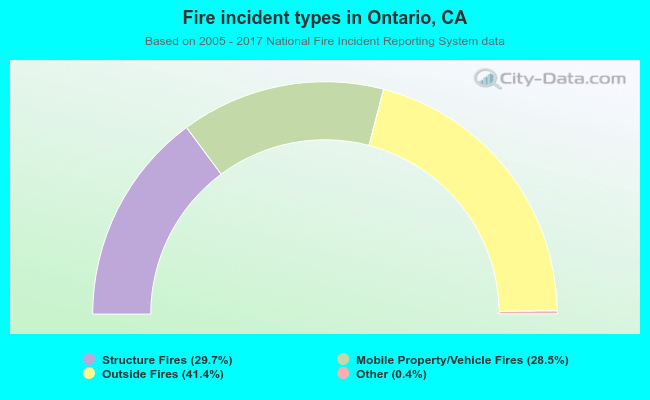 When looking into fire subcategories, the most incidents belonged to: Outside Fires (41.4%), and Structure Fires (29.7%).
Fire-safe hotels and motels in Ontario, California:
- Ontario Airport Hotel, 700 N Haven Ave, Ontario, California 91764 , Phone: (909) 980-0400, Fax: (909) 948-3809
- Radisson Ontario Airport, 2200 E Holt Blvd, Ontario, California 91761 , Phone: (909) 986-8811, Fax: (909) 391-6151
- Fairfield Inn-ontario, 3201 CTR LK Dr, Ontario, California 91761 , Phone: (909) 390-9855, Fax: (909) 390-9855
- Country Inn & Suites By Carlson, 231 N Vineyard Ave, Ontario, California 91764 , Phone: (909) 937-6000, Fax: (909) 472-9010
- Residence Inn By Marriott - Ontario Airport, 2025 Convention Center Way, Ontario, California 91764 , Phone: (909) 937-6788, Fax: (909) 937-2462
- Econolodge Airport S, 2301 S Euclid Ave, Ontario, California 91762 , Phone: (909) 986-3556
- Extended Stay America - Los Angeles - Ontario Airport, 3990 E Inland Empire Blvd, Ontario, California 91764 , Phone: (909) 944-8900, Fax: (909) 944-8911
- Best Western Inn & Suites, 3400 Shelby St, Ontario, California 91764 , Phone: (909) 466-9600, Fax: (909) 941-1445
- 19 other hotels and motels
| Most common first names in Ontario, CA among deceased individuals | ||
| Name | Count | Lived (average) |
|---|---|---|
| John | 473 | 72.4 years |
| Mary | 410 | 78.2 years |
| William | 361 | 73.2 years |
| Robert | 355 | 68.0 years |
| James | 307 | 70.7 years |
| Charles | 261 | 73.1 years |
| George | 201 | 73.7 years |
| Helen | 198 | 77.8 years |
| Frank | 180 | 74.3 years |
| Maria | 178 | 75.7 years |
| Most common last names in Ontario, CA among deceased individuals | ||
| Last name | Count | Lived (average) |
|---|---|---|
| Smith | 155 | 74.5 years |
| Brown | 99 | 71.3 years |
| Johnson | 98 | 74.2 years |
| Williams | 92 | 70.4 years |
| Hernandez | 83 | 65.5 years |
| Martinez | 82 | 67.7 years |
| Garcia | 78 | 69.2 years |
| Anderson | 76 | 73.6 years |
| Davis | 74 | 74.4 years |
| Miller | 72 | 71.8 years |
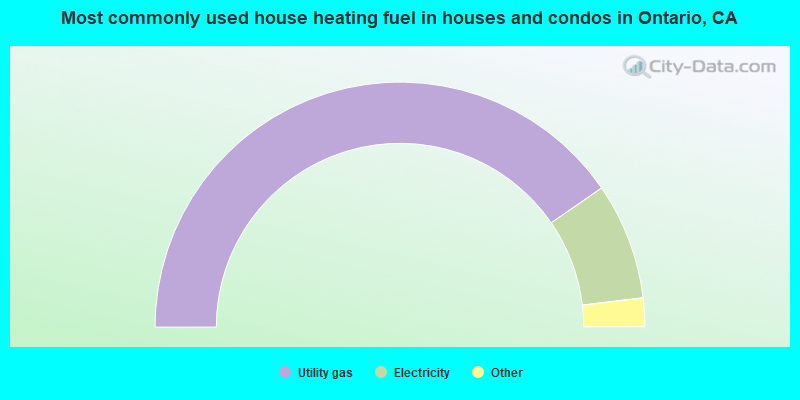
- 80.8%Utility gas
- 15.4%Electricity
- 1.6%No fuel used
- 1.6%Bottled, tank, or LP gas
- 0.6%Solar energy
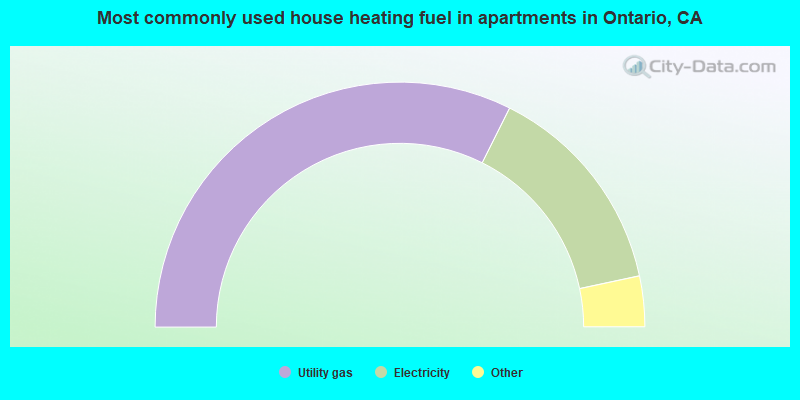
- 64.8%Utility gas
- 28.5%Electricity
- 3.3%No fuel used
- 2.5%Bottled, tank, or LP gas
- 0.5%Other fuel
- 0.3%Wood
Ontario compared to California state average:
- Unemployed percentage below state average.
- Hispanic race population percentage above state average.
Ontario, CA compared to other similar cities:
Ontario on our top lists:
- #24 on the list of "Top 101 cities with largest percentage of females in industries: wholesale trade (population 50,000+)"
- #29 on the list of "Top 101 cities with the highest percentage of family households, population 100,000+"
- #32 on the list of "Top 101 cities with the least people having Doctorate degrees (population 50,000+)"
- #40 on the list of "Top 101 cities with largest percentage of males in industries: transportation and warehousing (population 50,000+)"
- #40 on the list of "Top 101 cities with the least people having Master's or Doctorate degrees (population 50,000+)"
- #49 on the list of "Top 101 cities with largest percentage of females in occupations: material moving occupations (population 50,000+)"
- #50 on the list of "Top 101 cities with largest percentage of females in occupations: production occupations (population 50,000+)"
- #50 on the list of "Top 100 low-educated but high-earning cities (pop. 50,000+)"
- #53 on the list of "Top 101 cities with largest percentage of males in occupations: transportation occupations (population 50,000+)"
- #57 on the list of "Top 101 cities with the most cars per house, population 50,000+"
- #57 on the list of "Top 100 least-educated cities (pop. 50,000+)"
- #58 on the list of "Top 101 cities with largest percentage of males in occupations: farming, fishing, and forestry occupations (population 50,000+)"
- #61 on the list of "Top 101 cities with largest percentage of males in occupations: installation, maintenance, and repair occupations (population 50,000+)"
- #66 on the list of "Top 101 cities with largest percentage of males in occupations: material moving occupations (population 50,000+)"
- #73 on the list of "Top 101 cities with the lowest percentage of English-only speaking households, population 50,000+"
- #73 on the list of "Top 101 cities with the smallest percentage of elementary and middle school students in private schools (5,000+ students)"
- #77 on the list of "Top 101 cities with largest percentage of males in industries: agriculture, forestry, fishing and hunting (population 50,000+)"
- #82 on the list of "Top 101 cities with the lowest average snowfall in a year (population 50,000+)"
- #90 on the list of "Top 101 cities with the largest city-data.com crime index decrease from 2002 to 2012 (population 50,000+)"
- #92 on the list of "Top 101 cities with the highest number of auto thefts per 100,000 residents, excludes tourist destinations and others with a lot of outsiders visiting based on city industries data (population 50,000+)"
- #99 (91761) on the list of "Top 101 zip codes with the most medium-big companies in 2005 (at least 100 employees)"
- #5 on the list of "Top 101 counties with the highest Nitrogen Dioxide air pollution readings in 2012 (ppm)"
- #5 on the list of "Top 101 counties with the highest ground withdrawal of fresh water for public supply"
- #10 on the list of "Top 101 counties with the most Evangelical Protestant congregations"
- #14 on the list of "Top 101 counties with the highest total withdrawal of fresh water for public supply"
- #15 on the list of "Top 101 counties with the most Evangelical Protestant adherents (pop. 50,000+)"

|
|
Total of 228 patent applications in 2008-2024.