Pomona, California Submit your own pictures of this city and show them to the world
OSM Map
General Map
Google Map
MSN Map
OSM Map
General Map
Google Map
MSN Map
OSM Map
General Map
Google Map
MSN Map
OSM Map
General Map
Google Map
MSN Map
Please wait while loading the map...
Population in 2022: 146,017 (100% urban, 0% rural). Population change since 2000: -2.3%Males: 74,292 Females: 71,725
March 2022 cost of living index in Pomona: 136.8 (high, U.S. average is 100) Percentage of residents living in poverty in 2022: 12.0%for White Non-Hispanic residents , 22.8% for Black residents , 11.1% for Hispanic or Latino residents , 14.2% for American Indian residents , 24.9% for Native Hawaiian and other Pacific Islander residents , 11.9% for other race residents , 8.7% for two or more races residents )
Profiles of local businesses
Business Search - 14 Million verified businesses
Data:
Median household income ($)
Median household income (% change since 2000)
Household income diversity
Ratio of average income to average house value (%)
Ratio of average income to average rent
Median household income ($) - White
Median household income ($) - Black or African American
Median household income ($) - Asian
Median household income ($) - Hispanic or Latino
Median household income ($) - American Indian and Alaska Native
Median household income ($) - Multirace
Median household income ($) - Other Race
Median household income for houses/condos with a mortgage ($)
Median household income for apartments without a mortgage ($)
Races - White alone (%)
Races - White alone (% change since 2000)
Races - Black alone (%)
Races - Black alone (% change since 2000)
Races - American Indian alone (%)
Races - American Indian alone (% change since 2000)
Races - Asian alone (%)
Races - Asian alone (% change since 2000)
Races - Hispanic (%)
Races - Hispanic (% change since 2000)
Races - Native Hawaiian and Other Pacific Islander alone (%)
Races - Native Hawaiian and Other Pacific Islander alone (% change since 2000)
Races - Two or more races (%)
Races - Two or more races (% change since 2000)
Races - Other race alone (%)
Races - Other race alone (% change since 2000)
Racial diversity
Unemployment (%)
Unemployment (% change since 2000)
Unemployment (%) - White
Unemployment (%) - Black or African American
Unemployment (%) - Asian
Unemployment (%) - Hispanic or Latino
Unemployment (%) - American Indian and Alaska Native
Unemployment (%) - Multirace
Unemployment (%) - Other Race
Population density (people per square mile)
Population - Males (%)
Population - Females (%)
Population - Males (%) - White
Population - Males (%) - Black or African American
Population - Males (%) - Asian
Population - Males (%) - Hispanic or Latino
Population - Males (%) - American Indian and Alaska Native
Population - Males (%) - Multirace
Population - Males (%) - Other Race
Population - Females (%) - White
Population - Females (%) - Black or African American
Population - Females (%) - Asian
Population - Females (%) - Hispanic or Latino
Population - Females (%) - American Indian and Alaska Native
Population - Females (%) - Multirace
Population - Females (%) - Other Race
Coronavirus confirmed cases (Apr 27, 2024)
Deaths caused by coronavirus (Apr 27, 2024)
Coronavirus confirmed cases (per 100k population) (Apr 27, 2024)
Deaths caused by coronavirus (per 100k population) (Apr 27, 2024)
Daily increase in number of cases (Apr 27, 2024)
Weekly increase in number of cases (Apr 27, 2024)
Cases doubled (in days) (Apr 27, 2024)
Hospitalized patients (Apr 18, 2022)
Negative test results (Apr 18, 2022)
Total test results (Apr 18, 2022)
COVID Vaccine doses distributed (per 100k population) (Sep 19, 2023)
COVID Vaccine doses administered (per 100k population) (Sep 19, 2023)
COVID Vaccine doses distributed (Sep 19, 2023)
COVID Vaccine doses administered (Sep 19, 2023)
Likely homosexual households (%)
Likely homosexual households (% change since 2000)
Likely homosexual households - Lesbian couples (%)
Likely homosexual households - Lesbian couples (% change since 2000)
Likely homosexual households - Gay men (%)
Likely homosexual households - Gay men (% change since 2000)
Cost of living index
Median gross rent ($)
Median contract rent ($)
Median monthly housing costs ($)
Median house or condo value ($)
Median house or condo value ($ change since 2000)
Mean house or condo value by units in structure - 1, detached ($)
Mean house or condo value by units in structure - 1, attached ($)
Mean house or condo value by units in structure - 2 ($)
Mean house or condo value by units in structure by units in structure - 3 or 4 ($)
Mean house or condo value by units in structure - 5 or more ($)
Mean house or condo value by units in structure - Boat, RV, van, etc. ($)
Mean house or condo value by units in structure - Mobile home ($)
Median house or condo value ($) - White
Median house or condo value ($) - Black or African American
Median house or condo value ($) - Asian
Median house or condo value ($) - Hispanic or Latino
Median house or condo value ($) - American Indian and Alaska Native
Median house or condo value ($) - Multirace
Median house or condo value ($) - Other Race
Median resident age
Resident age diversity
Median resident age - Males
Median resident age - Females
Median resident age - White
Median resident age - Black or African American
Median resident age - Asian
Median resident age - Hispanic or Latino
Median resident age - American Indian and Alaska Native
Median resident age - Multirace
Median resident age - Other Race
Median resident age - Males - White
Median resident age - Males - Black or African American
Median resident age - Males - Asian
Median resident age - Males - Hispanic or Latino
Median resident age - Males - American Indian and Alaska Native
Median resident age - Males - Multirace
Median resident age - Males - Other Race
Median resident age - Females - White
Median resident age - Females - Black or African American
Median resident age - Females - Asian
Median resident age - Females - Hispanic or Latino
Median resident age - Females - American Indian and Alaska Native
Median resident age - Females - Multirace
Median resident age - Females - Other Race
Commute - mean travel time to work (minutes)
Travel time to work - Less than 5 minutes (%)
Travel time to work - Less than 5 minutes (% change since 2000)
Travel time to work - 5 to 9 minutes (%)
Travel time to work - 5 to 9 minutes (% change since 2000)
Travel time to work - 10 to 19 minutes (%)
Travel time to work - 10 to 19 minutes (% change since 2000)
Travel time to work - 20 to 29 minutes (%)
Travel time to work - 20 to 29 minutes (% change since 2000)
Travel time to work - 30 to 39 minutes (%)
Travel time to work - 30 to 39 minutes (% change since 2000)
Travel time to work - 40 to 59 minutes (%)
Travel time to work - 40 to 59 minutes (% change since 2000)
Travel time to work - 60 to 89 minutes (%)
Travel time to work - 60 to 89 minutes (% change since 2000)
Travel time to work - 90 or more minutes (%)
Travel time to work - 90 or more minutes (% change since 2000)
Marital status - Never married (%)
Marital status - Now married (%)
Marital status - Separated (%)
Marital status - Widowed (%)
Marital status - Divorced (%)
Median family income ($)
Median family income (% change since 2000)
Median non-family income ($)
Median non-family income (% change since 2000)
Median per capita income ($)
Median per capita income (% change since 2000)
Median family income ($) - White
Median family income ($) - Black or African American
Median family income ($) - Asian
Median family income ($) - Hispanic or Latino
Median family income ($) - American Indian and Alaska Native
Median family income ($) - Multirace
Median family income ($) - Other Race
Median year house/condo built
Median year apartment built
Year house built - Built 2005 or later (%)
Year house built - Built 2000 to 2004 (%)
Year house built - Built 1990 to 1999 (%)
Year house built - Built 1980 to 1989 (%)
Year house built - Built 1970 to 1979 (%)
Year house built - Built 1960 to 1969 (%)
Year house built - Built 1950 to 1959 (%)
Year house built - Built 1940 to 1949 (%)
Year house built - Built 1939 or earlier (%)
Average household size
Household density (households per square mile)
Average household size - White
Average household size - Black or African American
Average household size - Asian
Average household size - Hispanic or Latino
Average household size - American Indian and Alaska Native
Average household size - Multirace
Average household size - Other Race
Occupied housing units (%)
Vacant housing units (%)
Owner occupied housing units (%)
Renter occupied housing units (%)
Vacancy status - For rent (%)
Vacancy status - For sale only (%)
Vacancy status - Rented or sold, not occupied (%)
Vacancy status - For seasonal, recreational, or occasional use (%)
Vacancy status - For migrant workers (%)
Vacancy status - Other vacant (%)
Residents with income below the poverty level (%)
Residents with income below 50% of the poverty level (%)
Children below poverty level (%)
Poor families by family type - Married-couple family (%)
Poor families by family type - Male, no wife present (%)
Poor families by family type - Female, no husband present (%)
Poverty status for native-born residents (%)
Poverty status for foreign-born residents (%)
Poverty among high school graduates not in families (%)
Poverty among people who did not graduate high school not in families (%)
Residents with income below the poverty level (%) - White
Residents with income below the poverty level (%) - Black or African American
Residents with income below the poverty level (%) - Asian
Residents with income below the poverty level (%) - Hispanic or Latino
Residents with income below the poverty level (%) - American Indian and Alaska Native
Residents with income below the poverty level (%) - Multirace
Residents with income below the poverty level (%) - Other Race
Air pollution - Air Quality Index (AQI)
Air pollution - CO
Air pollution - NO2
Air pollution - SO2
Air pollution - Ozone
Air pollution - PM10
Air pollution - PM25
Air pollution - Pb
Crime - Murders per 100,000 population
Crime - Rapes per 100,000 population
Crime - Robberies per 100,000 population
Crime - Assaults per 100,000 population
Crime - Burglaries per 100,000 population
Crime - Thefts per 100,000 population
Crime - Auto thefts per 100,000 population
Crime - Arson per 100,000 population
Crime - City-data.com crime index
Crime - Violent crime index
Crime - Property crime index
Crime - Murders per 100,000 population (5 year average)
Crime - Rapes per 100,000 population (5 year average)
Crime - Robberies per 100,000 population (5 year average)
Crime - Assaults per 100,000 population (5 year average)
Crime - Burglaries per 100,000 population (5 year average)
Crime - Thefts per 100,000 population (5 year average)
Crime - Auto thefts per 100,000 population (5 year average)
Crime - Arson per 100,000 population (5 year average)
Crime - City-data.com crime index (5 year average)
Crime - Violent crime index (5 year average)
Crime - Property crime index (5 year average)
1996 Presidential Elections Results (%) - Democratic Party (Clinton)
1996 Presidential Elections Results (%) - Republican Party (Dole)
1996 Presidential Elections Results (%) - Other
2000 Presidential Elections Results (%) - Democratic Party (Gore)
2000 Presidential Elections Results (%) - Republican Party (Bush)
2000 Presidential Elections Results (%) - Other
2004 Presidential Elections Results (%) - Democratic Party (Kerry)
2004 Presidential Elections Results (%) - Republican Party (Bush)
2004 Presidential Elections Results (%) - Other
2008 Presidential Elections Results (%) - Democratic Party (Obama)
2008 Presidential Elections Results (%) - Republican Party (McCain)
2008 Presidential Elections Results (%) - Other
2012 Presidential Elections Results (%) - Democratic Party (Obama)
2012 Presidential Elections Results (%) - Republican Party (Romney)
2012 Presidential Elections Results (%) - Other
2016 Presidential Elections Results (%) - Democratic Party (Clinton)
2016 Presidential Elections Results (%) - Republican Party (Trump)
2016 Presidential Elections Results (%) - Other
2020 Presidential Elections Results (%) - Democratic Party (Biden)
2020 Presidential Elections Results (%) - Republican Party (Trump)
2020 Presidential Elections Results (%) - Other
Ancestries Reported - Arab (%)
Ancestries Reported - Czech (%)
Ancestries Reported - Danish (%)
Ancestries Reported - Dutch (%)
Ancestries Reported - English (%)
Ancestries Reported - French (%)
Ancestries Reported - French Canadian (%)
Ancestries Reported - German (%)
Ancestries Reported - Greek (%)
Ancestries Reported - Hungarian (%)
Ancestries Reported - Irish (%)
Ancestries Reported - Italian (%)
Ancestries Reported - Lithuanian (%)
Ancestries Reported - Norwegian (%)
Ancestries Reported - Polish (%)
Ancestries Reported - Portuguese (%)
Ancestries Reported - Russian (%)
Ancestries Reported - Scotch-Irish (%)
Ancestries Reported - Scottish (%)
Ancestries Reported - Slovak (%)
Ancestries Reported - Subsaharan African (%)
Ancestries Reported - Swedish (%)
Ancestries Reported - Swiss (%)
Ancestries Reported - Ukrainian (%)
Ancestries Reported - United States (%)
Ancestries Reported - Welsh (%)
Ancestries Reported - West Indian (%)
Ancestries Reported - Other (%)
Educational Attainment - No schooling completed (%)
Educational Attainment - Less than high school (%)
Educational Attainment - High school or equivalent (%)
Educational Attainment - Less than 1 year of college (%)
Educational Attainment - 1 or more years of college (%)
Educational Attainment - Associate degree (%)
Educational Attainment - Bachelor's degree (%)
Educational Attainment - Master's degree (%)
Educational Attainment - Professional school degree (%)
Educational Attainment - Doctorate degree (%)
School Enrollment - Nursery, preschool (%)
School Enrollment - Kindergarten (%)
School Enrollment - Grade 1 to 4 (%)
School Enrollment - Grade 5 to 8 (%)
School Enrollment - Grade 9 to 12 (%)
School Enrollment - College undergrad (%)
School Enrollment - Graduate or professional (%)
School Enrollment - Not enrolled in school (%)
School enrollment - Public schools (%)
School enrollment - Private schools (%)
School enrollment - Not enrolled (%)
Median number of rooms in houses and condos
Median number of rooms in apartments
Housing units lacking complete plumbing facilities (%)
Housing units lacking complete kitchen facilities (%)
Density of houses
Urban houses (%)
Rural houses (%)
Households with people 60 years and over (%)
Households with people 65 years and over (%)
Households with people 75 years and over (%)
Households with one or more nonrelatives (%)
Households with no nonrelatives (%)
Population in households (%)
Family households (%)
Nonfamily households (%)
Population in families (%)
Family households with own children (%)
Median number of bedrooms in owner occupied houses
Mean number of bedrooms in owner occupied houses
Median number of bedrooms in renter occupied houses
Mean number of bedrooms in renter occupied houses
Median number of vehichles in owner occupied houses
Mean number of vehichles in owner occupied houses
Median number of vehichles in renter occupied houses
Mean number of vehichles in renter occupied houses
Mortgage status - with mortgage (%)
Mortgage status - with second mortgage (%)
Mortgage status - with home equity loan (%)
Mortgage status - with both second mortgage and home equity loan (%)
Mortgage status - without a mortgage (%)
Average family size
Average family size - White
Average family size - Black or African American
Average family size - Asian
Average family size - Hispanic or Latino
Average family size - American Indian and Alaska Native
Average family size - Multirace
Average family size - Other Race
Geographical mobility - Same house 1 year ago (%)
Geographical mobility - Moved within same county (%)
Geographical mobility - Moved from different county within same state (%)
Geographical mobility - Moved from different state (%)
Geographical mobility - Moved from abroad (%)
Place of birth - Born in state of residence (%)
Place of birth - Born in other state (%)
Place of birth - Native, outside of US (%)
Place of birth - Foreign born (%)
Housing units in structures - 1, detached (%)
Housing units in structures - 1, attached (%)
Housing units in structures - 2 (%)
Housing units in structures - 3 or 4 (%)
Housing units in structures - 5 to 9 (%)
Housing units in structures - 10 to 19 (%)
Housing units in structures - 20 to 49 (%)
Housing units in structures - 50 or more (%)
Housing units in structures - Mobile home (%)
Housing units in structures - Boat, RV, van, etc. (%)
House/condo owner moved in on average (years ago)
Renter moved in on average (years ago)
Year householder moved into unit - Moved in 1999 to March 2000 (%)
Year householder moved into unit - Moved in 1995 to 1998 (%)
Year householder moved into unit - Moved in 1990 to 1994 (%)
Year householder moved into unit - Moved in 1980 to 1989 (%)
Year householder moved into unit - Moved in 1970 to 1979 (%)
Year householder moved into unit - Moved in 1969 or earlier (%)
Means of transportation to work - Drove car alone (%)
Means of transportation to work - Carpooled (%)
Means of transportation to work - Public transportation (%)
Means of transportation to work - Bus or trolley bus (%)
Means of transportation to work - Streetcar or trolley car (%)
Means of transportation to work - Subway or elevated (%)
Means of transportation to work - Railroad (%)
Means of transportation to work - Ferryboat (%)
Means of transportation to work - Taxicab (%)
Means of transportation to work - Motorcycle (%)
Means of transportation to work - Bicycle (%)
Means of transportation to work - Walked (%)
Means of transportation to work - Other means (%)
Working at home (%)
Industry diversity
Most Common Industries - Agriculture, forestry, fishing and hunting, and mining (%)
Most Common Industries - Agriculture, forestry, fishing and hunting (%)
Most Common Industries - Mining, quarrying, and oil and gas extraction (%)
Most Common Industries - Construction (%)
Most Common Industries - Manufacturing (%)
Most Common Industries - Wholesale trade (%)
Most Common Industries - Retail trade (%)
Most Common Industries - Transportation and warehousing, and utilities (%)
Most Common Industries - Transportation and warehousing (%)
Most Common Industries - Utilities (%)
Most Common Industries - Information (%)
Most Common Industries - Finance and insurance, and real estate and rental and leasing (%)
Most Common Industries - Finance and insurance (%)
Most Common Industries - Real estate and rental and leasing (%)
Most Common Industries - Professional, scientific, and management, and administrative and waste management services (%)
Most Common Industries - Professional, scientific, and technical services (%)
Most Common Industries - Management of companies and enterprises (%)
Most Common Industries - Administrative and support and waste management services (%)
Most Common Industries - Educational services, and health care and social assistance (%)
Most Common Industries - Educational services (%)
Most Common Industries - Health care and social assistance (%)
Most Common Industries - Arts, entertainment, and recreation, and accommodation and food services (%)
Most Common Industries - Arts, entertainment, and recreation (%)
Most Common Industries - Accommodation and food services (%)
Most Common Industries - Other services, except public administration (%)
Most Common Industries - Public administration (%)
Occupation diversity
Most Common Occupations - Management, business, science, and arts occupations (%)
Most Common Occupations - Management, business, and financial occupations (%)
Most Common Occupations - Management occupations (%)
Most Common Occupations - Business and financial operations occupations (%)
Most Common Occupations - Computer, engineering, and science occupations (%)
Most Common Occupations - Computer and mathematical occupations (%)
Most Common Occupations - Architecture and engineering occupations (%)
Most Common Occupations - Life, physical, and social science occupations (%)
Most Common Occupations - Education, legal, community service, arts, and media occupations (%)
Most Common Occupations - Community and social service occupations (%)
Most Common Occupations - Legal occupations (%)
Most Common Occupations - Education, training, and library occupations (%)
Most Common Occupations - Arts, design, entertainment, sports, and media occupations (%)
Most Common Occupations - Healthcare practitioners and technical occupations (%)
Most Common Occupations - Health diagnosing and treating practitioners and other technical occupations (%)
Most Common Occupations - Health technologists and technicians (%)
Most Common Occupations - Service occupations (%)
Most Common Occupations - Healthcare support occupations (%)
Most Common Occupations - Protective service occupations (%)
Most Common Occupations - Fire fighting and prevention, and other protective service workers including supervisors (%)
Most Common Occupations - Law enforcement workers including supervisors (%)
Most Common Occupations - Food preparation and serving related occupations (%)
Most Common Occupations - Building and grounds cleaning and maintenance occupations (%)
Most Common Occupations - Personal care and service occupations (%)
Most Common Occupations - Sales and office occupations (%)
Most Common Occupations - Sales and related occupations (%)
Most Common Occupations - Office and administrative support occupations (%)
Most Common Occupations - Natural resources, construction, and maintenance occupations (%)
Most Common Occupations - Farming, fishing, and forestry occupations (%)
Most Common Occupations - Construction and extraction occupations (%)
Most Common Occupations - Installation, maintenance, and repair occupations (%)
Most Common Occupations - Production, transportation, and material moving occupations (%)
Most Common Occupations - Production occupations (%)
Most Common Occupations - Transportation occupations (%)
Most Common Occupations - Material moving occupations (%)
People in Group quarters - Institutionalized population (%)
People in Group quarters - Correctional institutions (%)
People in Group quarters - Federal prisons and detention centers (%)
People in Group quarters - Halfway houses (%)
People in Group quarters - Local jails and other confinement facilities (including police lockups) (%)
People in Group quarters - Military disciplinary barracks (%)
People in Group quarters - State prisons (%)
People in Group quarters - Other types of correctional institutions (%)
People in Group quarters - Nursing homes (%)
People in Group quarters - Hospitals/wards, hospices, and schools for the handicapped (%)
People in Group quarters - Hospitals/wards and hospices for chronically ill (%)
People in Group quarters - Hospices or homes for chronically ill (%)
People in Group quarters - Military hospitals or wards for chronically ill (%)
People in Group quarters - Other hospitals or wards for chronically ill (%)
People in Group quarters - Hospitals or wards for drug/alcohol abuse (%)
People in Group quarters - Mental (Psychiatric) hospitals or wards (%)
People in Group quarters - Schools, hospitals, or wards for the mentally retarded (%)
People in Group quarters - Schools, hospitals, or wards for the physically handicapped (%)
People in Group quarters - Institutions for the deaf (%)
People in Group quarters - Institutions for the blind (%)
People in Group quarters - Orthopedic wards and institutions for the physically handicapped (%)
People in Group quarters - Wards in general hospitals for patients who have no usual home elsewhere (%)
People in Group quarters - Wards in military hospitals for patients who have no usual home elsewhere (%)
People in Group quarters - Juvenile institutions (%)
People in Group quarters - Long-term care (%)
People in Group quarters - Homes for abused, dependent, and neglected children (%)
People in Group quarters - Residential treatment centers for emotionally disturbed children (%)
People in Group quarters - Training schools for juvenile delinquents (%)
People in Group quarters - Short-term care, detention or diagnostic centers for delinquent children (%)
People in Group quarters - Type of juvenile institution unknown (%)
People in Group quarters - Noninstitutionalized population (%)
People in Group quarters - College dormitories (includes college quarters off campus) (%)
People in Group quarters - Military quarters (%)
People in Group quarters - On base (%)
People in Group quarters - Barracks, unaccompanied personnel housing (UPH), (Enlisted/Officer), ;and similar group living quarters for military personnel (%)
People in Group quarters - Transient quarters for temporary residents (%)
People in Group quarters - Military ships (%)
People in Group quarters - Group homes (%)
People in Group quarters - Homes or halfway houses for drug/alcohol abuse (%)
People in Group quarters - Homes for the mentally ill (%)
People in Group quarters - Homes for the mentally retarded (%)
People in Group quarters - Homes for the physically handicapped (%)
People in Group quarters - Other group homes (%)
People in Group quarters - Religious group quarters (%)
People in Group quarters - Dormitories (%)
People in Group quarters - Agriculture workers' dormitories on farms (%)
People in Group quarters - Job Corps and vocational training facilities (%)
People in Group quarters - Other workers' dormitories (%)
People in Group quarters - Crews of maritime vessels (%)
People in Group quarters - Other nonhousehold living situations (%)
People in Group quarters - Other noninstitutional group quarters (%)
Residents speaking English at home (%)
Residents speaking English at home - Born in the United States (%)
Residents speaking English at home - Native, born elsewhere (%)
Residents speaking English at home - Foreign born (%)
Residents speaking Spanish at home (%)
Residents speaking Spanish at home - Born in the United States (%)
Residents speaking Spanish at home - Native, born elsewhere (%)
Residents speaking Spanish at home - Foreign born (%)
Residents speaking other language at home (%)
Residents speaking other language at home - Born in the United States (%)
Residents speaking other language at home - Native, born elsewhere (%)
Residents speaking other language at home - Foreign born (%)
Class of Workers - Employee of private company (%)
Class of Workers - Self-employed in own incorporated business (%)
Class of Workers - Private not-for-profit wage and salary workers (%)
Class of Workers - Local government workers (%)
Class of Workers - State government workers (%)
Class of Workers - Federal government workers (%)
Class of Workers - Self-employed workers in own not incorporated business and Unpaid family workers (%)
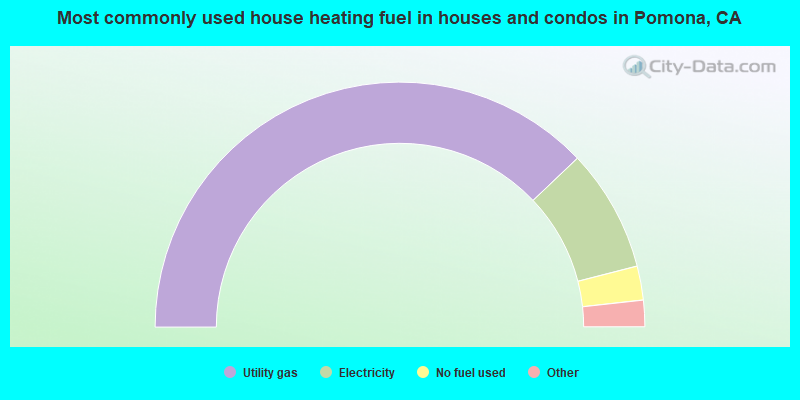
House heating fuel used in houses and condos - Utility gas (%)
House heating fuel used in houses and condos - Bottled, tank, or LP gas (%)
House heating fuel used in houses and condos - Electricity (%)
House heating fuel used in houses and condos - Fuel oil, kerosene, etc. (%)
House heating fuel used in houses and condos - Coal or coke (%)
House heating fuel used in houses and condos - Wood (%)
House heating fuel used in houses and condos - Solar energy (%)
House heating fuel used in houses and condos - Other fuel (%)
House heating fuel used in houses and condos - No fuel used (%)
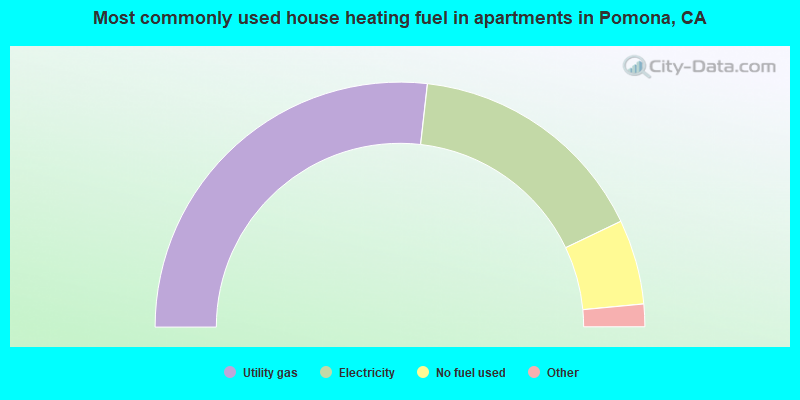
House heating fuel used in apartments - Utility gas (%)
House heating fuel used in apartments - Bottled, tank, or LP gas (%)
House heating fuel used in apartments - Electricity (%)
House heating fuel used in apartments - Fuel oil, kerosene, etc. (%)
House heating fuel used in apartments - Coal or coke (%)
House heating fuel used in apartments - Wood (%)
House heating fuel used in apartments - Solar energy (%)
House heating fuel used in apartments - Other fuel (%)
House heating fuel used in apartments - No fuel used (%)
Armed forces status - In Armed Forces (%)
Armed forces status - Civilian (%)
Armed forces status - Civilian - Veteran (%)
Armed forces status - Civilian - Nonveteran (%)
Fatal accidents locations in years 2005-2021
Fatal accidents locations in 2005
Fatal accidents locations in 2006
Fatal accidents locations in 2007
Fatal accidents locations in 2008
Fatal accidents locations in 2009
Fatal accidents locations in 2010
Fatal accidents locations in 2011
Fatal accidents locations in 2012
Fatal accidents locations in 2013
Fatal accidents locations in 2014
Fatal accidents locations in 2015
Fatal accidents locations in 2016
Fatal accidents locations in 2017
Fatal accidents locations in 2018
Fatal accidents locations in 2019
Fatal accidents locations in 2020
Fatal accidents locations in 2021
Alcohol use - People drinking some alcohol every month (%)
Alcohol use - People not drinking at all (%)
Alcohol use - Average days/month drinking alcohol
Alcohol use - Average drinks/week
Alcohol use - Average days/year people drink much
Audiometry - Average condition of hearing (%)
Audiometry - People that can hear a whisper from across a quiet room (%)
Audiometry - People that can hear normal voice from across a quiet room (%)
Audiometry - Ears ringing, roaring, buzzing (%)
Audiometry - Had a job exposure to loud noise (%)
Audiometry - Had off-work exposure to loud noise (%)
Blood Pressure & Cholesterol - Has high blood pressure (%)
Blood Pressure & Cholesterol - Checking blood pressure at home (%)
Blood Pressure & Cholesterol - Frequently checking blood cholesterol (%)
Blood Pressure & Cholesterol - Has high cholesterol level (%)
Consumer Behavior - Money monthly spent on food at supermarket/grocery store
Consumer Behavior - Money monthly spent on food at other stores
Consumer Behavior - Money monthly spent on eating out
Consumer Behavior - Money monthly spent on carryout/delivered foods
Consumer Behavior - Income spent on food at supermarket/grocery store (%)
Consumer Behavior - Income spent on food at other stores (%)
Consumer Behavior - Income spent on eating out (%)
Consumer Behavior - Income spent on carryout/delivered foods (%)
Current Health Status - General health condition (%)
Current Health Status - Blood donors (%)
Current Health Status - Has blood ever tested for HIV virus (%)
Current Health Status - Left-handed people (%)
Dermatology - People using sunscreen (%)
Diabetes - Diabetics (%)
Diabetes - Had a blood test for high blood sugar (%)
Diabetes - People taking insulin (%)
Diet Behavior & Nutrition - Diet health (%)
Diet Behavior & Nutrition - Milk product consumption (# of products/month)
Diet Behavior & Nutrition - Meals not home prepared (#/week)
Diet Behavior & Nutrition - Meals from fast food or pizza place (#/week)
Diet Behavior & Nutrition - Ready-to-eat foods (#/month)
Diet Behavior & Nutrition - Frozen meals/pizza (#/month)
Drug Use - People that ever used marijuana or hashish (%)
Drug Use - Ever used hard drugs (%)
Drug Use - Ever used any form of cocaine (%)
Drug Use - Ever used heroin (%)
Drug Use - Ever used methamphetamine (%)
Health Insurance - People covered by health insurance (%)
Kidney Conditions-Urology - Avg. # of times urinating at night
Medical Conditions - People with asthma (%)
Medical Conditions - People with anemia (%)
Medical Conditions - People with psoriasis (%)
Medical Conditions - People with overweight (%)
Medical Conditions - Elderly people having difficulties in thinking or remembering (%)
Medical Conditions - People who ever received blood transfusion (%)
Medical Conditions - People having trouble seeing even with glass/contacts (%)
Medical Conditions - People with arthritis (%)
Medical Conditions - People with gout (%)
Medical Conditions - People with congestive heart failure (%)
Medical Conditions - People with coronary heart disease (%)
Medical Conditions - People with angina pectoris (%)
Medical Conditions - People who ever had heart attack (%)
Medical Conditions - People who ever had stroke (%)
Medical Conditions - People with emphysema (%)
Medical Conditions - People with thyroid problem (%)
Medical Conditions - People with chronic bronchitis (%)
Medical Conditions - People with any liver condition (%)
Medical Conditions - People who ever had cancer or malignancy (%)
Mental Health - People who have little interest in doing things (%)
Mental Health - People feeling down, depressed, or hopeless (%)
Mental Health - People who have trouble sleeping or sleeping too much (%)
Mental Health - People feeling tired or having little energy (%)
Mental Health - People with poor appetite or overeating (%)
Mental Health - People feeling bad about themself (%)
Mental Health - People who have trouble concentrating on things (%)
Mental Health - People moving or speaking slowly or too fast (%)
Mental Health - People having thoughts they would be better off dead (%)
Oral Health - Average years since last visit a dentist
Oral Health - People embarrassed because of mouth (%)
Oral Health - People with gum disease (%)
Oral Health - General health of teeth and gums (%)
Oral Health - Average days a week using dental floss/device
Oral Health - Average days a week using mouthwash for dental problem
Oral Health - Average number of teeth
Pesticide Use - Households using pesticides to control insects (%)
Pesticide Use - Households using pesticides to kill weeds (%)
Physical Activity - People doing vigorous-intensity work activities (%)
Physical Activity - People doing moderate-intensity work activities (%)
Physical Activity - People walking or bicycling (%)
Physical Activity - People doing vigorous-intensity recreational activities (%)
Physical Activity - People doing moderate-intensity recreational activities (%)
Physical Activity - Average hours a day doing sedentary activities
Physical Activity - Average hours a day watching TV or videos
Physical Activity - Average hours a day using computer
Physical Functioning - People having limitations keeping them from working (%)
Physical Functioning - People limited in amount of work they can do (%)
Physical Functioning - People that need special equipment to walk (%)
Physical Functioning - People experiencing confusion/memory problems (%)
Physical Functioning - People requiring special healthcare equipment (%)
Prescription Medications - Average number of prescription medicines taking
Preventive Aspirin Use - Adults 40+ taking low-dose aspirin (%)
Reproductive Health - Vaginal deliveries (%)
Reproductive Health - Cesarean deliveries (%)
Reproductive Health - Deliveries resulted in a live birth (%)
Reproductive Health - Pregnancies resulted in a delivery (%)
Reproductive Health - Women breastfeeding newborns (%)
Reproductive Health - Women that had a hysterectomy (%)
Reproductive Health - Women that had both ovaries removed (%)
Reproductive Health - Women that have ever taken birth control pills (%)
Reproductive Health - Women taking birth control pills (%)
Reproductive Health - Women that have ever used Depo-Provera or injectables (%)
Reproductive Health - Women that have ever used female hormones (%)
Sexual Behavior - People 18+ that ever had sex (vaginal, anal, or oral) (%)
Sexual Behavior - Males 18+ that ever had vaginal sex with a woman (%)
Sexual Behavior - Males 18+ that ever performed oral sex on a woman (%)
Sexual Behavior - Males 18+ that ever had anal sex with a woman (%)
Sexual Behavior - Males 18+ that ever had any sex with a man (%)
Sexual Behavior - Females 18+ that ever had vaginal sex with a man (%)
Sexual Behavior - Females 18+ that ever performed oral sex on a man (%)
Sexual Behavior - Females 18+ that ever had anal sex with a man (%)
Sexual Behavior - Females 18+ that ever had any kind of sex with a woman (%)
Sexual Behavior - Average age people first had sex
Sexual Behavior - Average number of female sex partners in lifetime (males 18+)
Sexual Behavior - Average number of female vaginal sex partners in lifetime (males 18+)
Sexual Behavior - Average age people first performed oral sex on a woman (18+)
Sexual Behavior - Average number of woman performed oral sex on in lifetime (18+)
Sexual Behavior - Average number of male sex partners in lifetime (males 18+)
Sexual Behavior - Average number of male anal sex partners in lifetime (males 18+)
Sexual Behavior - Average age people first performed oral sex on a man (18+)
Sexual Behavior - Average number of male oral sex partners in lifetime (18+)
Sexual Behavior - People using protection when performing oral sex (%)
Sexual Behavior - Average number of times people have vaginal or anal sex a year
Sexual Behavior - People having sex without condom (%)
Sexual Behavior - Average number of male sex partners in lifetime (females 18+)
Sexual Behavior - Average number of male vaginal sex partners in lifetime (females 18+)
Sexual Behavior - Average number of female sex partners in lifetime (females 18+)
Sexual Behavior - Circumcised males 18+ (%)
Sleep Disorders - Average hours sleeping at night
Sleep Disorders - People that has trouble sleeping (%)
Smoking-Cigarette Use - People smoking cigarettes (%)
Taste & Smell - People 40+ having problems with smell (%)
Taste & Smell - People 40+ having problems with taste (%)
Taste & Smell - People 40+ that ever had wisdom teeth removed (%)
Taste & Smell - People 40+ that ever had tonsils teeth removed (%)
Taste & Smell - People 40+ that ever had a loss of consciousness because of a head injury (%)
Taste & Smell - People 40+ that ever had a broken nose or other serious injury to face or skull (%)
Taste & Smell - People 40+ that ever had two or more sinus infections (%)
Weight - Average height (inches)
Weight - Average weight (pounds)
Weight - Average BMI
Weight - People that are obese (%)
Weight - People that ever were obese (%)
Weight - People trying to lose weight (%)
111,318 76.2% Hispanic 16,343 11.2% Asian alone 9,412 6.4% White alone 4,140 2.8% Black alone 3,464 2.4% Two or more races 861 0.6% Other race alone 424 0.3% Native Hawaiian and Other 53 0.04% American Indian alone
According to our research of California and other state lists, there were 239 registered sex offenders living in Pomona, California as of April 27, 2024 . The ratio of all residents to sex offenders in Pomona is 638 to 1.The ratio of registered sex offenders to all residents in this city is near the state average.
The City-Data.com crime index weighs serious crimes and violent crimes more heavily. Higher means more crime, U.S. average is 246.1. It adjusts for the number of visitors and daily workers commuting into cities.
- means the value is smaller than the state average.
- means the value is about the same as the state average.
- means the value is bigger than the state average.
- means the value is much bigger than the state average.
Crime rate in Pomona detailed stats: murders, rapes, robberies, assaults, burglaries, thefts, arson Officers per 1,000 residents here:
0.98California average:
2.30
Latest news from Pomona, CA collected exclusively by city-data.com from local newspapers, TV, and radio stations
Ancestries: American (1.5%).
Current Local Time:
Land area: 22.8 square miles.
Population density: 6,393 people per square mile (high).
47,950 residents are foreign born (24.5% Latin America , 7.7% Asia ).
This city:
32.7%California:
26.5%
Median real estate property taxes paid for housing units with mortgages in 2022: $3,770 (0.6%)Median real estate property taxes paid for housing units with no mortgage in 2022: $2,761 (0.5%)
Nearest city with pop. 200,000+: East San Gabriel Valley, CA
Nearest city with pop. 1,000,000+: Los Angeles, CA
Nearest cities:
Latitude: 34.06 N, Longitude: 117.76 W
Daytime population change due to commuting: -6,711 (-4.6%)Workers who live and work in this city: 17,076 (25.2%)
Property values in Pomona, CA
Single-family new house construction building permits:
2022: 138 buildings , average cost: $118,6002021: 118 buildings , average cost: $118,7002020: 135 buildings , average cost: $175,2002019: 98 buildings , average cost: $148,5002018: 189 buildings , average cost: $199,8002017: 181 buildings , average cost: $183,2002016: 75 buildings , average cost: $194,5002015: 13 buildings , average cost: $235,2002014: 35 buildings , average cost: $209,1002013: 4 buildings , average cost: $194,4002012: 95 buildings , average cost: $203,0002011: 4 buildings , average cost: $115,2002010: 1 building , cost: $103,3002009: 5 buildings , average cost: $154,8002008: 29 buildings , average cost: $193,5002007: 183 buildings , average cost: $157,5002006: 153 buildings , average cost: $143,8002005: 170 buildings , average cost: $166,4002004: 246 buildings , average cost: $190,0002003: 93 buildings , average cost: $176,6002002: 85 buildings , average cost: $183,4002001: 78 buildings , average cost: $121,6002000: 30 buildings , average cost: $134,9001999: 9 buildings , average cost: $130,5001998: 15 buildings , average cost: $134,0001997: 58 buildings , average cost: $128,000Unemployment in December 2023:
Population change in the 1990s: +16,964 (+12.8%).
Most common occupations in Pomona, CA (%)
Both Males Females
Cooks and food preparation workers (7.5%)
Building and grounds cleaning and maintenance occupations (7.0%)
Material recording, scheduling, dispatching, and distributing workers (4.1%)
Laborers and material movers, hand (4.1%)
Cashiers (3.9%)
Other production occupations, including supervisors (3.4%)
Other management occupations, except farmers and farm managers (3.3%)
Cooks and food preparation workers (7.4%)
Building and grounds cleaning and maintenance occupations (7.2%)
Driver/sales workers and truck drivers (5.1%)
Laborers and material movers, hand (5.0%)
Material recording, scheduling, dispatching, and distributing workers (4.1%)
Other production occupations, including supervisors (4.0%)
Construction laborers (4.0%)
Cooks and food preparation workers (7.7%)
Cashiers (6.9%)
Building and grounds cleaning and maintenance occupations (6.6%)
Other office and administrative support workers, including supervisors (5.6%)
Secretaries and administrative assistants (4.2%)
Material recording, scheduling, dispatching, and distributing workers (4.0%)
Supervisors and other personal care and service workers, except child care workers (3.4%)
Earthquake activity:
Pomona-area historical earthquake activity is significantly above California state average. It is 7224% greater than the overall U.S. average. On 7/21/1952 at 11:52:14, a magnitude 7.7 (7.7 UK, Class: Major, Intensity: VIII - XII) earthquake occurred 96.2 miles away from the city center, causing $50,000,000 total damage On 6/28/1992 at 11:57:34, a magnitude 7.6 (6.2 MB, 7.6 MS, 7.3 MW, Depth: 0.7 mi) earthquake occurred 70.6 miles away from Pomona center, causing 3 deaths ( 1 shaking deaths, 2 other deaths) and 400 injuries, causing $100,000,000 total damage and $40,000,000 insured lossesOn 10/16/1999 at 09:46:44, a magnitude 7.4 (6.3 MB, 7.4 MS, 7.2 MW, 7.3 ML) earthquake occurred 81.8 miles away from Pomona center On 11/4/1927 at 13:51:53, a magnitude 7.5 (7.5 UK) earthquake occurred 195.8 miles away from the city center On 4/21/1918 at 22:32:30, a magnitude 6.8 (6.8 UK, Class: Strong, Intensity: VII - IX) earthquake occurred 25.0 miles away from the city center On 6/28/1992 at 15:05:30, a magnitude 6.9 (6.3 MB, 6.7 MS, 6.5 MW, 6.9 ME, Depth: 3.1 mi) earthquake occurred 56.0 miles away from the city center Magnitude types: body-wave magnitude (MB), energy magnitude (ME), local magnitude (ML), surface-wave magnitude (MS), moment magnitude (MW) Natural disasters: The number of natural disasters in Los Angeles County (57) is a lot greater than the US average (15).Major Disasters (Presidential) Declared: 27Emergencies Declared: 3Fires: 37, Floods: 16, Storms: 9, Winter Storms: 6, Landslides: 5, Mudslides: 5, Earthquakes: 3, Freeze: 1, Heavy Rain: 1, Hurricane: 1, Snow: 1, Tornado: 1, Wind: 1, Other: 1 (Note: some incidents may be assigned to more than one category). Main business address for: PFF BANCORP INC SAVINGS INSTITUTION, FEDERALLY CHARTERED ), KEYSTONE AUTOMOTIVE INDUSTRIES INC WHOLESALE-MOTOR VEHICLE SUPPLIES & NEW PARTS ).
Hospitals in Pomona: CPC HORIZON HOSPITAL (566 N GORDON ST) DAWNVIEW HOME (3114 DAWNVIEW AVENUE) DOUGLASS HOME (1408 DOUGLASS DRIVE) EMERALD VILLAGE (1762 STORRS PLACE) FLORINDA STREET HOME (3252 FLORINDA STREET) JADE RANCH (1171 MAPLE VIEW DRIVE) LANTERMAN DEVELOPMENTAL CENTER (Government - State, 3530 POMONA BOULEVARD) MARKWAY HOUSE (336 MARKWAY LANE) POMONA VALLEY HOSPITAL MEDICAL CENTER (Voluntary non-profit - Private, 1798 N GAREY AVE) PRIMARY RELIANCE - VICTORIA HOUSE (2145 VICTORIA WAY) SUNDANCE HOUSE (56 SUNDANCE DRIVE) Heliports located in Pomona: Amtrak station: POMONA (156 W. COMMERCIAL ST.)
.
Services: partially wheelchair accessible, public payphones, free short-term parking, free long-term parking, call for taxi service, public transit connection.
Colleges/Universities in Pomona: California State Polytechnic University-Pomona Full-time enrollment: 18,141; Location: 3801 West Temple Avenue; Public; Website: www.csupomona.edu; Offers Doctor's degree )
DeVry University-California Full-time enrollment: 10,875; Location: 901 Corporate Center Dr; Private, for-profit; Website: www.devry.edu; Offers Master's degree )
Western University of Health Sciences Full-time enrollment: 616; Location: 309 E 2nd St; Private, not-for-profit; Website: www.westernu.edu; Offers Doctor's degree )
Pomona Unified School District Adult and Career Education Full-time enrollment: 468; Location: 1515 W Mission Blvd; Public; Website: www.pusd.org/ace)
North-West College-Pomona Full-time enrollment: 454; Location: 170 W Holt Ave; Private, for-profit; Website: www.north-westcollege.edu)
Carrington College California-Pomona Full-time enrollment: 265; Location: 901 Corporate Center Drive, Ste. 300; Private, for-profit; Website: www.carrington.edu)
Thuy Princess Beauty College Full-time enrollment: 97; Location: 252 E Second St; Private, for-profit; Website: thuyprincessbeautycollege.com)
DeVry University's Keller Graduate School of Management-California Location: 901 Corporate Center Drive; Private, for-profit; Website: www.keller.edu; Offers Master's degree )
St Luke University Location: 1460 E. Holt Ave. Suite #72; Private, not-for-profit; Website: www.sluedu.us; Offers Doctor's degree )
DeVry University-California Location: 901 Corporate Center Dr; Private, for-profit; Website: www.devry.edu)
Other colleges/universities with over 2000 students near Pomona:
University of La Verne (about 3 miles; La Verne, CA ; Full-time enrollment: 6,983)
Mt San Antonio College (about 6 miles; Walnut, CA ; FT enrollment: 19,891)
Azusa Pacific University (about 9 miles; Azusa, CA ; FT enrollment: 9,427)
Citrus College (about 10 miles; Glendora, CA ; FT enrollment: 8,456)
Universal Technical Institute of California Inc (about 11 miles; Rancho Cucamonga, CA ; FT enrollment: 4,158)
Chaffey College (about 13 miles; Rancho Cucamonga, CA ; FT enrollment: 10,496)
Hacienda La Puente Adult Education (about 13 miles; La Puente, CA ; FT enrollment: 2,750)
Biggest public high schools in Pomona: DIAMOND RANCH HIGH Students: 1,258, Location: 100 DIAMOND RANCH DR., Grades: 9-12)GANESHA HIGH Students: 1,136, Location: 1151 FAIRPLEX DR., Grades: 9-12)VILLAGE ACADEMY HIGH SCHOOL AT INDIAN HILL Students: 392, Location: 1444 E. HOLT AVE., Grades: 9-12)INTERNATIONAL POLYTECHNIC HIGH Students: 356, Location: 3801 W. TEMPLE AVE., Grades: 9-12)SCHOOL OF ARTS AND ENTERPRISE Students: 246, Location: 295 N. GAREY AVE., Grades: 6-12, Charter school )POMONA ALTERNATIVE Students: 57, Location: 1460 E. HOLT AVE., STE. 100, Grades: 7-10)PARK WEST HIGH (CONTINUATION) Students: 57, Location: 1540 W. SECOND ST., Grades: 9-12)SCHOOL OF EXTENDED EDUCATIONAL OPTIONS Students: 28, Location: 1460 E. HOLT AVE., ST. 100, Grades: 7-12, Charter school )POMONA COMMUNITY DAY Students: 17, Location: 605 N. PARK AVE., Grades: 7-12)POMONA HIGH Location: 475 BANGOR ST., Grades: 9-12)
Private high schools in Pomona: POMONA CATHOLIC HIGH SCHOOL Students: 313, Location: 533 W HOLT AVE, Grades: 6-12)
CITY OF KNOWLEDGE SCHOOL Students: 196, Location: 3285 N GAREY AVE, Grades: PK-12)
YOUNG PEOPLE CORPORATION ACADEMY Students: 28, Location: 1750 WEST HOLT AVENUE, Grades: PK-12)
AMERICAN CHRISTIAN ACADEMY Students: 12, Location: 395 SAN BERNARDINO AVE, Grades: 3-12)
GRACE CHRISTIAN SCHOOL Students: 5, Location: 788 E GRAND AVE, Grades: 5-12)
Biggest public elementary/middle schools in Pomona: SIMONS MIDDLE Students: 810, Location: 900 E. FRANKLIN AVE., Grades: 6-8)PHILADELPHIA ELEMENTARY Students: 585, Location: 600 E. PHILADELPHIA ST., Grades: KG-6)ALCOTT ELEMENTARY Students: 566, Location: 1600 S. TOWNE AVE., Grades: KG-6)ROOSEVELT ELEMENTARY Students: 527, Location: 701 N. HNTNGTN BLVD., Grades: KG-5)VEJAR ELEMENTARY Students: 485, Location: 950 W. GRAND AVE., Grades: KG-8)CORTEZ ELEMENTARY Students: 455, Location: 1300 N. DUDLEY, Grades: KG-8)KINGSLEY ELEMENTARY Students: 432, Location: 1170 WASHINGTON ST., Grades: KG-5)DECKER ELEMENTARY Students: 427, Location: 20 VILLAGE LOOP RD., Grades: KG-6)WASHINGTON ELEMENTARY Students: 420, Location: 975 E. NINTH ST., Grades: KG-5)ARROYO ELEMENTARY Students: 416, Location: 1605 W. ARROYO AVE., Grades: KG-6)Private elementary/middle schools in Pomona: ST JOSEPH ELEMENTARY SCHOOL Students: 187, Location: 1200 W HOLT AVE, Grades: KG-8)
ST MADELEINE SCHOOL Students: 115, Location: 935 E KINGSLEY AVE, Grades: PK-5)
ICC COMMUNITY SCHOOL Students: 51, Location: 3619 N GAREY AVE, Grades: PK-5)
See full list of schools located in Pomona Library in Pomona: POMONA PUBLIC LIBRARY Operating income: $3,116,027; Location: 625 S. GAREY AVE.; 411,581 books ; 10,694 audio materials ; 293 video materials ; 8 local licensed databases ; 211 print serial subscriptions )
Notable locations in Pomona: (A) , Los Angeles County Fairgrounds (B) , Pomona (C) , Mountain Meadows Country Club (D) , Pomona Raceway (E) , Palm Lake Golf Course (F) , Kellogg Arabian Horse Farm (G) , Pomona County Building (H) , Pomona City Hall (I) , Eagles Hall (J) , Beth Israel Community Center (K) , Claremont City Hall (L) , Pomona Public Library (M) , Schaefer Ambulance Service (N) , Cole Schaefer Ambulance Service (O) , Los Angeles County Fire Department Station 188 (P) , Los Angeles County Fire Department Station 187 (Q) , Los Angeles County Fire Department Station 186 (R) , Los Angeles County Fire Department Station 185 (S) , Los Angeles County Fire Department Station 184 (T) . Display/hide their locations on the map
Shopping Centers: (1) , The Valley Center Shopping Center (2) , Indian Hill Marketplace Shopping Center (3) , Garey Shopping Center (4) , Foothill and Towne Shopping Center (5) . Display/hide their locations on the map
Main business address in Pomona include: (A) , KEYSTONE AUTOMOTIVE INDUSTRIES INC (B) . Display/hide their locations on the map
Churches in Pomona include: (A) , Church of Christ (B) , Church of God (C) , Church of the Open Bible (D) , First Baptist Church (E) , First Church of Christ Scientist (F) , First Presbyterian Church (G) , Mount Zion Baptist Church (H) , Pentecostal Church of God (I) . Display/hide their locations on the map
Cemeteries: (1) , Holy Cross Cemetery (2) , Palomares Cemetery (3) , Spadra Cemetery (4) . Display/hide their locations on the map
Streams, rivers, and creeks: (A) . Display/hide its location on the map
Parks in Pomona include: (1) , Ganesha Park (2) , Garfield Park (3) , Kellogg Park (4) , Lincoln Park (5) , Palomares Park (6) , Ted Green Field (7) , Washington Park (8) , Welch Park (9) . Display/hide their locations on the map
Tourist attraction: (1) . Display/hide its approximate location on the map
Hotel: (1) . Display/hide its approximate location on the map
Birthplace of: Shane Mosley - Boxer, Kaleena Mosqueda-Lewis - Basketball player, Tom Waits - (born 1949), singer, songwriter and pianist, Ronald Burkle - Supermarket billionaire, Rozz Williams - Singer, Mark McGwire - (born 1963), baseball player, Al Luginbill - Football coach, Ryan Perry - Baseball player, Jeff Bajenaru - 2005 Major League Baseball player (Chicago White Sox, born : Mar 21, 1978), Jimmy Verdon - 2005 NFL player (New Orleans Saints, born : Nov 4, 1981).
Los Angeles County has a predicted average indoor radon screening level between 2 and 4 pCi/L (pico curies per liter) - Moderate Potential Drinking water stations with addresses in Pomona and their reported violations in the past:
CALIF STATE POLYTECHNICAL UNIV - POMONA (Address: FACILITIES MANAGEMENT Population served: 24,350, Purch surface water):
Past health violations:
MCL, Average - Between APR-2011 and JUN-2011, Contaminant: TTHM. Follow-up actions: St AO (w/o penalty) issued (APR-28-2011)
Population served: 25, Groundwater):
Past monitoring violations:
4 routine major monitoring violations
Average household size: This city:
3.8 peopleCalifornia:
2.9 people
Percentage of family households: This city:
78.6%Whole state:
68.7%
Percentage of households with unmarried partners: This city:
8.1%Whole state:
7.2%
Likely homosexual households (counted as self-reported same-sex unmarried-partner households)
Lesbian couples: 0.5% of all households Gay men: 0.3% of all households
People in group quarters in Pomona in 2010:
1,901 people in college/university student housing
1,166 people in nursing facilities/skilled-nursing facilities
467 people in group homes intended for adults
166 people in other noninstitutional facilities
124 people in correctional residential facilities
118 people in residential treatment centers for adults
111 people in emergency and transitional shelters (with sleeping facilities) for people experiencing homelessness
29 people in group homes for juveniles (non-correctional)
19 people in workers' group living quarters and job corps centers
17 people in residential treatment centers for juveniles (non-correctional)
15 people in local jails and other municipal confinement facilities
5 people in correctional facilities intended for juveniles
People in group quarters in Pomona in 2000:
2,290 people in college dormitories (includes college quarters off campus)
788 people in nursing homes
559 people in schools, hospitals, or wards for the intellectually disabled
255 people in mental (psychiatric) hospitals or wards
230 people in homes or halfway houses for drug/alcohol abuse
213 people in hospitals/wards and hospices for chronically ill
213 people in other hospitals or wards for chronically ill
186 people in other noninstitutional group quarters
185 people in homes for the mentally retarded
95 people in homes for the mentally ill
56 people in job corps and vocational training facilities
50 people in other nonhousehold living situations
48 people in orthopedic wards and institutions for the physically handicapped
20 people in other group homes
18 people in local jails and other confinement facilities (including police lockups)
14 people in training schools for juvenile delinquents
14 people in homes for the physically handicapped
11 people in homes for abused, dependent, and neglected children
9 people in religious group quarters
Banks with branches in Pomona (2011 data):
Bank of America, National Association: Pomona Main Branch at 444 South Garey Avenue, branch established on 1927/02/19; Phillips Branch at 58 Rio Rancho Road, branch established on 2007/09/28. Info updated 2009/11/18: Bank assets: $1,451,969.3 mil, Deposits: $1,077,176.8 mil, headquarters in Charlotte, NC, positive income , 5782 total offices , Holding Company: Bank Of America Corporation
U.S. Bank National Association: Pomona - Indian Hill Branch at 550 Indian Hill Blvd, branch established on 1892/01/01; Mission & Garey Branch at 101 West Mission Avenue, Suite 105, branch established on 1892/01/01. Info updated 2012/01/30: Bank assets: $330,470.8 mil, Deposits: $236,091.5 mil, headquarters in Cincinnati, OH, positive income , 3121 total offices , Holding Company: U.S. Bancorp
Citizens Business Bank: Pomona Branch at 1095 North Garey Avenue, branch established on 1958/02/21. Info updated 2011/03/30: Bank assets: $6,475.4 mil, Deposits: $4,625.6 mil, headquarters in Ontario, CA, positive income , Commercial Lending Specialization, 46 total offices , Holding Company: Cvb Financial Corp.
Wells Fargo Bank, National Association: Pomona Branch at 321 East Holt Avenue, branch established on 1953/12/07. Info updated 2011/04/05: Bank assets: $1,161,490.0 mil, Deposits: $905,653.0 mil, headquarters in Sioux Falls, SD, positive income , 6395 total offices , Holding Company: Wells Fargo & Company
JPMorgan Chase Bank, National Association: Pomona Branch at 100 West Second Street, branch established on 1889/01/01. Info updated 2011/11/10: Bank assets: $1,811,678.0 mil, Deposits: $1,190,738.0 mil, headquarters in Columbus, OH, positive income , International Specialization, 5577 total offices , Holding Company: Jpmorgan Chase & Co.
For population 15 years and over in Pomona:
Never married: 41.5%Now married: 44.1%Separated: 2.0%Widowed: 3.6%Divorced: 8.7% For population 25 years and over in Pomona:
High school or higher: 71.9%Bachelor's degree or higher: 19.4%Graduate or professional degree: 5.6%Unemployed: 9.9%Mean travel time to work (commute): 28.5 minutes
Education Gini index (Inequality in education) Here:
18.6California average:
15.5
Religion statistics for Pomona, CA (based on Los Angeles County data)
Religion Adherents Congregations Catholic 3,542,994 275 Evangelical Protestant 814,611 3,249 Other 451,594 1,023 Mainline Protestant 229,056 860 Black Protestant 112,338 290 Orthodox 63,517 76 None 4,604,495 -
Source: Clifford Grammich, Kirk Hadaway, Richard Houseal, Dale E.Jones, Alexei Krindatch, Richie Stanley and Richard H.Taylor. 2012. 2010 U.S.Religion Census: Religious Congregations & Membership Study. Association of Statisticians of American Religious Bodies. Jones, Dale E., et al. 2002. Congregations and Membership in the United States 2000. Nashville, TN: Glenmary Research Center. Graphs represent county-level data
Food Environment Statistics: Number of grocery stores : 2,084Los Angeles County :
2.12 / 10,000 pop.California :
2.14 / 10,000 pop.
Number of supercenters and club stores : 32This county :
0.03 / 10,000 pop.California :
0.04 / 10,000 pop.
Number of convenience stores (no gas) : 567Los Angeles County :
0.58 / 10,000 pop.State :
0.62 / 10,000 pop.
Number of convenience stores (with gas) : 1,206Los Angeles County :
1.23 / 10,000 pop.California :
1.49 / 10,000 pop.
Number of full-service restaurants : 7,008Los Angeles County :
7.15 / 10,000 pop.California :
7.42 / 10,000 pop.
Adult diabetes rate : This county :
7.5%State :
7.3%
Low-income preschool obesity rate : This county :
18.6%California :
17.9%
Health and Nutrition:
Average overall health of teeth and gums : Pomona:
46.7%California:
48.0%
Average BMI : Pomona:
28.2California:
28.1
People feeling badly about themselves : This city:
21.6%State:
20.2%
People not drinking alcohol at all : This city:
10.5%California:
11.2%
Average hours sleeping at night : Overweight people : Pomona:
30.3%California:
31.5%
General health condition : Average condition of hearing : This city:
82.4%California:
80.9%
More about Health and Nutrition of Pomona, CA Residents
Local government employment and payroll (March 2022)
Function
Full-time employees
Monthly full-time payroll
Average yearly full-time wage
Part-time employees
Monthly part-time payroll
Police Protection - Officers
172 $2,323,193 $162,083 0 $0 Police - Other
65 $420,300 $77,594 26 $55,466 Water Supply
59 $446,347 $90,782 3 $6,253 Streets and Highways
48 $345,929 $86,482 3 $6,780 Financial Administration
37 $258,383 $83,800 1 $1,130 Other Government Administration
33 $285,136 $103,686 14 $22,739 Solid Waste Management
22 $111,678 $60,915 14 $26,638 Housing and Community Development (Local)
19 $144,768 $91,432 1 $1,453 Welfare
14 $92,061 $78,909 1 $1,479 Other and Unallocable
9 $55,043 $73,391 0 $0 Parks and Recreation
6 $47,886 $95,772 38 $51,945 Sewerage
6 $36,310 $72,620 0 $0 Local Libraries
1 $6,295 $75,540 17 $21,503
Totals for Government
491 $4,573,328 $111,772 118 $195,385
Pomona government finances - Expenditure in 2021 (per resident):
Construction - Regular Highways: $12,590,000 ($86.22)
Police Protection: $342,000 ($2.34)Housing and Community Development: $36,000 ($0.25)General - Other: $17,000 ($0.12)Current Operations - Police Protection: $195,901,000 ($1341.63)
General - Other: $55,071,000 ($377.15)Local Fire Protection: $30,652,000 ($209.92)Water Utilities: $27,715,000 ($189.81)Housing and Community Development: $25,848,000 ($177.02)Regular Highways: $11,932,000 ($81.72)Central Staff Services: $10,894,000 ($74.61)Solid Waste Management: $10,883,000 ($74.53)Natural Resources - Other: $9,999,000 ($68.48)Parks and Recreation: $3,384,000 ($23.18)Transit Utilities: $2,259,000 ($15.47)Protective Inspection and Regulation - Other: $2,196,000 ($15.04)Sewerage: $2,002,000 ($13.71)Health - Other: $1,603,000 ($10.98)Libraries: $794,000 ($5.44)General - Interest on Debt: $17,213,000 ($117.88)
Water Utilities - Interest on Debt: $3,017,000 ($20.66)
Pomona government finances - Revenue in 2021 (per resident):
Charges - Housing and Community Development: $20,944,000 ($143.44)
Solid Waste Management: $12,183,000 ($83.44)Natural Resources - Other: $10,578,000 ($72.44)Other: $9,298,000 ($63.68)Sewerage: $6,611,000 ($45.28)Parks and Recreation: $260,000 ($1.78)Federal Intergovernmental - Other: $6,139,000 ($42.04)
Housing and Community Development: $23,000 ($0.16)Miscellaneous - General Revenue - Other: $6,228,000 ($42.65)
Donations From Private Sources: $4,112,000 ($28.16)Fines and Forfeits: $2,095,000 ($14.35)Interest Earnings: $1,053,000 ($7.21)Rents: $388,000 ($2.66)Special Assessments: $302,000 ($2.07)Sale of Property: $22,000 ($0.15)Revenue - Water Utilities: $37,775,000 ($258.70)
Transit Utilities: $5,680,000 ($38.90)State Intergovernmental - Other: $13,485,000 ($92.35)
Highways: $6,188,000 ($42.38)General Local Government Support: $88,000 ($0.60)Tax - Property: $43,599,000 ($298.59)
General Sales and Gross Receipts: $22,786,000 ($156.05)Public Utilities Sales: $21,812,000 ($149.38)Other: $17,978,000 ($123.12)Occupation and Business License - Other: $4,514,000 ($30.91)Other License: $2,521,000 ($17.27)Other Selective Sales: $2,182,000 ($14.94)Documentary and Stock Transfer: $2,060,000 ($14.11)
Pomona government finances - Debt in 2021 (per resident):
Long Term Debt - Outstanding Unspecified Public Purpose: $489,071,000 ($3349.41)
Beginning Outstanding - Unspecified Public Purpose: $286,643,000 ($1963.08)Issue, Unspecified Public Purpose: $219,890,000 ($1505.92)Retired Unspecified Public Purpose: $17,462,000 ($119.59)
Pomona government finances - Cash and Securities in 2021 (per resident):
Bond Funds - Cash and Securities: $189,445,000 ($1297.42)
Other Funds - Cash and Securities: $130,834,000 ($896.02)
Sinking Funds - Cash and Securities: $35,508,000 ($243.18)
2.98% of this county's 2021 resident taxpayers lived in other counties in 2020 ($81,235 average adjusted gross income )
Here:
2.98%California average:
5.19%
0.01% of residents moved from foreign countries ($155 average AGI )Los Angeles County:
0.01%California average:
0.03%
Top counties from which taxpayers relocated into this county between 2020 and 2021:
4.68% of this county's 2020 resident taxpayers moved to other counties in 2021 ($97,324 average adjusted gross income )
Here:
4.68%California average:
6.14%
0.01% of residents moved to foreign countries ($196 average AGI )Los Angeles County:
0.01%California average:
0.02%
Top counties to which taxpayers relocated from this county between 2020 and 2021:
Businesses in Pomona, CA
Name Count Name Count
7-Eleven 10 McDonald's 5 99 Cents Only Stores 2 Motel 6 1 AT&T 1 Nike 1 Arby's 1 OfficeMax 1 AutoZone 3 Panda Express 1 Burger King 4 Payless 1 CVS 3 Penske 1 Carl\s Jr. 4 Pizza Hut 2 Church's Chicken 2 Popeyes 1 Circle K 2 Quiznos 1 Curves 1 RadioShack 2 DHL 3 Rite Aid 2 Dennys 3 Ryder Rental & Truck Leasing 1 Domino's Pizza 1 Sheraton 1 El Pollo Loco 2 Staples 1 FedEx 13 Starbucks 5 GNC 2 Subway 9 GameStop 1 T-Mobile 3 Goodwill 1 Taco Bell 2 H&R Block 5 U-Haul 3 Home Depot 1 UPS 7 Jack In The Box 7 Walgreens 2 KFC 2 Walmart 1 Kroger 1 Wendy's 1 Little Caesars Pizza 2 YMCA 3 MasterBrand Cabinets 1
Strongest AM radio stations in Pomona:
KMNY (1600 AM; 5 kW; POMONA, CA; Owner: MULTICULTURAL RADIO BROADCASTING, INC.)
KLAC (570 AM; 50 kW; LOS ANGELES, CA; Owner: AMFM RADIO LICENSES, L.L.C.)
KPLS (830 AM; 50 kW; ORANGE, CA; Owner: CRN LICENSES, LLC)
KTNQ (1020 AM; 50 kW; LOS ANGELES, CA; Owner: KTNQ-AM LICENSE CORP.)
KXTA (1150 AM; 50 kW; LOS ANGELES, CA; Owner: CITICASTERS LICENSES, L.P.)
KDIS (1110 AM; 50 kW; PASADENA, CA; Owner: ABC,INC.)
KFI (640 AM; 50 kW; LOS ANGELES, CA; Owner: CAPSTAR TX LIMITED PARTNERSHIP)
KSPA (1510 AM; 10 kW; ONTARIO, CA; Owner: ONTARIO BROADCASTING, LLC)
KFWB (980 AM; 50 kW; LOS ANGELES, CA; Owner: INFINITY BROADCASTING OPERATIONS, INC.)
KALI (900 AM; 6 kW; WEST COVINA, CA; Owner: MULTICULTURAL RADIO BROADCASTING, INC.)
KMPC (1540 AM; 50 kW; LOS ANGELES, CA; Owner: ROSE CITY RADIO CORPORATION)
KSPN (710 AM; 50 kW; LOS ANGELES, CA; Owner: KABC-AM RADIO, INC.)
KBLA (1580 AM; 50 kW; SANTA MONICA, CA)
Strongest FM radio stations in Pomona:
K264AF (100.7 FM; GUASTI, CA; Owner: EDUCATIONAL MEDIA FOUNDATION)
KRCV (98.3 FM; WEST COVINA, CA; Owner: HBC LICENSE CORPORATION)
KCBS-FM (93.1 FM; LOS ANGELES, CA; Owner: INFINITY BROADCASTING OPERATIONS, INC.)
KSCA (101.9 FM; GLENDALE, CA; Owner: HBC LICENSE CORPORATION)
KLOS (95.5 FM; LOS ANGELES, CA; Owner: KLOS-FM RADIO, INC.)
KOST (103.5 FM; LOS ANGELES, CA; Owner: CAPSTAR TX LIMITED PARTNERSHIP)
K212FA (90.3 FM; TEMPLE CITY, CA; Owner: EDUCATIONAL MEDIA FOUNDATION)
KIIS-FM (102.7 FM; LOS ANGELES, CA; Owner: CITICASTERS LICENSES, L.P.)
KLVE (107.5 FM; LOS ANGELES, CA; Owner: KLVE-FM LICENSE CORP.)
KPCC (89.3 FM; PASADENA, CA; Owner: PASADENA AREA COMMUNITY COLLEGE DISTRICT)
KHHT (92.3 FM; LOS ANGELES, CA; Owner: AMFM RADIO LICENSES, L.L.C.)
KBIG-FM (104.3 FM; LOS ANGELES, CA; Owner: AMFM RADIO LICENSES, L.L.C.)
KTWV (94.7 FM; LOS ANGELES, CA; Owner: INFINITY BROADCASTING OPERATIONS, INC.)
KMZT-FM (105.1 FM; LOS ANGELES, CA; Owner: MOUNT WILSON FM BROADCASTERS, INC.)
KPFK (90.7 FM; LOS ANGELES, CA; Owner: PACIFICA FOUNDATION, INC)
K216EM (91.1 FM; ARCADIA, CA; Owner: LIFE ON THE WAY COMMUNICATIONS, INC.)
KZLA-FM (93.9 FM; LOS ANGELES, CA; Owner: EMMIS RADIO LICENSE CORPORATION)
KPWR (105.9 FM; LOS ANGELES, CA; Owner: EMMIS RADIO LICENSE CORPORATION)
KLSX (97.1 FM; LOS ANGELES, CA; Owner: INFINITY BROADCASTING OPERATIONS, INC.)
KSAK (90.1 FM; WALNUT, CA; Owner: MT. SAN ANTONIO COMM. COLLEGE DIST.)
TV broadcast stations around Pomona:
KTRO-LP (Channel 50; LANCASTER, CA; Owner: ROBERT D. ADELMAN)
KCBS-TV (Channel 2; LOS ANGELES, CA; Owner: CBS BROADCASTING INC.)
KHIZ (Channel 64; BARSTOW, CA; Owner: SUNBELT TELEVISION, INC.)
KTLA-TV (Channel 5; LOS ANGELES, CA; Owner: KTLA INC.)
KRCA (Channel 62; RIVERSIDE, CA; Owner: KRCA LICENSE CORP.)
KABC-TV (Channel 7; LOS ANGELES, CA; Owner: ABC HOLDING COMPANY, INC.)
KCAL-TV (Channel 9; LOS ANGELES, CA; Owner: VIACOM TELEVISION STATIONS GROUP OF LOS ANGELES LLC)
KNBC (Channel 4; LOS ANGELES, CA; Owner: NBC SUBSIDIARY (KNBC-TV), INC.)
KPXN (Channel 30; SAN BERNARDINO, CA; Owner: PAXSON LOS ANGELES LICENSE, INC.)
KMEX-TV (Channel 34; LOS ANGELES, CA; Owner: KMEX LICENSE PARTNERSHIP, G.P.)
KAZA-TV (Channel 54; AVALON, CA; Owner: PAPPAS SOUTHERN CALIFORNIA LICENSE LLC)
KDOC-TV (Channel 56; ANAHEIM, CA; Owner: GOLDEN ORANGE BROADCASTING CO., INC.)
KOCE-TV (Channel 50; HUNTINGTON BEACH, CA; Owner: BD. OF TRUSTEES, COAST COMMUNITY COLLEGE DIST.)
KSCI (Channel 18; LONG BEACH, CA; Owner: KSLS, INC.)
KXLA (Channel 44; RANCHO PALOS VERDES, CA; Owner: RANCHO PALOS VERDES BROADCASTERS, INC.)
KCET (Channel 28; LOS ANGELES, CA; Owner: COMMUNITY TELEVISION OF SOUTHERN CALIFORNIA)
KFTR (Channel 46; ONTARIO, CA; Owner: TELEFUTURA LOS ANGELES LLC)
KTTV (Channel 11; LOS ANGELES, CA; Owner: FOX TELEVISION STATIONS, INC.)
KWHY-TV (Channel 22; LOS ANGELES, CA; Owner: TELEMUNDO OF LOS ANGELES LICENSE CORPORATION)
KVEA (Channel 52; CORONA, CA; Owner: ESTRELLA LICENSE CORPORATION)
National Bridge Inventory (NBI) Statistics 191 Number of bridges2,726ft / 831m Total length12,783,866 Total average daily traffic890,854 Total average daily truck traffic
New bridges - historical statistics
1 1920-1929 3 1930-1939 1 1940-1949 25 1950-1959 31 1960-1969 79 1970-1979 7 1980-1989 34 1990-1999 8 2000-2009 2 2010-2019
See full National Bridge Inventory statistics for Pomona, CA
Home Mortgage Disclosure Act Aggregated Statistics For Year 2009(Based on 25 full and 1 partial tracts) A) FHA, FSA/RHS & VA B) Conventional C) Refinancings D) Home Improvement Loans E) Loans on Dwellings For 5+ Families F) Non-occupant Loans on G) Loans On Manufactured Number Average Value Number Average Value Number Average Value Number Average Value Number Average Value Number Average Value Number Average Value
LOANS ORIGINATED 545 $209,969 384 $194,974 788 $218,390 60 $134,926 11 $5,143,545 150 $164,564 5 $86,364 APPLICATIONS APPROVED, NOT ACCEPTED 64 $204,164 63 $190,340 152 $228,940 22 $63,062 0 $0 34 $187,745 5 $53,740 APPLICATIONS DENIED 116 $216,744 146 $178,316 596 $237,300 67 $98,929 2 $562,500 98 $178,802 14 $99,594 APPLICATIONS WITHDRAWN 91 $208,847 89 $196,172 248 $227,228 24 $99,788 1 $265,000 54 $177,742 2 $70,500 FILES CLOSED FOR INCOMPLETENESS 51 $188,215 18 $162,941 82 $240,809 6 $106,745 1 $435,000 11 $202,002 1 $59,920
Aggregated Statistics For Year 2008(Based on 24 full and 1 partial tracts) A) FHA, FSA/RHS & VA B) Conventional C) Refinancings D) Home Improvement Loans E) Loans on Dwellings For 5+ Families F) Non-occupant Loans on G) Loans On Manufactured Number Average Value Number Average Value Number Average Value Number Average Value Number Average Value Number Average Value Number Average Value
LOANS ORIGINATED 272 $246,736 532 $221,757 924 $232,749 138 $88,474 10 $811,900 197 $205,485 21 $60,542 APPLICATIONS APPROVED, NOT ACCEPTED 29 $250,390 149 $235,499 355 $255,836 59 $107,986 0 $0 68 $235,321 28 $72,252 APPLICATIONS DENIED 80 $263,932 276 $248,586 1,306 $290,152 201 $97,763 6 $671,833 166 $244,786 41 $78,053 APPLICATIONS WITHDRAWN 55 $243,751 144 $211,204 364 $262,105 52 $149,631 2 $865,000 49 $213,830 1 $62,400 FILES CLOSED FOR INCOMPLETENESS 13 $311,932 38 $244,437 143 $273,044 9 $189,814 0 $0 25 $261,985 0 $0
Aggregated Statistics For Year 2007(Based on 25 full and 2 partial tracts) A) FHA, FSA/RHS & VA B) Conventional C) Refinancings D) Home Improvement Loans E) Loans on Dwellings For 5+ Families F) Non-occupant Loans on G) Loans On Manufactured Number Average Value Number Average Value Number Average Value Number Average Value Number Average Value Number Average Value Number Average Value
LOANS ORIGINATED 14 $311,251 1,093 $271,917 2,886 $278,159 404 $191,991 20 $1,383,654 382 $291,240 24 $63,550 APPLICATIONS APPROVED, NOT ACCEPTED 0 $0 383 $257,936 848 $287,064 115 $184,401 1 $576,000 98 $299,724 34 $70,903 APPLICATIONS DENIED 4 $250,500 724 $294,282 2,490 $305,451 374 $168,425 5 $943,200 265 $319,679 40 $76,918 APPLICATIONS WITHDRAWN 6 $284,500 235 $278,576 1,074 $305,332 130 $212,265 5 $1,311,480 108 $295,121 4 $1,991,500 FILES CLOSED FOR INCOMPLETENESS 2 $310,000 89 $330,911 380 $319,377 26 $225,140 0 $0 25 $313,240 2 $131,500
Aggregated Statistics For Year 2006(Based on 24 full and 2 partial tracts) A) FHA, FSA/RHS & VA B) Conventional C) Refinancings D) Home Improvement Loans E) Loans on Dwellings For 5+ Families F) Non-occupant Loans on G) Loans On Manufactured Number Average Value Number Average Value Number Average Value Number Average Value Number Average Value Number Average Value Number Average Value
LOANS ORIGINATED 14 $296,509 2,760 $241,699 4,628 $273,898 664 $188,371 50 $1,268,626 618 $275,161 29 $77,701 APPLICATIONS APPROVED, NOT ACCEPTED 2 $240,500 572 $237,400 1,124 $275,364 125 $195,864 0 $0 150 $243,819 24 $69,623 APPLICATIONS DENIED 0 $0 1,317 $252,086 2,465 $286,959 468 $169,290 4 $1,182,250 288 $271,085 30 $81,818 APPLICATIONS WITHDRAWN 1 $344,000 658 $244,160 1,740 $294,241 190 $201,396 2 $473,500 172 $267,802 3 $147,613 FILES CLOSED FOR INCOMPLETENESS 0 $0 153 $282,482 429 $283,122 35 $199,044 0 $0 40 $287,900 0 $0
Aggregated Statistics For Year 2005(Based on 25 full and 2 partial tracts) A) FHA, FSA/RHS & VA B) Conventional C) Refinancings D) Home Improvement Loans E) Loans on Dwellings For 5+ Families F) Non-occupant Loans on G) Loans On Manufactured Number Average Value Number Average Value Number Average Value Number Average Value Number Average Value Number Average Value Number Average Value
LOANS ORIGINATED 21 $274,868 3,119 $220,164 5,592 $242,604 704 $183,172 46 $1,219,739 719 $243,926 31 $114,504 APPLICATIONS APPROVED, NOT ACCEPTED 3 $320,333 678 $208,895 1,070 $233,320 131 $148,675 1 $312,000 157 $228,647 45 $73,298 APPLICATIONS DENIED 6 $255,813 1,130 $215,154 2,523 $249,727 467 $147,741 11 $707,000 263 $253,072 63 $83,327 APPLICATIONS WITHDRAWN 7 $238,714 717 $218,202 1,975 $245,477 255 $161,624 6 $352,667 191 $233,159 14 $132,941 FILES CLOSED FOR INCOMPLETENESS 2 $269,000 144 $232,003 642 $241,063 44 $155,481 2 $525,500 36 $258,009 1 $86,000
Aggregated Statistics For Year 2004(Based on 25 full and 2 partial tracts) A) FHA, FSA/RHS & VA B) Conventional C) Refinancings D) Home Improvement Loans E) Loans on Dwellings For 5+ Families F) Non-occupant Loans on G) Loans On Manufactured Number Average Value Number Average Value Number Average Value Number Average Value Number Average Value Number Average Value Number Average Value
LOANS ORIGINATED 104 $237,868 3,061 $181,550 6,069 $194,841 608 $141,728 58 $3,299,310 739 $184,503 23 $61,808 APPLICATIONS APPROVED, NOT ACCEPTED 4 $199,750 637 $190,084 1,277 $189,799 135 $123,140 1 $200,000 143 $182,375 11 $52,890 APPLICATIONS DENIED 20 $234,655 832 $182,327 2,614 $198,065 500 $106,238 6 $426,000 234 $180,877 26 $63,195 APPLICATIONS WITHDRAWN 19 $247,138 493 $187,734 2,044 $191,120 184 $119,990 6 $343,833 150 $190,945 5 $107,200 FILES CLOSED FOR INCOMPLETENESS 5 $225,200 114 $190,179 426 $195,807 47 $95,317 0 $0 30 $176,221 2 $123,000
Aggregated Statistics For Year 2003(Based on 25 full and 2 partial tracts) A) FHA, FSA/RHS & VA B) Conventional C) Refinancings D) Home Improvement Loans E) Loans on Dwellings For 5+ Families F) Non-occupant Loans on Number Average Value Number Average Value Number Average Value Number Average Value Number Average Value Number Average Value
LOANS ORIGINATED 404 $187,036 2,302 $152,534 7,636 $154,627 209 $54,473 56 $794,353 683 $143,654 APPLICATIONS APPROVED, NOT ACCEPTED 28 $182,850 442 $156,664 1,278 $152,368 58 $57,743 0 $0 170 $144,164 APPLICATIONS DENIED 53 $186,298 620 $143,060 2,350 $152,560 256 $40,258 7 $572,714 230 $148,823 APPLICATIONS WITHDRAWN 70 $190,065 360 $153,448 2,141 $154,603 66 $51,965 1 $999,000 117 $137,350 FILES CLOSED FOR INCOMPLETENESS 21 $183,658 103 $167,177 392 $155,840 16 $47,125 0 $0 36 $137,083
Aggregated Statistics For Year 2002(Based on 16 full and 2 partial tracts) A) FHA, FSA/RHS & VA B) Conventional C) Refinancings D) Home Improvement Loans E) Loans on Dwellings For 5+ Families F) Non-occupant Loans on Number Average Value Number Average Value Number Average Value Number Average Value Number Average Value Number Average Value
LOANS ORIGINATED 461 $155,494 1,046 $127,781 2,708 $129,428 122 $27,012 26 $575,731 293 $119,151 APPLICATIONS APPROVED, NOT ACCEPTED 52 $145,550 195 $134,815 528 $133,089 33 $29,202 1 $1,510,000 62 $135,380 APPLICATIONS DENIED 71 $155,903 335 $114,481 1,169 $127,182 198 $22,612 4 $974,000 115 $127,045 APPLICATIONS WITHDRAWN 84 $160,488 186 $126,540 774 $135,045 60 $33,131 2 $160,500 60 $123,733 FILES CLOSED FOR INCOMPLETENESS 27 $150,214 64 $138,917 451 $138,607 3 $21,000 0 $0 26 $137,149
Aggregated Statistics For Year 2001(Based on 16 full and 2 partial tracts) A) FHA, FSA/RHS & VA B) Conventional C) Refinancings D) Home Improvement Loans E) Loans on Dwellings For 5+ Families F) Non-occupant Loans on Number Average Value Number Average Value Number Average Value Number Average Value Number Average Value Number Average Value
LOANS ORIGINATED 631 $137,593 711 $110,519 1,848 $121,440 118 $21,442 23 $714,387 274 $114,898 APPLICATIONS APPROVED, NOT ACCEPTED 31 $128,968 130 $106,574 339 $111,291 29 $22,630 0 $0 39 $105,195 APPLICATIONS DENIED 101 $138,862 244 $98,643 1,101 $110,676 245 $19,625 1 $855,000 84 $111,039 APPLICATIONS WITHDRAWN 123 $129,322 146 $115,102 713 $122,008 107 $29,015 4 $662,250 46 $121,370 FILES CLOSED FOR INCOMPLETENESS 20 $132,562 38 $113,624 183 $123,423 9 $27,390 1 $450,000 17 $111,412
Aggregated Statistics For Year 2000(Based on 16 full and 1 partial tracts) A) FHA, FSA/RHS & VA B) Conventional C) Refinancings D) Home Improvement Loans E) Loans on Dwellings For 5+ Families F) Non-occupant Loans on Number Average Value Number Average Value Number Average Value Number Average Value Number Average Value Number Average Value
LOANS ORIGINATED 720 $124,956 597 $100,770 484 $95,806 99 $27,090 14 $394,643 134 $97,346 APPLICATIONS APPROVED, NOT ACCEPTED 48 $120,139 102 $81,567 124 $94,825 78 $25,221 0 $0 22 $81,182 APPLICATIONS DENIED 111 $126,964 306 $81,221 642 $90,572 191 $22,384 8 $216,250 54 $81,453 APPLICATIONS WITHDRAWN 108 $129,643 128 $94,836 307 $96,164 19 $27,793 1 $182,000 28 $107,728 FILES CLOSED FOR INCOMPLETENESS 39 $125,436 44 $92,225 154 $118,035 1 $25,000 2 $655,000 12 $120,240
Aggregated Statistics For Year 1999(Based on 17 full and 5 partial tracts) A) FHA, FSA/RHS & VA B) Conventional C) Refinancings D) Home Improvement Loans E) Loans on Dwellings For 5+ Families F) Non-occupant Loans on Number Average Value Number Average Value Number Average Value Number Average Value Number Average Value Number Average Value
LOANS ORIGINATED 991 $116,879 856 $125,682 1,650 $110,096 254 $18,941 31 $391,223 277 $86,395 APPLICATIONS APPROVED, NOT ACCEPTED 68 $120,853 126 $112,600 437 $112,065 120 $25,242 4 $192,378 53 $95,357 APPLICATIONS DENIED 151 $122,992 375 $94,918 1,172 $96,844 280 $21,216 9 $126,459 139 $92,516 APPLICATIONS WITHDRAWN 119 $122,088 179 $110,688 674 $103,108 26 $21,516 7 $376,394 46 $92,083 FILES CLOSED FOR INCOMPLETENESS 24 $125,990 42 $113,221 297 $111,973 4 $20,742 6 $340,772 27 $99,106
Detailed mortgage data for all 27 tracts in Pomona, CA
Private Mortgage Insurance Companies Aggregated Statistics For Year 2009(Based on 24 full and 1 partial tracts) A) Conventional B) Refinancings C) Non-occupant Loans on Number Average Value Number Average Value Number Average Value
LOANS ORIGINATED 49 $225,170 10 $278,004 0 $0 APPLICATIONS APPROVED, NOT ACCEPTED 33 $242,768 8 $360,500 0 $0 APPLICATIONS DENIED 12 $204,593 5 $278,000 0 $0 APPLICATIONS WITHDRAWN 12 $240,622 3 $288,333 0 $0 FILES CLOSED FOR INCOMPLETENESS 10 $249,745 0 $0 1 $187,000
Aggregated Statistics For Year 2008(Based on 24 full and 1 partial tracts) A) Conventional B) Refinancings C) Non-occupant Loans on Number Average Value Number Average Value Number Average Value
LOANS ORIGINATED 199 $277,938 69 $340,710 9 $226,111 APPLICATIONS APPROVED, NOT ACCEPTED 133 $342,410 151 $360,637 4 $289,262 APPLICATIONS DENIED 47 $264,018 26 $315,156 20 $277,752 APPLICATIONS WITHDRAWN 17 $296,059 9 $352,556 3 $313,333 FILES CLOSED FOR INCOMPLETENESS 7 $312,000 7 $357,956 1 $423,000
Aggregated Statistics For Year 2007(Based on 24 full and 1 partial tracts) A) Conventional B) Refinancings C) Non-occupant Loans on Number Average Value Number Average Value Number Average Value
LOANS ORIGINATED 151 $357,691 150 $383,952 11 $388,000 APPLICATIONS APPROVED, NOT ACCEPTED 32 $368,852 64 $378,352 2 $414,500 APPLICATIONS DENIED 10 $391,253 20 $399,765 4 $463,000 APPLICATIONS WITHDRAWN 16 $385,716 26 $376,499 2 $326,500 FILES CLOSED FOR INCOMPLETENESS 1 $238,000 0 $0 0 $0
Aggregated Statistics For Year 2006(Based on 24 full and 1 partial tracts) A) Conventional B) Refinancings C) Non-occupant Loans on Number Average Value Number Average Value Number Average Value
LOANS ORIGINATED 51 $399,138 76 $359,281 6 $345,167 APPLICATIONS APPROVED, NOT ACCEPTED 13 $409,769 32 $339,531 3 $432,667 APPLICATIONS DENIED 6 $403,000 13 $318,502 5 $360,000 APPLICATIONS WITHDRAWN 2 $380,500 11 $365,953 1 $347,000 FILES CLOSED FOR INCOMPLETENESS 1 $540,000 1 $395,000 1 $540,000
Aggregated Statistics For Year 2005(Based on 24 full and 1 partial tracts) A) Conventional B) Refinancings C) Non-occupant Loans on Number Average Value Number Average Value Number Average Value
LOANS ORIGINATED 82 $336,850 82 $295,721 9 $343,926 APPLICATIONS APPROVED, NOT ACCEPTED 16 $273,571 19 $273,368 3 $272,917 APPLICATIONS DENIED 6 $359,833 9 $329,222 1 $284,000 APPLICATIONS WITHDRAWN 7 $288,286 7 $349,244 3 $325,773 FILES CLOSED FOR INCOMPLETENESS 1 $284,000 3 $236,667 2 $227,000
Aggregated Statistics For Year 2004(Based on 24 full and 1 partial tracts) A) Conventional B) Refinancings C) Non-occupant Loans on Number Average Value Number Average Value Number Average Value
LOANS ORIGINATED 161 $244,843 94 $226,475 26 $236,788 APPLICATIONS APPROVED, NOT ACCEPTED 61 $238,722 65 $211,267 17 $220,290 APPLICATIONS DENIED 4 $288,195 7 $256,429 3 $261,667 APPLICATIONS WITHDRAWN 11 $244,273 8 $236,379 1 $300,000 FILES CLOSED FOR INCOMPLETENESS 5 $222,546 5 $165,800 2 $200,365
Aggregated Statistics For Year 2003(Based on 24 full and 1 partial tracts) A) Conventional B) Refinancings C) Non-occupant Loans on Number Average Value Number Average Value Number Average Value
LOANS ORIGINATED 395 $202,347 273 $171,507 21 $185,518 APPLICATIONS APPROVED, NOT ACCEPTED 97 $182,168 102 $174,839 6 $160,667 APPLICATIONS DENIED 14 $174,357 7 $183,614 3 $208,333 APPLICATIONS WITHDRAWN 20 $171,832 20 $175,085 1 $202,000 FILES CLOSED FOR INCOMPLETENESS 2 $179,000 1 $186,000 0 $0
Aggregated Statistics For Year 2002(Based on 16 full and 2 partial tracts) A) Conventional B) Refinancings C) Non-occupant Loans on Number Average Value Number Average Value Number Average Value
LOANS ORIGINATED 279 $159,419 182 $152,501 18 $150,148 APPLICATIONS APPROVED, NOT ACCEPTED 64 $143,309 82 $148,864 9 $127,111 APPLICATIONS DENIED 13 $156,619 6 $140,500 1 $36,000 APPLICATIONS WITHDRAWN 14 $134,071 17 $139,488 0 $0 FILES CLOSED FOR INCOMPLETENESS 1 $171,000 2 $131,000 0 $0
Aggregated Statistics For Year 2001(Based on 16 full and 2 partial tracts) A) Conventional B) Refinancings C) Non-occupant Loans on Number Average Value Number Average Value Number Average Value
LOANS ORIGINATED 241 $138,665 145 $139,048 22 $124,493 APPLICATIONS APPROVED, NOT ACCEPTED 47 $135,976 55 $133,306 7 $128,693 APPLICATIONS DENIED 17 $139,747 8 $140,375 7 $145,714 APPLICATIONS WITHDRAWN 9 $131,778 10 $133,101 4 $125,750 FILES CLOSED FOR INCOMPLETENESS 2 $244,000 1 $151,440 0 $0
Aggregated Statistics For Year 2000(Based on 16 full and 1 partial tracts) A) Conventional B) Refinancings C) Non-occupant Loans on Number Average Value Number Average Value Number Average Value
LOANS ORIGINATED 190 $128,797 63 $129,818 26 $121,346 APPLICATIONS APPROVED, NOT ACCEPTED 26 $125,711 38 $128,357 5 $113,800 APPLICATIONS DENIED 21 $119,571 7 $118,857 2 $112,500 APPLICATIONS WITHDRAWN 8 $169,000 2 $112,000 1 $100,000 FILES CLOSED FOR INCOMPLETENESS 2 $108,915 1 $144,000 0 $0
Aggregated Statistics For Year 1999(Based on 17 full and 5 partial tracts) A) Conventional B) Refinancings C) Non-occupant Loans on Number Average Value Number Average Value Number Average Value
LOANS ORIGINATED 236 $142,856 250 $136,958 27 $99,216 APPLICATIONS APPROVED, NOT ACCEPTED 23 $146,144 72 $139,935 1 $117,220 APPLICATIONS DENIED 28 $150,501 14 $162,989 1 $154,000 APPLICATIONS WITHDRAWN 10 $146,423 9 $110,910 1 $41,620 FILES CLOSED FOR INCOMPLETENESS 3 $127,173 3 $168,173 0 $0
Fire-safe hotels and motels in Pomona, California:
Rodeway Inn & Suites, 310 E Foothill Blvd, Pomona, California 91767 Phone: (909) 392-6886, Fax: (909) 593-7712
DoubleTree by Hilton Pomona, 3101 W Temple Ave, Pomona, California 91768 Phone: (909) 594-0600, Fax: (909) 348-5385
Sheraton Fairplex, 601 W Mckinley Ave, Pomona, California 91768 Phone: (800) 722-4055, Fax: (909) 622-3577
Comfort Inn, 1421 S Garey Ave, Pomona, California 91766 Phone: (909) 620-0099, Fax: (909) 620-0100
La Quinta Inn&Suites Pomona/Cal Poly, 3200 W Temple Ave, Pomona, California 91768 Phone: (909) 598-0073
All 5 fire-safe hotels and motels in Pomona, California
Most common first names in Pomona, CA among deceased individuals Name Count Lived (average)
John 481 72.5 years Mary 450 80.0 years William 433 73.4 years Robert 388 68.6 years James 344 68.8 years Charles 288 73.8 years George 269 74.9 years Helen 225 79.8 years Ruth 215 80.7 years Margaret 201 79.5 years
Most common last names in Pomona, CA among deceased individuals Last name Count Lived (average)
Smith 228 72.2 years Johnson 174 74.7 years Jones 145 71.0 years Brown 137 72.7 years Williams 136 73.4 years Garcia 103 66.7 years Lopez 99 66.8 years Davis 98 70.7 years Wilson 97 74.0 years Miller 95 74.7 years
Pomona compared to California state average:
Black race population percentage below state average. Hispanic race population percentage above state average. Pomona, CA compared to other similar cities:
#19 on the list of "Top 101 cities with largest percentage of males in occupations: community and social service occupations (population 50,000+)"
#24 on the list of "Top 101 cities with largest percentage of females in occupations: material moving occupations (population 50,000+)"
#24 on the list of "Top 101 cities with the largest city-data.com crime index per police officer (population 50,000+)"
#34 on the list of "Top 101 cities with the highest percentage of family households, population 100,000+"
#41 on the list of "Top 101 cities with largest percentage of females in occupations: farming, fishing, and forestry occupations (population 50,000+)"
#45 on the list of "Top 101 cities with the most cars per house, population 50,000+"
#51 on the list of "Top 101 cities with largest percentage of females in occupations: law enforcement workers including supervisors (population 50,000+)"
#51 on the list of "Top 101 cities with largest percentage of females in industries: wholesale trade (population 50,000+)"
#53 on the list of "Top 101 cities with the lowest percentage of English-only speaking households, population 50,000+"
#53 on the list of "Top 101 cities with the smallest percentage of high school students in private schools (3,000+ students)"
#54 on the list of "Top 101 cities with largest percentage of males in industries: administrative and support and waste management services (population 50,000+)"
#54 on the list of "Top 101 cities with the highest number of auto thefts per 100,000 residents, excludes tourist destinations and others with a lot of outsiders visiting based on city industries data (population 50,000+)"
#55 on the list of "Top 101 cities with largest percentage of males in occupations: construction and extraction occupations (population 50,000+)"
#56 on the list of "Top 101 cities with largest percentage of males in industries: other services, except public administration (population 50,000+)"
#58 on the list of "Top 101 cities with largest percentage of females in occupations: sales and related occupations (population 50,000+)"
#59 on the list of "Top 101 cities with the largest city-data.com crime index increase from 2011 to 2012 (population 50,000+)"
#62 on the list of "Top 101 cities with the highest ratio of murders to rapes between 2002 and 2012 (population 50,000+)"
#64 on the list of "Top 101 larger cities with the highest increase in house/condo value from 2000 (population 50,000+)"
#66 on the list of "Top 100 least-educated cities (pop. 50,000+)"
#66 on the list of "Top 101 cities with the lowest number of police officers per 1000 residents (population 50,000+)"
#1 on the list of "Top 101 counties with the most Evangelical Protestant congregations"
#1 on the list of "Top 101 counties with the most Mainline Protestant congregations"
#1 on the list of "Top 101 counties with the most Orthodox adherents"
#1 on the list of "Top 101 counties with the highest ground withdrawal of fresh water for public supply (pop. 50,000+)"
#1 on the list of "Top 101 counties with the most Catholic adherents (pop. 50,000+)"
Top Patent Applicants
Sher Bahadur Karki (43)
George Michel Mansour (20)
George M. Mansour (9)
John Reedy (9)
Xiaochen Sun (7)
Haidong Gu (7)
Marek Malecki (6)
George Mansour (5)
Thomas J. Wheeler (5)
Juan Maldonado (5)
Total of 302 patent applications in 2008-2024.
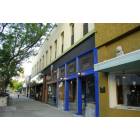
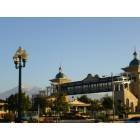
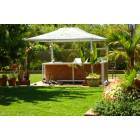
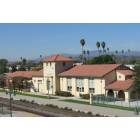
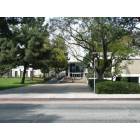
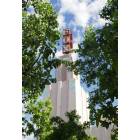
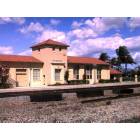
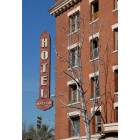


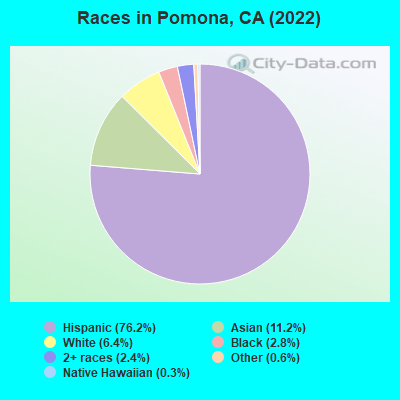
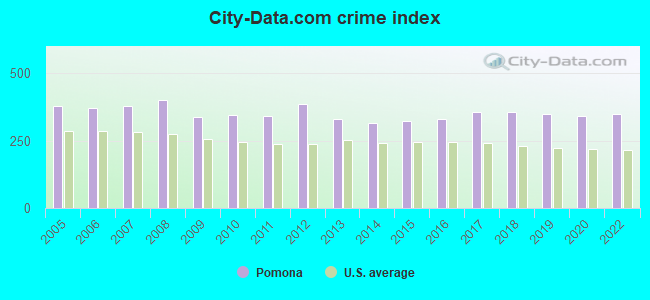
 Recent articles from our blog. Our writers, many of them Ph.D. graduates or candidates, create easy-to-read articles on a wide variety of topics.

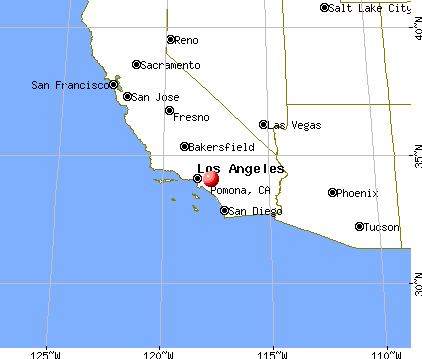
 (6.2 miles
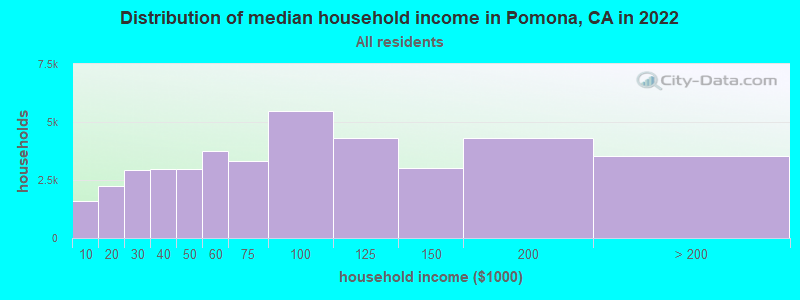
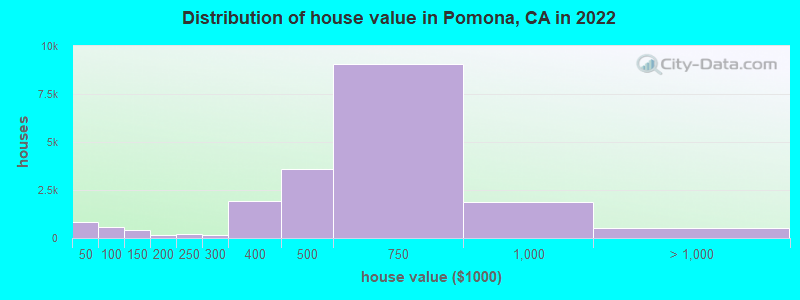
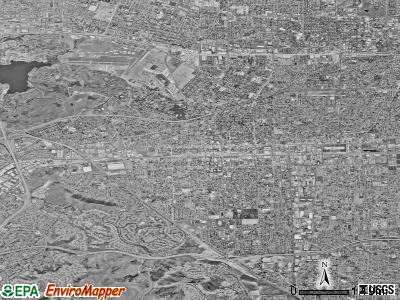
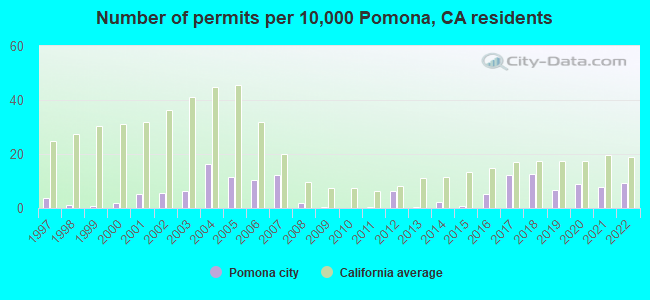
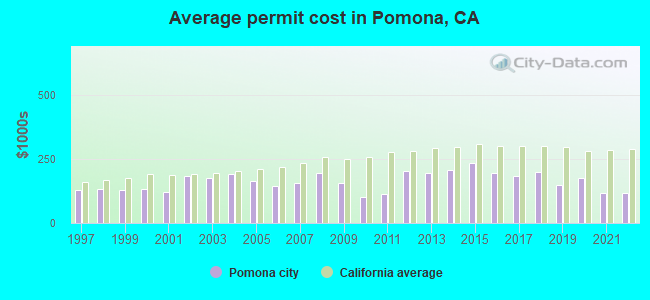
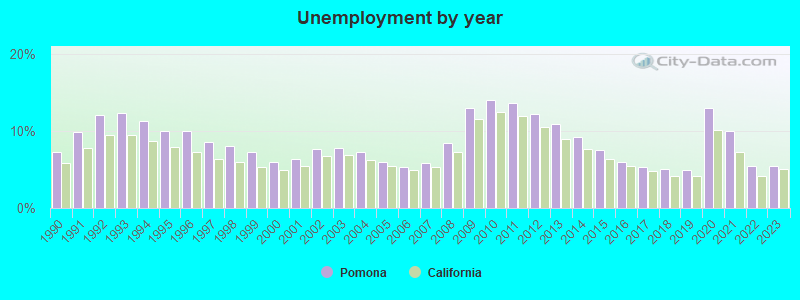
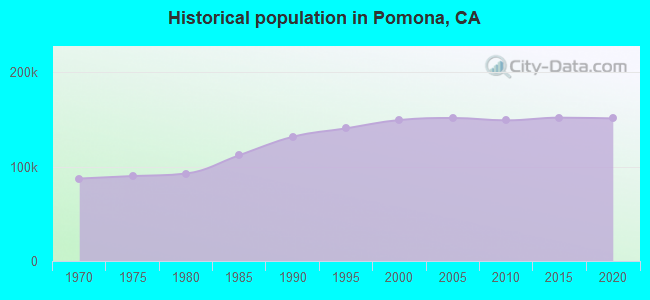
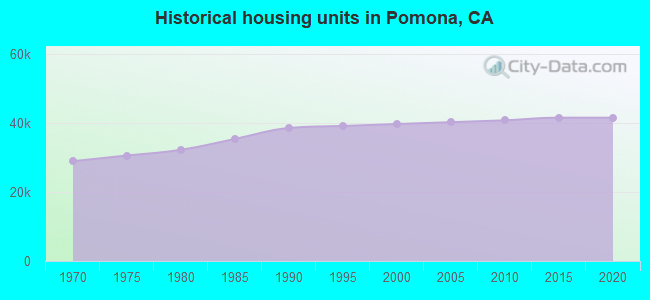
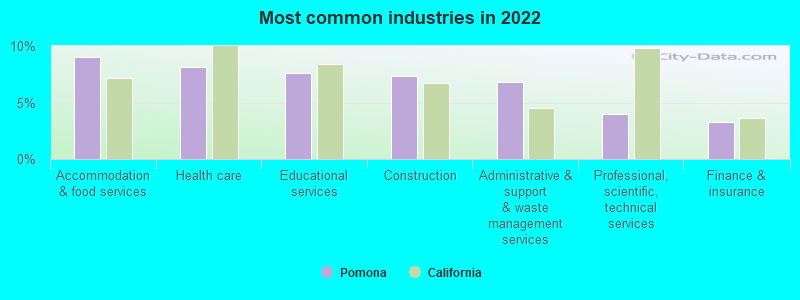
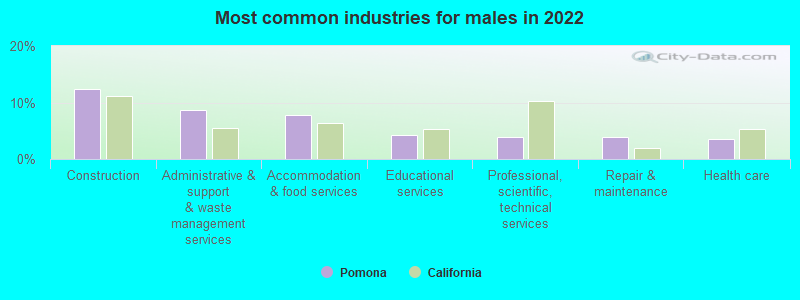
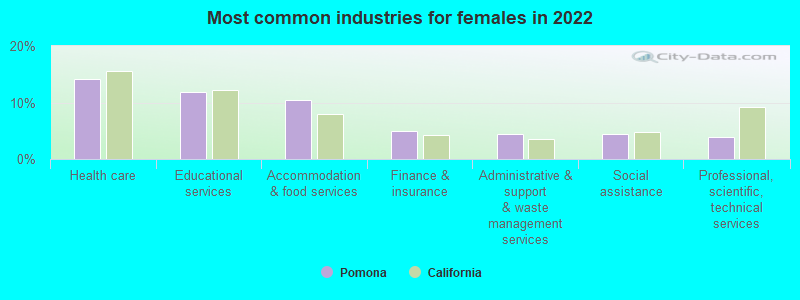
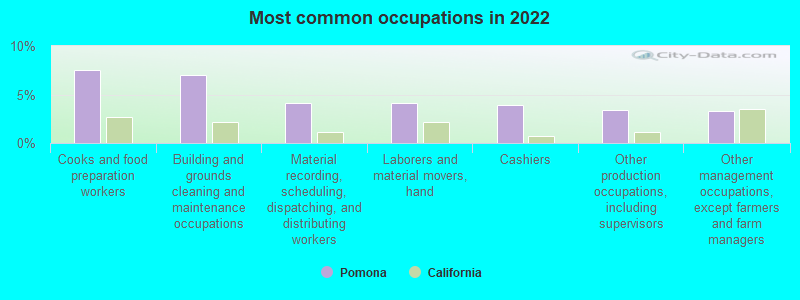
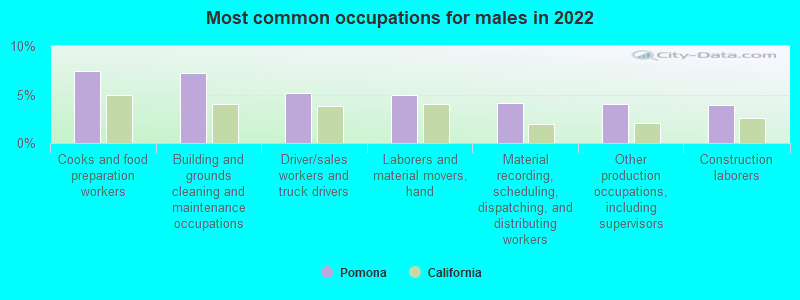
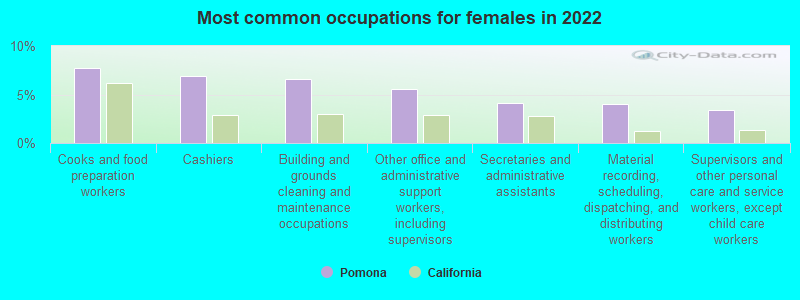

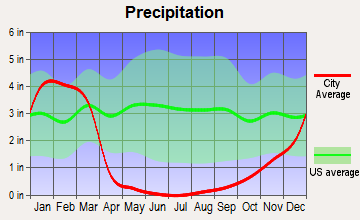
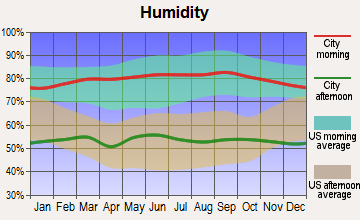
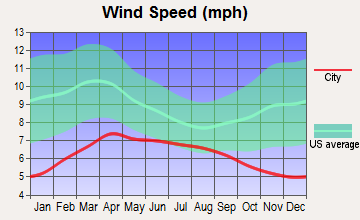
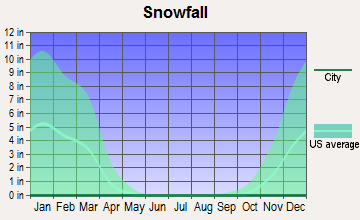
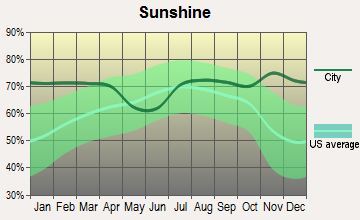
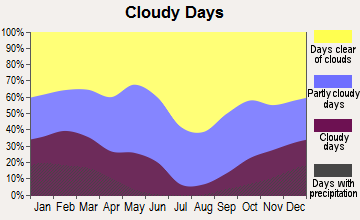
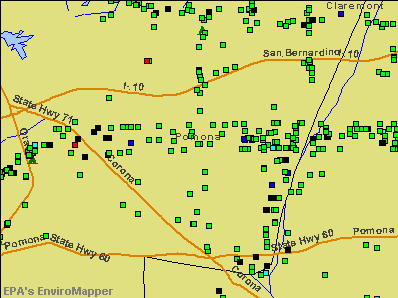

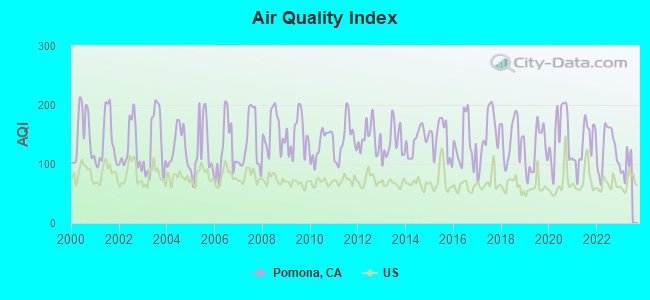
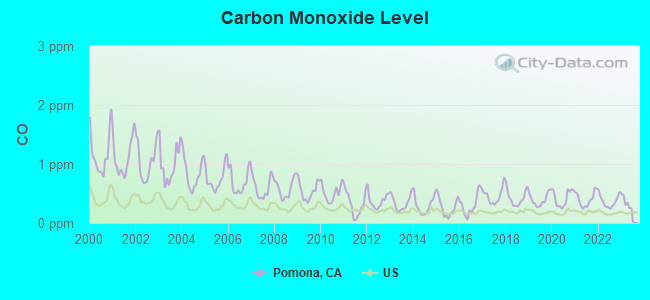
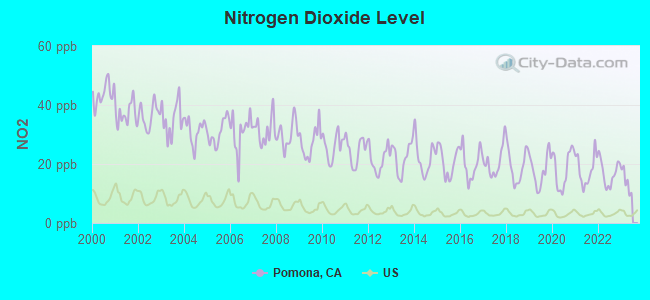
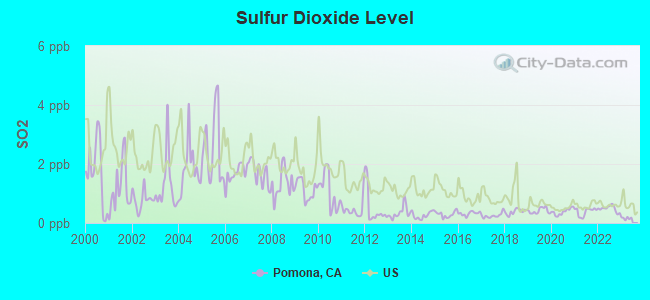
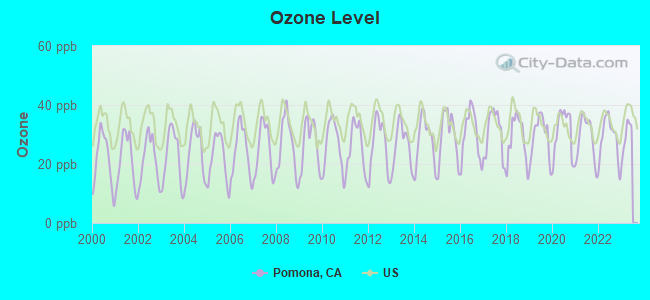
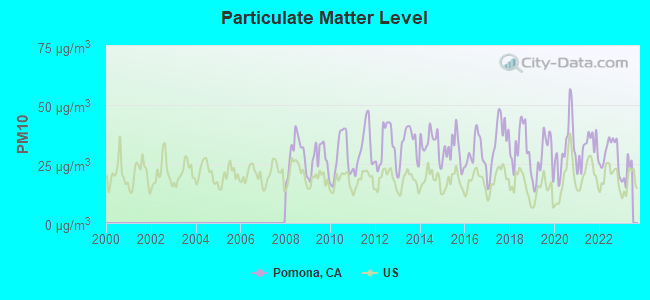
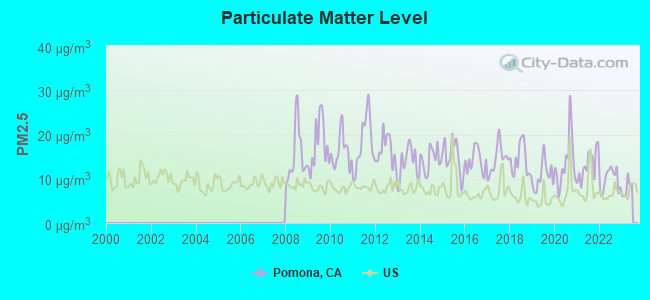
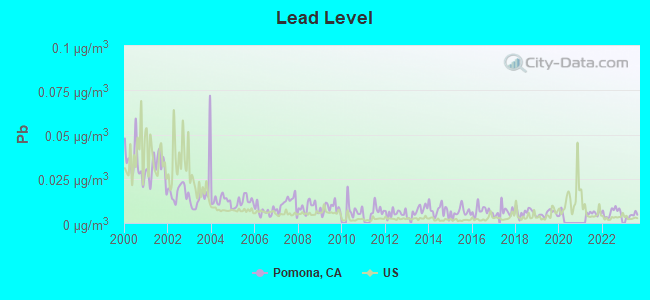
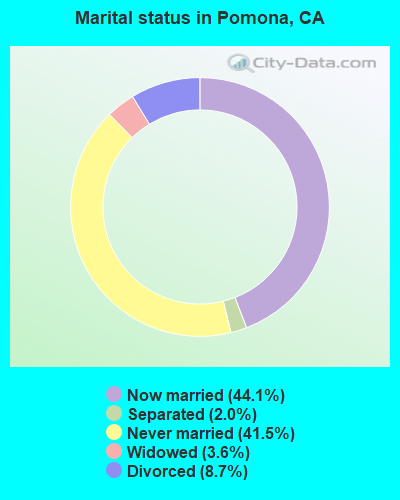
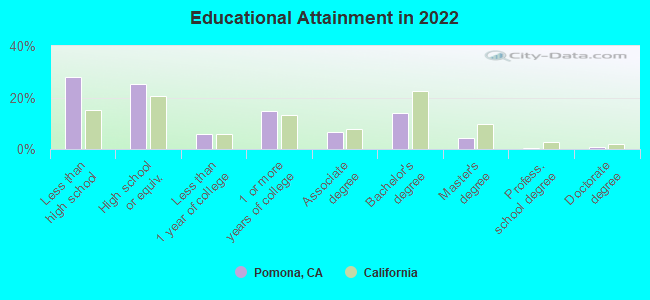
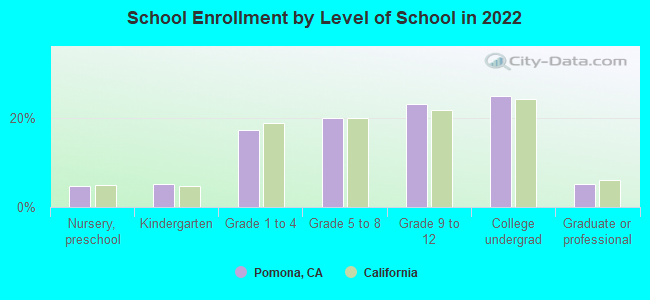
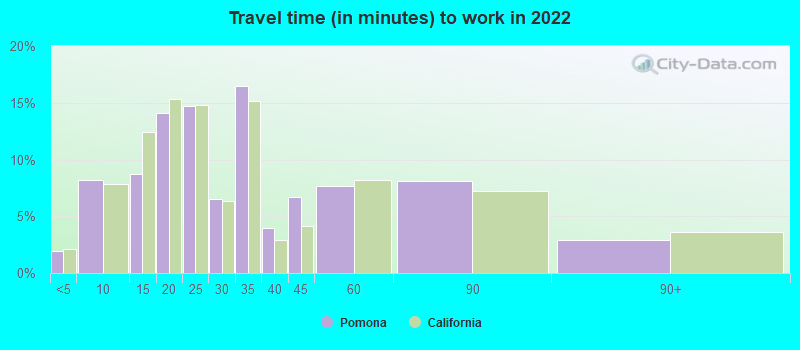
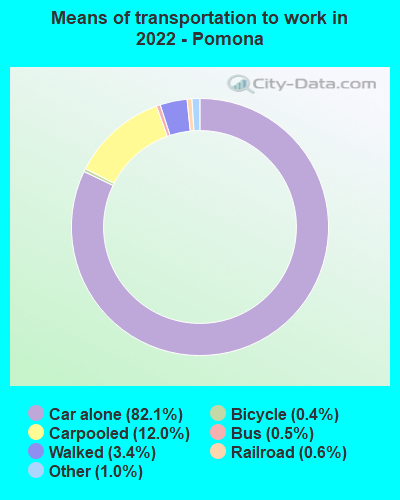


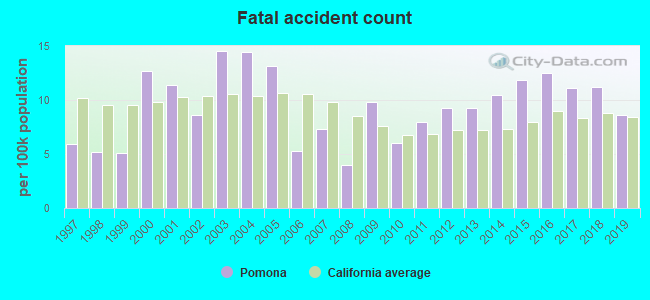
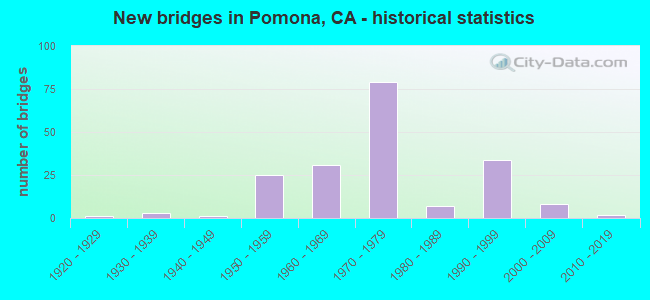
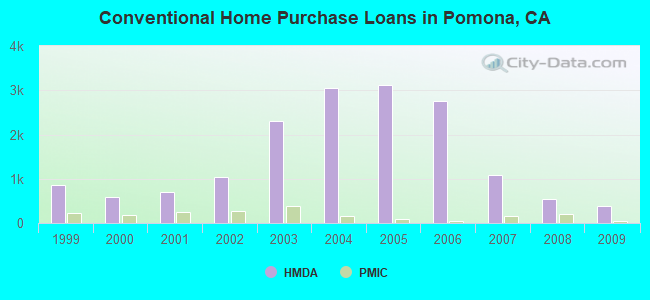
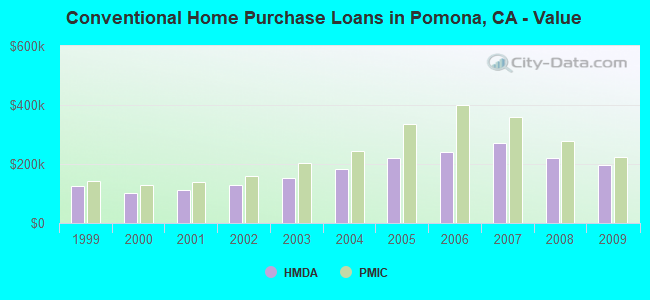
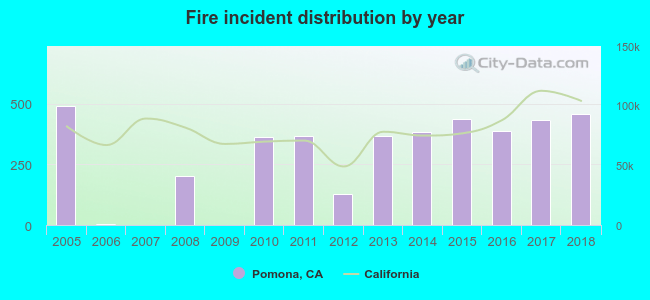 Based on the data from the years 2005 - 2018 the average number of fires per year is 287. The highest number of fires - 492 took place in 2005, and the least - 0 in 2007. The data has a declining trend.
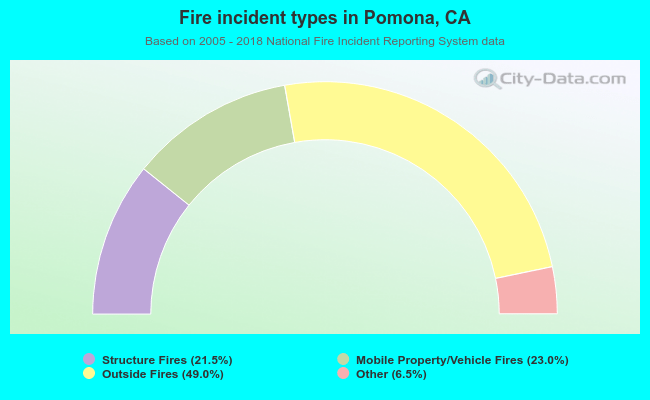 When looking into fire subcategories, the most incidents belonged to: Outside Fires (49.0%), and Mobile Property/Vehicle Fires (23.0%).