Estimated zip code population in 2022: 68,939 Zip code population in 2010: 71,599 Zip code population in 2000: 69,968
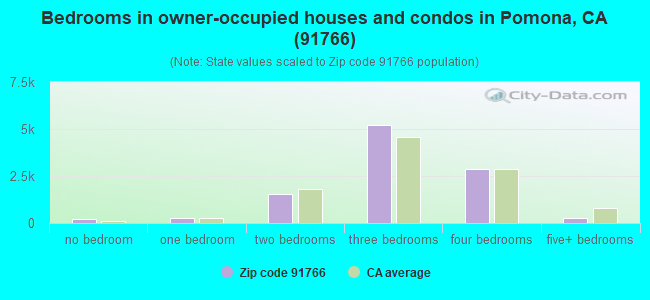
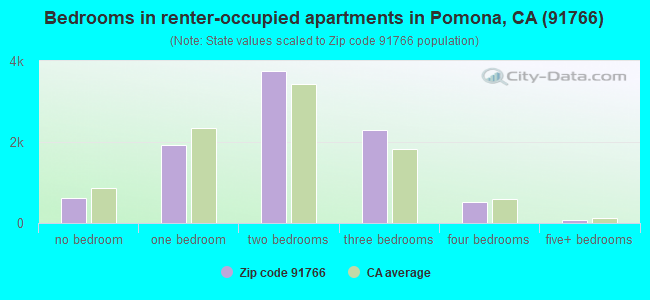
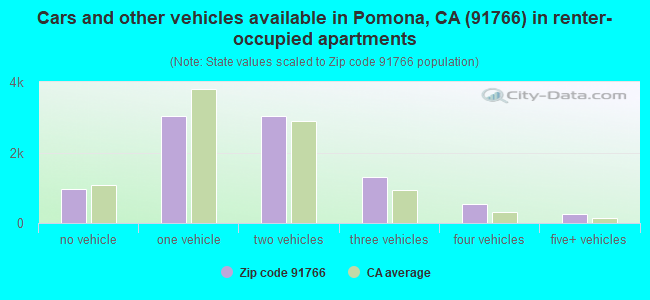
Houses and condos: 20,231 Renter-occupied apartments: 9,177
% of renters here:
47%
State:
44%
March 2022 cost of living index in zip code 91766: 132.7 (high, U.S. average is 100)
Land area: 10.2 sq. mi. Water area: 0.0 sq. mi.
Population density: 6,781 people per square mile
(high).
OSM Map
General Map
Google Map
MSN Map
OSM Map
General Map
Google Map
MSN Map
OSM Map
General Map
Google Map
MSN Map
OSM Map
General Map
Google Map
MSN Map
Please wait while loading the map...
Real estate property taxes paid for housing units in 2022:
This zip code:
0.6% ($3,551)
California:
0.7% ($4,831)
Median real estate property taxes paid for housing units with mortgages in 2022: $3,830 (0.7%) Median real estate property taxes paid for housing units with no mortgage in 2022: $2,941 (0.5%)
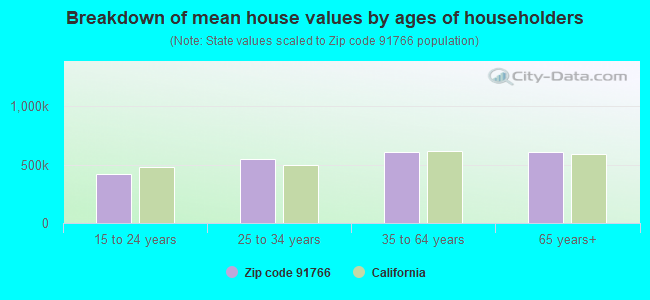
Estimated median house/condo value in 2022: $561,927
91766:
$561,927
California:
$715,900
According to our research of California and other state lists, there were 78 registered sex offenders living in 91766 zip code as of April 27, 2024. The ratio of all residents to sex offenders in zip code 91766 is 938 to 1. The ratio of registered sex offenders to all residents in this zip code is lower than the state average.
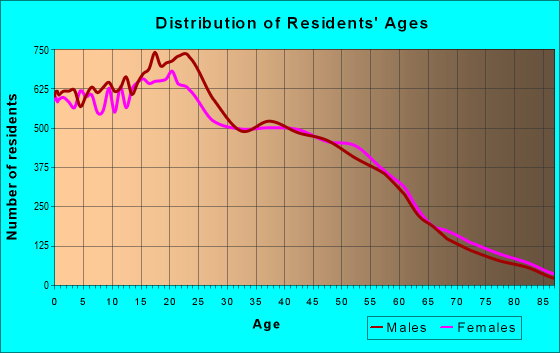
Median resident age:
This zip code:
34.6 years
California median age:
37.9 years
Average household size:
This zip code:
3.5 people
California:
2.8 people
Averages for the 2020 tax year for zip code 91766, filed in 2021:
Average Adjusted Gross Income (AGI) in 2020: $46,818 (Individual Income Tax Returns)
Here:
$46,818
State:
$95,910
Salary/wage: $43,851 (reported on 85.7% of returns)
Here:
$43,851
State:
$77,331
(% of AGI for various income ranges: 1263.2% for AGIs below $25k, 4101.3% for AGIs $25k-50k, 7617.4% for AGIs $50k-75k, 11224.0% for AGIs $75k-100k, 20847.8% for AGIs $100k-200k, 69515.3% for AGIs over 200k)
Taxable interest for individuals: $513 (reported on 21.4% of returns)
This zip code:
$513
California:
$2,294
(% of AGI for various income ranges: 5.5% for AGIs below $25k, 6.1% for AGIs $25k-50k, 10.7% for AGIs $50k-75k, 38.4% for AGIs $75k-100k, 76.8% for AGIs $100k-200k, 440.7% for AGIs over 200k)
Ordinary dividends: $1,882 (reported on 6.3% of returns)
Here:
$1,882
State:
$10,949
(% of AGI for various income ranges: 3.5% for AGIs below $25k, 5.1% for AGIs $25k-50k, 14.5% for AGIs $50k-75k, 23.6% for AGIs $75k-100k, 99.8% for AGIs $100k-200k, 651.3% for AGIs over 200k)
Net capital gain/loss in AGI: +$8,936 (reported on 7.4% of returns)
Here:
+$8,936
State:
+$49,306
(% of AGI for various income ranges: 1.4% for AGIs below $25k, 7.6% for AGIs $25k-50k, 36.4% for AGIs $50k-75k, 66.0% for AGIs $75k-100k, 272.4% for AGIs $100k-200k, 10257.3% for AGIs over 200k)
Profit/loss from business: +$8,693 (reported on 16.7% of returns)
Here:
+$8,693
State:
+$15,671
(% of AGI for various income ranges: 229.9% for AGIs below $25k, 157.4% for AGIs $25k-50k, 186.9% for AGIs $50k-75k, 184.1% for AGIs $75k-100k, 303.1% for AGIs $100k-200k, 1765.3% for AGIs over 200k)
Taxable individual retirement arrangement distribution: $16,954 (reported on 2.3% of returns)
91766:
$16,954
California:
$23,505
(% of AGI for various income ranges: 15.4% for AGIs below $25k, 18.8% for AGIs $25k-50k, 55.0% for AGIs $50k-75k, 124.4% for AGIs $75k-100k, 297.6% for AGIs $100k-200k, 1646.7% for AGIs over 200k)
Self-employed (Keogh) retirement plans: $18,433 (reported on 0.1% of returns)
91766:
$18,433
California:
$30,163
(% of AGI for various income ranges: 35.9% for AGIs $75k-100k)
Total itemized deductions: $28,634 (reported on 9.1% of returns)
Here:
$28,634
State:
$39,517
(% of AGI for various income ranges: 30.9% for AGIs below $25k, 126.1% for AGIs $25k-50k, 476.4% for AGIs $50k-75k, 952.8% for AGIs $75k-100k, 2171.2% for AGIs $100k-200k, 8670.0% for AGIs over 200k)
Charity contributions: $6,009 (reported on 7.4% of returns)
Here:
$6,009
State:
$12,598
(% of AGI for various income ranges: 1.6% for AGIs below $25k, 13.6% for AGIs $25k-50k, 61.6% for AGIs $50k-75k, 124.7% for AGIs $75k-100k, 399.0% for AGIs $100k-200k, 2711.3% for AGIs over 200k)
Taxes paid: $8,419 (reported on 9.0% of returns)
91766:
$8,419
State:
$8,807
(% of AGI for various income ranges: 8.1% for AGIs below $25k, 34.0% for AGIs $25k-50k, 139.5% for AGIs $50k-75k, 304.9% for AGIs $75k-100k, 685.2% for AGIs $100k-200k, 1970.7% for AGIs over 200k)
Earned income credit: $2,226 (reported on 21.4% of returns)
Here:
$2,226
State:
$2,074
(% of AGI for various income ranges: 108.5% for AGIs below $25k, 79.4% for AGIs $25k-50k, 1.6% for AGIs $50k-75k)
Percentage of individuals using paid preparers for their 2020 taxes: 92.0%
Here:
92%
State:
92%
(% for various income ranges: 90.6% for AGIs below $25k, 92.5% for AGIs $25k-50k, 92.7% for AGIs $50k-75k, 93.1% for AGIs $75k-100k, 93.3% for AGIs $100k-200k, 94.2% for AGIs over 200k)
Averages for the 2012 tax year for zip code 91766, filed in 2013:
Average Adjusted Gross Income (AGI) in 2012: $36,974 (Individual Income Tax Returns)
Here:
$36,974
State:
$72,726
Salary/wage: $35,531 (reported on 87.1% of returns)
Here:
$35,531
State:
$59,079
(% of AGI for various income ranges: 78.6% for AGIs below $25k, 88.8% for AGIs $25k-50k, 88.8% for AGIs $50k-75k, 85.9% for AGIs $75k-100k, 82.7% for AGIs $100k-200k, 67.0% for AGIs over 200k)
Taxable interest for individuals: $389 (reported on 21.5% of returns)
This zip code:
$389
California:
$2,146
(% of AGI for various income ranges: 0.2% for AGIs below $25k, 0.1% for AGIs $25k-50k, 0.1% for AGIs $50k-75k, 0.2% for AGIs $75k-100k, 0.3% for AGIs $100k-200k, 0.7% for AGIs over 200k)
Ordinary dividends: $1,873 (reported on 5.5% of returns)
Here:
$1,873
State:
$9,308
(% of AGI for various income ranges: 0.1% for AGIs below $25k, 0.2% for AGIs $25k-50k, 0.2% for AGIs $50k-75k, 0.2% for AGIs $75k-100k, 0.4% for AGIs $100k-200k, 0.9% for AGIs over 200k)
Net capital gain/loss in AGI: +$1,377 (reported on 4.7% of returns)
Here:
+$1,377
State:
+$30,460
(% of AGI for various income ranges: 0.3% for AGIs $100k-200k, 2.1% for AGIs over 200k)
Profit/loss from business: +$10,610 (reported on 16.8% of returns)
Here:
+$10,610
State:
+$17,064
(% of AGI for various income ranges: 13.7% for AGIs below $25k, 4.0% for AGIs $25k-50k, 1.8% for AGIs $50k-75k, 1.6% for AGIs $75k-100k, 2.3% for AGIs $100k-200k, 3.9% for AGIs over 200k)
Taxable individual retirement arrangement distribution: $14,605 (reported on 2.7% of returns)
91766:
$14,605
California:
$19,557
(% of AGI for various income ranges: 0.7% for AGIs below $25k, 0.7% for AGIs $25k-50k, 0.9% for AGIs $50k-75k, 1.3% for AGIs $75k-100k, 2.0% for AGIs $100k-200k, 0.9% for AGIs over 200k)
Self-employment retirement plans: $13,975 (reported on 0.1% of returns)
91766:
$13,975
California:
$24,530
Total itemized deductions: $22,100 (29% of AGI, reported on 25.0% of returns)
Here:
$22,100
State:
$34,004
Here:
28.7% of AGI
State:
22.7% of AGI
(% of AGI for various income ranges: 5.2% for AGIs below $25k, 12.1% for AGIs $25k-50k, 18.4% for AGIs $50k-75k, 20.1% for AGIs $75k-100k, 21.4% for AGIs $100k-200k, 16.5% for AGIs over 200k)
Charity contributions: $2,512 (reported on 20.1% of returns)
Here:
$2,512
State:
$4,659
(% of AGI for various income ranges: 0.3% for AGIs below $25k, 0.9% for AGIs $25k-50k, 1.6% for AGIs $50k-75k, 2.0% for AGIs $75k-100k, 2.3% for AGIs $100k-200k, 1.7% for AGIs over 200k)
Taxes paid: $6,931 (reported on 24.9% of returns)
91766:
$6,931
State:
$14,448
(% of AGI for various income ranges: 1.1% for AGIs below $25k, 2.7% for AGIs $25k-50k, 5.0% for AGIs $50k-75k, 6.4% for AGIs $75k-100k, 8.0% for AGIs $100k-200k, 8.7% for AGIs over 200k)
Earned income credit: $2,619 (reported on 30.6% of returns)
Here:
$2,619
State:
$2,286
(% of AGI for various income ranges: 9.0% for AGIs below $25k, 1.9% for AGIs $25k-50k)
Percentage of individuals using paid preparers for their 2012 taxes: 76.4%
Here:
76%
State:
64%
(% for various income ranges: 75.9% for AGIs below $25k, 79.0% for AGIs $25k-50k, 75.7% for AGIs $50k-75k, 73.7% for AGIs $75k-100k, 71.6% for AGIs $100k-200k, 78.3% for AGIs over 200k)
Averages for the 2004 tax year for zip code 91766, filed in 2005:
Average Adjusted Gross Income (AGI) in 2004: $33,806 (Individual Income Tax Returns)
Here:
$33,806
State:
$58,600
Salary/wage: $32,954 (reported on 90.8% of returns)
Here:
$32,954
State:
$49,455
(% of AGI for various income ranges: 96.0% for AGIs below $10k, 87.0% for AGIs $10k-25k, 92.0% for AGIs $25k-50k, 90.7% for AGIs $50k-75k, 89.6% for AGIs $75k-100k, 81.2% for AGIs over 100k)
Taxable interest for individuals: $514 (reported on 28.1% of returns)
This zip code:
$514
California:
$2,365
(% of AGI for various income ranges: 1.5% for AGIs below $10k, 0.4% for AGIs $10k-25k, 0.3% for AGIs $25k-50k, 0.4% for AGIs $50k-75k, 0.5% for AGIs $75k-100k, 0.5% for AGIs over 100k)
Taxable dividends: $1,063 (reported on 7.5% of returns)
Here:
$1,063
State:
$4,746
(% of AGI for various income ranges: 0.9% for AGIs below $10k, 0.1% for AGIs $10k-25k, 0.1% for AGIs $25k-50k, 0.1% for AGIs $50k-75k, 0.2% for AGIs $75k-100k, 0.5% for AGIs over 100k)
Net capital gain/loss: +$7,517 (reported on 5.7% of returns)
Here:
+$7,517
State:
+$23,418
(% of AGI for various income ranges: -0.7% for AGIs below $10k, -0.2% for AGIs $10k-25k, 0.2% for AGIs $25k-50k, 0.4% for AGIs $50k-75k, 0.6% for AGIs $75k-100k, 5.6% for AGIs over 100k)
Profit/loss from business: +$9,715 (reported on 14.1% of returns)
Here:
+$9,715
State:
+$16,826
(% of AGI for various income ranges: 13.0% for AGIs below $10k, 8.0% for AGIs $10k-25k, 3.2% for AGIs $25k-50k, 2.2% for AGIs $50k-75k, 1.9% for AGIs $75k-100k, 3.7% for AGIs over 100k)
IRA payment deduction: $3,024 (reported on 1.4% of returns)
91766:
$3,024
California:
$3,192
(% of AGI for various income ranges: 0.1% for AGIs $10k-25k, 0.1% for AGIs $25k-50k, 0.1% for AGIs $50k-75k, 0.2% for AGIs $75k-100k, 0.1% for AGIs over 100k)
Self-employed pension: $14,309 (reported on 0.2% of returns)
Here:
$14,309
California:
$17,688
Total itemized deductions: $20,281 (33% of AGI, reported on 32.2% of returns)
Here:
$20,281
State:
$28,113
Here:
32.5% of AGI
State:
25.3% of AGI
(% of AGI for various income ranges: 6.3% for AGIs below $10k, 8.6% for AGIs $10k-25k, 18.7% for AGIs $25k-50k, 24.2% for AGIs $50k-75k, 26.9% for AGIs $75k-100k, 22.1% for AGIs over 100k)
Charity contributions deductions: $2,365 (4% of AGI, reported on 28.1% of returns)
Here:
$2,365
State:
$3,923
Here:
3.6% of AGI
State:
3.3% of AGI
(% of AGI for various income ranges: 0.3% for AGIs below $10k, 0.5% for AGIs $10k-25k, 1.6% for AGIs $25k-50k, 2.4% for AGIs $50k-75k, 3.0% for AGIs $75k-100k, 2.8% for AGIs over 100k)
Total tax: $3,965 (reported on 59.4% of returns)
91766:
$3,965
State:
$10,761
(% of AGI for various income ranges: 3.2% for AGIs below $10k, 3.1% for AGIs $10k-25k, 4.2% for AGIs $25k-50k, 6.6% for AGIs $50k-75k, 8.4% for AGIs $75k-100k, 14.4% for AGIs over 100k)
Earned income credit: $2,008 (reported on 28.4% of returns)
Here:
$2,008
State:
$1,763
Percentage of individuals using paid preparers for their 2004 taxes: 77.6%
Here:
78%
State:
66%
(% for various income ranges: 70.6% for AGIs below $10k, 80.7% for AGIs $10k-25k, 80.4% for AGIs $25k-50k, 78.0% for AGIs $50k-75k, 72.7% for AGIs $75k-100k, 70.0% for AGIs over 100k)
Likely homosexual households (counted as self-reported same-sex unmarried-partner households)
Lesbian couples: 0.6% of all households
Gay men: 0.1% of all households
Household received Food Stamps/SNAP in the past 12 months: 3,552 Household did not receive Food Stamps/SNAP in the past 12 months: 16,230
Women who had a birth in the past 12 months: 676 (388 now married, 289 unmarried) Women who did not have a birth in the past 12 months: 16,763 (5,956 now married, 10,836 unmarried)
Housing units in zip code 91766 with a mortgage: 6,586 (445 second mortgage, 76 home equity loan, 237 both second mortgage and home equity loan) Houses without a mortgage: 234
Median monthly owner costs for units with a mortgage: $2,103 Median monthly owner costs for units without a mortgage: $617
Residents with income below the poverty level in 2022:
This zip code:
14.6%
Whole state:
12.2%
Residents with income below 50% of the poverty level in 2022:
This zip code:
5.7%
Whole state:
6.2%
Median number of rooms in houses and condos:
Here:
5.7
State:
6.0
Median number of rooms in apartments:
Here:
4.1
State:
3.9
Notable locations in this zip code not listed on our city pages
Notable locations in zip code 91766: Pomona Water Reclamation Plant (A), Palm Lake Golf Course (B), Pomona County Building (C), Pomona City Hall (D), Eagles Hall (E), Pomona Public Library (F), Los Angeles County Fire Department Station 188 (G), Los Angeles County Fire Department Station 185 (H), Los Angeles County Fire Department Station 181 (I). Display/hide their locations on the map
Churches in zip code 91766 include: Prayer Tower Ministries (A), Church of Christ (B), Church of God (C), Mount Zion Baptist Church (D), Pentecostal Church of God (E), Pomona Congregational Mexican Church (F), Revival Center Church (G), Seventh Day Adventist Church (H), White Avenue Baptist Church (I). Display/hide their locations on the map
Parks in zip code 91766 include: Central Park (1), Washington Park (2), Welch Park (3), Westmont Park (4), Madison Park (5), Doctor Martin Luther King Junior Memorial Park (6), Phillips Ranch Park (7), Edison Historic District (8). Display/hide their locations on the map
8,171 married couples with children.
4,680 single-parent households (1,683 men, 2,997 women).
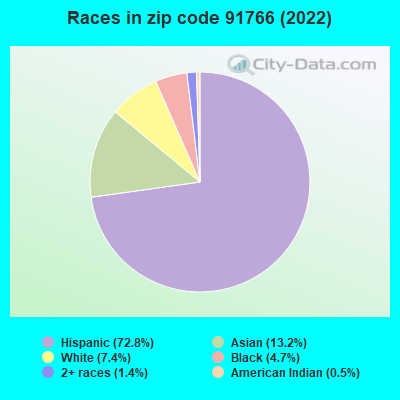
28.7% of residents of 91766 zip code speak English at home.
58.6% of residents speak Spanish at home (63% very well, 13% well, 15% not well, 10% not at all).
0.9% of residents speak other Indo-European language at home (68% very well, 18% well, 14% not well).
11.1% of residents speak Asian or Pacific Island language at home (46% very well, 22% well, 21% not well, 11% not at all).
0.7% of residents speak other language at home (91% very well, 9% well).
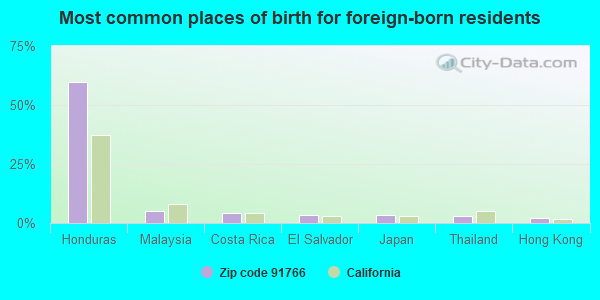
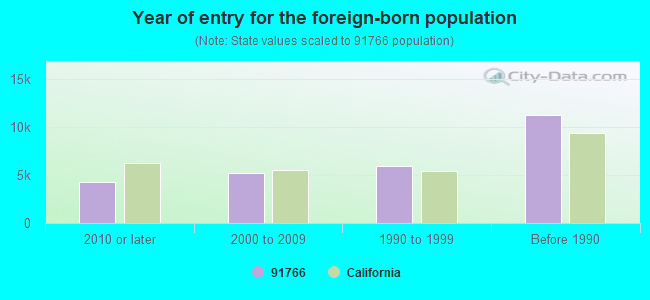
Foreign born population: 26,112 (37.9%) (49.5% of them are naturalized citizens)
Major facilities with environmental interests located in this zip code:
C & T AUTO WRECKING (121 SOUTH HAMILTON BOULEVARD in POMONA, CA)
(Integrated Compliance Information System) - ICIS-09-2002-0096, FORMAL ENFORCEMENT ACTION, ICIS-09-2004-0433, ENFORCEMENT/COMPLIANCE ACTIVITY (Integrated Compliance Information System) - ICIS-09-2002-0096, FORMAL ENFORCEMENT ACTION, ICIS-09-2004-0433, ENFORCEMENT/COMPLIANCE ACTIVITY National Pollutant Discharge Elimination System NON-MAJOR (Tracking pollutant discharge elimination systems) - permit Business SIC classification: MOTOR VEHICLE PARTS, USED
MARAN WURZELL GLASS AND MIRROR COMPANY (1683 MOUNT VERNON AVE in POMONA, CA)
STATE MASTER (California - Hazardous Waste Tracking) - HAZARDOU WASTE PROGRAM HAZARDOUS WASTE BIENNIAL REPORTER (Resource Conservation and Recovery Act (tracking hazardous waste)) Large Quantity Generators, more that 1000 kg of hazardous waste/month (Resource Conservation and Recovery Act (tracking hazardous waste)) Business NAICS classification: ELECTROPLATING, PLATING, POLISHING, ANODIZING, AND COLORING. Organizations: MARAN-WURZELL GLASS AND MIRROR COMPANY (CONTACT/OPERATOR)
, SANPORT DEVELOPMENT (CONTACT/OWNER)
CALIFORNIA MINI TRUCK (4002 STATE ST in POMONA, CA)
STATE MASTER (California - Hazardous Waste Tracking) - HAZARDOU WASTE PROGRAM National Pollutant Discharge Elimination System NON-MAJOR (Tracking pollutant discharge elimination systems) - permit Small Quantity Generators, between 100 kg and 1000 kg of hazardous waste/month (Resource Conservation and Recovery Act (tracking hazardous waste)) - notification Organizations: RON WEHBY (CONTACT/OWNER)
M C NOTTINGHAM CO OF SO CAL (1415 E 9TH ST in POMONA, CA)
STATE MASTER (California - Hazardous Waste Tracking) - HAZARDOU WASTE PROGRAM Small Quantity Generators, between 100 kg and 1000 kg of hazardous waste/month (Resource Conservation and Recovery Act (tracking hazardous waste)) TRANSPORTER (Resource Conservation and Recovery Act (tracking hazardous waste)) - notification Organizations: OTTO L POLZIN (CONTACT/OPERATOR)
LAZY DAZE INC (4303 E MISSION BLVD in POMONA, CA)
STATE MASTER (California - Hazardous Waste Tracking) - HAZARDOU WASTE PROGRAM CRITERIA AND HAZARDOUS AIR POLLUTANT INVENTORY (Inventory of air pollution sources) Small Quantity Generators, between 100 kg and 1000 kg of hazardous waste/month (Resource Conservation and Recovery Act (tracking hazardous waste)) - notification Business SIC classification: MOTOR HOMES Business NAICS classification: MOTOR HOME MANUFACTURING. Organizations: H E & PAUL NEWTON (CONTACT/OWNER)
Alternative names: LAZY DAZE MOTORHOMES
FDS MFG CO INC (2200 S RESERVOIR ST in POMONA, CA)
STATE MASTER (California - Hazardous Waste Tracking) - HAZARDOU WASTE PROGRAM Small Quantity Generators, between 100 kg and 1000 kg of hazardous waste/month (Resource Conservation and Recovery Act (tracking hazardous waste)) - notification Organizations: F D S MANFACTURING CORP (CONTACT/OWNER)
Alternative names: F D S MANFACTURING CO INC
A&S ALL PURPOSE MACHINE (2300 S RESERVOIR STE 314 in POMONA, CA)
STATE MASTER (California - Hazardous Waste Tracking) - HAZARDOU WASTE PROGRAM Small Quantity Generators, between 100 kg and 1000 kg of hazardous waste/month (Resource Conservation and Recovery Act (tracking hazardous waste)) - notification Business NAICS classification: OTHER COMMERCIAL AND SERVICE INDUSTRY MACHINERY MANUFACTURING. Organizations: MC GEE ELECTRIC (CONTACT/OWNER)
EQUILON ENTERPRISES LLC (2741 S TOWNE AVE in POMONA, CA) . Federal Facility
STATE MASTER (California - Hazardous Waste Tracking) - HAZARDOU WASTE PROGRAM Small Quantity Generators, between 100 kg and 1000 kg of hazardous waste/month (Resource Conservation and Recovery Act (tracking hazardous waste)) - notification TRANSPORTER (Resource Conservation and Recovery Act (tracking hazardous waste)) - notification Organizations: TEXACO REFINING AND MARKETING (CONTACT/OWNER)
Alternative names: TEXACO REFINING AND MARKETING
FAIRPLEX LA COUNTY FAIRGROUNDS (MAINT DEPT GATE 7 in POMONA, CA)
STATE MASTER (California - Hazardous Waste Tracking) - HAZARDOU WASTE PROGRAM Small Quantity Generators, between 100 kg and 1000 kg of hazardous waste/month (Resource Conservation and Recovery Act (tracking hazardous waste)) - notification
C & B DELIVERY (1405 EAST FRANKLIN in POMONA, CA)
STATE MASTER (California - Hazardous Waste Tracking) - HAZARDOU WASTE PROGRAM Small Quantity Generators, between 100 kg and 1000 kg of hazardous waste/month (Resource Conservation and Recovery Act (tracking hazardous waste)) - notification Organizations: MYGE TEMPLETON (CONTACT/OWNER)
CHINO HILLS NISSAN SVC (45 RIO RANCHO RD UNIT 1B in POMONA, CA)
STATE MASTER (California - Hazardous Waste Tracking) - HAZARDOU WASTE PROGRAM Small Quantity Generators, between 100 kg and 1000 kg of hazardous waste/month (Resource Conservation and Recovery Act (tracking hazardous waste)) - notification Organizations: BOONTANOM SOONTRON (CONTACT/OWNER)
HOUSE OF ENGINES (575 S E END AVE in POMONA, CA)
STATE MASTER (California - Hazardous Waste Tracking) - HAZARDOU WASTE PROGRAM Small Quantity Generators, between 100 kg and 1000 kg of hazardous waste/month (Resource Conservation and Recovery Act (tracking hazardous waste)) - notification Organizations: SABA HAWEILEH (CONTACT/OWNER)
FIRST TRANSIT (200 SOUTH EAST END AVENUE in POMONA, CA)
STATE MASTER (California - Hazardous Waste Tracking) - HAZARDOU WASTE PROGRAM Small Quantity Generators, between 100 kg and 1000 kg of hazardous waste/month (Resource Conservation and Recovery Act (tracking hazardous waste)) - notification Organizations: WAYNE FRITZ (CONTACT/OWNER)
Alternative names: RYDER MLS
Housing units lacking complete plumbing facilities: 0.8% Housing units lacking complete kitchen facilities: 1.7%
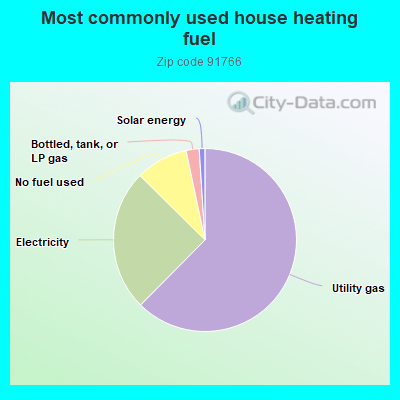
62.2%Utility gas
24.9%Electricity
9.2%No fuel used
2.3%Bottled, tank, or LP gas
1.0%Solar energy
Population in 1990: 64,056. Population change in the 1990s: +5,912 (+9.2%).
Place of birth for U.S.-born residents:
This state: 39,185
Northeast: 507
Midwest: 547
South: 1,458
West: 629
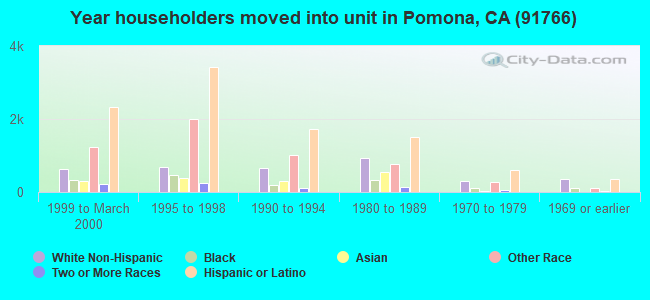
57% of the 91766 zip code residents lived in the same house 5 years ago. Out of people who lived in different houses, 75% lived in this county. Out of people who lived in different counties, 50% lived in California.
94% of the 91766 zip code residents lived in the same house 1 year ago. Out of people who lived in different houses, 57% moved from this county. Out of people who lived in different houses, 32% moved from different county within same state. Out of people who lived in different houses, 9% moved from different state. Out of people who lived in different houses, 6% moved from abroad.
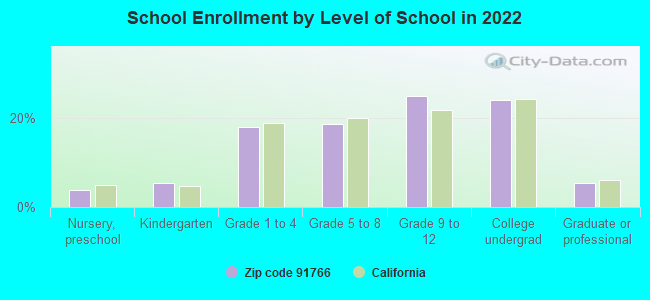
Private vs. public school enrollment:
Students in private schools in grades 1 to 8 (elementary and middle school): 144
Here:
2.0%
California:
10.5%
Students in private schools in grades 9 to 12 (high school): 82
Here:
1.7%
California:
8.5%
Students in private undergraduate colleges: 595
Here:
12.6%
California:
15.9%
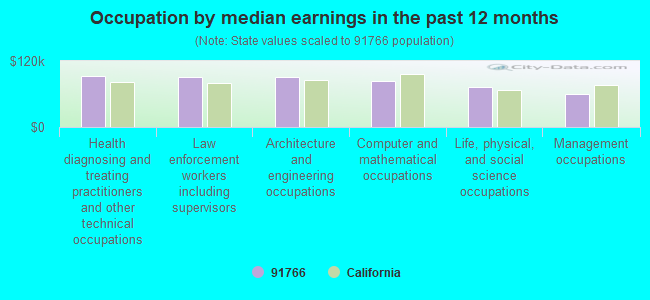
Occupation by median earnings in the past 12 months ($)
92,143Health diagnosing and treating practitioners and other technical occupations
91,161Law enforcement workers including supervisors
90,286Architecture and engineering occupations
82,883Computer and mathematical occupations
71,924Life, physical, and social science occupations
60,389Management occupations
Companies with biggest federal contracts located in this zip code (POMONA, CA):
REYES CONSTRUCTION INC (1383 S SIGNAL DRIVE; small business) : $89,455,500 in 224 contractsfrom 1999 to 2006
Contracts for Construction of Structures and Facilities -- Other Administrative Facilities and Service Buildings, Construction of Structures and Facilities -- Other Utilities, Construction of Structures and Facilities -- Water Supply Facilities, Maintenance, Repair or Alteration of Real Property -- Other Non-Building Facilities, and moreby Navy, Army, U.S. Army Corps of Engineers - civil program financing only, U.S. Coast Guard, and others Signed by year:2000: $10,370,421; 2001: $13,918,777; 2002: $19,043,063; 2003: $9,882,867; 2004: $8,934,495; 2005: $23,147,125; 2006: $1,524,030.
Biggest contracts:
$11,798,910 with Navy for Construction of Structures and Facilities -- Other Administrative Facilities and Service Buildings. Signed on 2002-09-30. Completion date: 2003-10-30.
$7,975,000 with Navy for Construction of Structures and Facilities -- Other Utilities. Signed on 2005-09-29. Completion date: 2007-04-07.
$3,947,000 with Navy for Construction of Structures and Facilities -- Water Supply Facilities. Signed on 2004-09-21. Completion date: 2006-09-29.
$2,950,000 with Navy for Maintenance, Repair or Alteration of Real Property -- Other Non-Building Facilities. Signed on 2004-09-30. Completion date: 2005-01-14.
MIRAMAR CONSTRUCTION, INC (1521 E GRAND AVENUE; small business) : $14,849,460 in 73 contractsfrom 2003 to 2006
Contracts for Maintenance, Repair or Alteration of Real Property -- Miscellaneous Buildings, Maintenance, Repair or Alteration of Real Property -- Other Non-Building Facilities, Construction of Structures and Facilities -- Miscellaneous Buildings, Maintenance, Repair or Alteration of Real Property -- Restoration of real property, and moreby U.S. Army Corps of Engineers - civil program financing only, Army, Department of Veterans Affairs, Bureau of Reclamation, and others Signed by year:2000: $0; 2001: $0; 2002: $0; 2003: $4,604,656; 2004: $4,668,719; 2005: $4,830,024; 2006: $746,061.
Biggest contracts:
$2,499,595 with U.S. Army Corps of Engineers - civil program financing only for Maintenance, Repair or Alteration of Real Property -- Miscellaneous Buildings. Signed on 2003-07-28. Completion date: 2004-10-22.
$2,026,902 with Army for Maintenance, Repair or Alteration of Real Property -- Other Non-Building Facilities. Signed on 2005-09-30. Completion date: 2006-09-29.
$1,669,645 with Army for Construction of Structures and Facilities -- Miscellaneous Buildings. Signed on 2003-09-02. Completion date: 2004-07-01.
$1,100,000 with Army for Maintenance, Repair or Alteration of Real Property -- Restoration of real property. Signed on 2004-03-26. Completion date: 2004-04-02.
GOULD-BASS CO INC (1431 W 2ND ST; small business) : $10,961,438 in 56 contractsfrom 2000 to 2006
Contracts for Physical Properties Testing and Inspection, Chemical Analysis Instruments, Miscellaneous Items, Miscellaneous Maintenance and Repair Shop Specialized Equipment, and moreby Air Force, Army, Navy Signed by year:2000: $1,820,511; 2001: $305,440; 2002: $2,845,000; 2003: $1,472,986; 2004: $433,337; 2005: $2,836,725; 2006: $1,247,439.
Biggest contracts:
$2,354,863 with Air Force for Physical Properties Testing and Inspection. Signed on 2002-09-12. Completion date: 2007-09-16.
$1,363,250, same as above.Signed on 2005-02-28. Completion date: 2005-10-31.
$994,710, same as above.Signed on 2003-11-19. Completion date: 2004-04-30.
$948,750, same as above.Signed on 2005-06-30. Completion date: 2006-04-03.
WESTERN UNIV OF HLTH SCIENCES (309 E 2ND ST) : $5,678,068 in 38 contractsfrom 1999 to 2006
Contracts for Tuition, Registration, and Membership Fees, Educational Services by Navy, Army Signed by year:2000: $365,153; 2001: $593,470; 2002: $1,198,810; 2003: $1,220,143; 2004: $821,175; 2005: $1,065,473; 2006: $374,594.
Biggest contracts:
$656,000 with Navy for Tuition, Registration, and Membership Fees. Signed on 2004-04-22. Completion date: 2005-06-30.
$605,808 with Army for Educational Services. Signed on 2003-10-01. Completion date: 2004-09-30.
$476,791 with Navy for Tuition, Registration, and Membership Fees. Signed on 2002-04-19. Completion date: 2003-06-15.
$396,340, same as above.Signed on 2001-04-24. Completion date: 2001-07-03.
INTERSTATE BRANDS CORPORATION (2801 S TOWNE AVE) : $3,069,785 in 71 contractsfrom 2001 to 2006
Contracts for Food Items For Resale, Bakery and Cereal Products, Food, Oils and Fats, Food Services by Defense Commissary Agency, Defense Logistics Agency, Bureau of Prisoners/Federal Prison System, Bureau of Immigration and Customs Enforcement, and others Signed by year:2000: $0; 2001: $0; 2002: $0; 2003: $0; 2004: $647,031; 2005: $1,577,638; 2006: $845,116.
Biggest contracts:
$663,417 with Defense Commissary Agency for Food Items For Resale. Signed on 2006-01-01. Completion date: 2006-03-31.
$602,455, same as above.Signed on 2005-04-01. Completion date: 2005-08-31.
$535,573, same as above.Signed on 2004-10-01. Completion date: 2005-02-28.
$326,914, same as above.Signed on 2005-10-01. Completion date: 2005-12-31.
CONSLEY & MONTIGNY INC (10982 PIPELINE AVE; small business) : $1,497,620 in 24 contractsfrom 2000 to 2006
Contracts for Maintenance, Repair or Alteration of Real Property -- Airport Runways by Air Force, Navy Signed by year:2000: $326,581; 2001: $105,449; 2002: $393,672; 2003: $260,896; 2004: $152,913; 2005: $210,142; 2006: $47,967.
Biggest contracts:
$200,910 with Air Force for Maintenance, Repair or Alteration of Real Property -- Airport Runways. Signed on 2005-07-11. Completion date: 2006-03-30.
$187,681, same as above.Signed on 2002-07-10. Completion date: 2002-09-30.
$173,255, same as above.Signed on 2000-02-23. Completion date: 2000-06-12.
$135,991, same as above.Signed on 2002-03-21. Completion date: 2002-10-21.
TDY INDUSTRIES INC (4200 W VALLEY BLVD)
$258,117 with Defense Logistics Agency for Airframe Structural Components. Signed on 2000-12-21. Completion date: 2001-05-15.
SPRAY SYSTEMS, INC (1363 EAST GRAND AVENUE; small business) : $168,358 in 3 contractsin 2003
$98,400 with U.S. Coast Guard for Prefabricated and Portable Buildings. Taking place in AK. Signed on 2003-09-15. Completion date: 2003-09-15.
$52,284 with Air Force for Manual Presses. Signed on 2003-09-29. Completion date: 2003-10-31.
$17,674 with U.S. Coast Guard for Prefabricated and Portable Buildings. Taking place in AK. Signed on 2003-09-15. Completion date: 2003-09-15.
ROCKWELL COLLINS, INC. (2001 W MISSION BLVD) : $97,065 in 4 contractsfrom 2003 to 2004
$34,561 with Army for Miscellaneous Aircraft Accessories and Components. Signed on 2003-04-03. Completion date: 2008-03-03.
$32,355, same as above.Signed on 2004-08-10. Completion date: 2008-03-03.
$30,149, same as above.Signed on 2003-09-22. Completion date: 2008-03-03.
$0, same as above.Signed on 2003-03-19. Completion date: 2008-03-03.
FURNO CO INC (168 SAN LORENZO ST; small business) : $29,600 in 2 contractsfrom 2001 to 2005
$26,000 with Defense Logistics Agency for Underwater Sound Equipment. Signed on 2001-01-12. Completion date: 2001-02-11.
$3,600 with Air Force for Sets, Kits, and Outfits of Measuring Tools. Signed on 2005-09-30. Completion date: 2006-02-28.
Top industries in this zip code by the number of employees in 2005:
2005 - 2018 National Fire Incident Reporting System (NFIRS) incidents
According to the data from the years 2005 - 2018 the average number of fires per year is 13. The highest number of fires - 49 took place in 2010, and the least - 3 in 2014. The data has an increasing trend.
When looking into fire subcategories, the most incidents belonged to: Outside Fires (34.0%), and Structure Fires (33.5%).
Fire incident types reported to NFIRS in Zip Code 91766
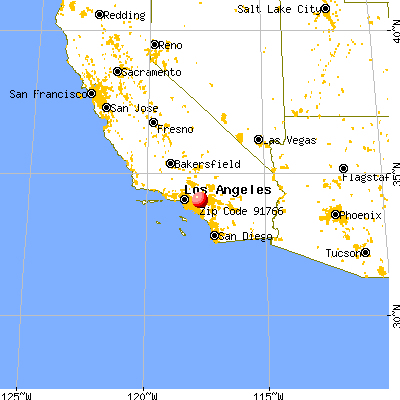


 Nearest zip codes: 91768, 91767, 91763, 91709, 91710, 91762.


 According to the data from the years 2005 - 2018 the average number of fires per year is 13. The highest number of fires - 49 took place in 2010, and the least - 3 in 2014. The data has an increasing trend.
 When looking into fire subcategories, the most incidents belonged to: Outside Fires (34.0%), and Structure Fires (33.5%).