Estimated zip code population in 2022: 37,385 Zip code population in 2010: 36,375 Zip code population in 2000: 34,437
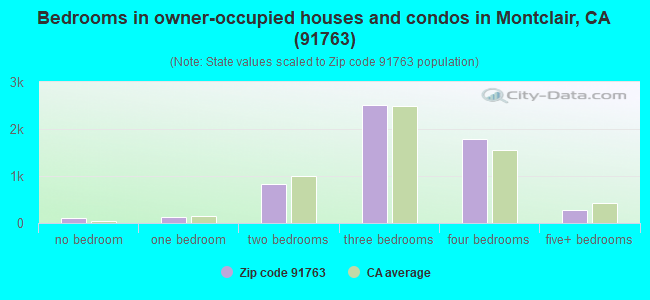
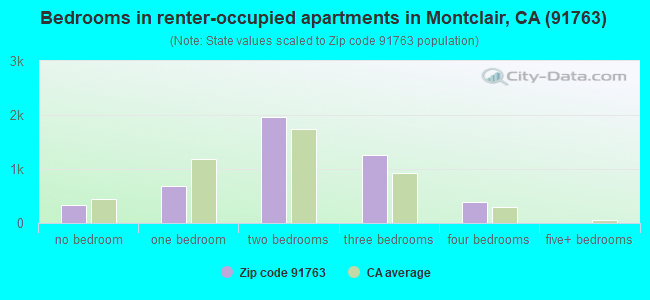
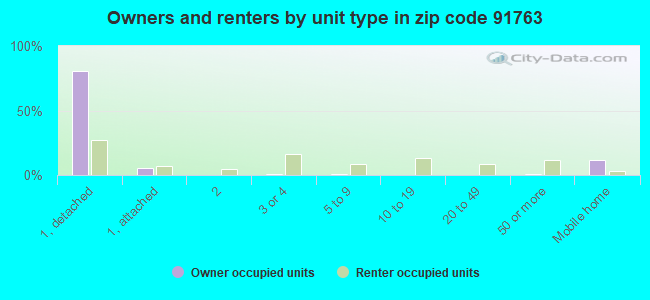
Houses and condos: 10,461 Renter-occupied apartments: 4,638
% of renters here:
45%
State:
44%
March 2022 cost of living index in zip code 91763: 82.9 (low, U.S. average is 100)
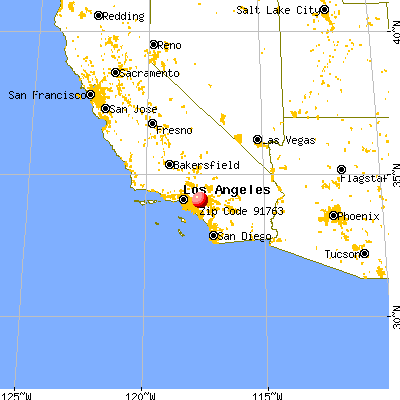
Land area: 5.2 sq. mi. Water area: 0.0 sq. mi.
Population density: 7,230 people per square mile
(high).
OSM Map
General Map
Google Map
MSN Map
OSM Map
General Map
Google Map
MSN Map
OSM Map
General Map
Google Map
MSN Map
OSM Map
General Map
Google Map
MSN Map
Please wait while loading the map...
Real estate property taxes paid for housing units in 2022:
This zip code:
0.5% ($2,722)
California:
0.7% ($4,831)
Median real estate property taxes paid for housing units with mortgages in 2022: $3,064 (0.5%) Median real estate property taxes paid for housing units with no mortgage in 2022: $1,752 (0.4%)
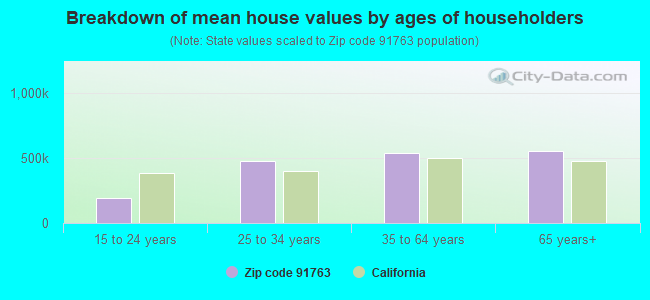
Estimated median house/condo value in 2022: $526,528
91763:
$526,528
California:
$715,900
According to our research of California and other state lists, there were 51 registered sex offenders living in 91763 zip code as of April 27, 2024. The ratio of all residents to sex offenders in zip code 91763 is 752 to 1. The ratio of registered sex offenders to all residents in this zip code is near the state average.
Median resident age:
This zip code:
33.2 years
California median age:
37.9 years
Average household size:
This zip code:
3.6 people
California:
2.8 people
Averages for the 2020 tax year for zip code 91763, filed in 2021:
Average Adjusted Gross Income (AGI) in 2020: $48,545 (Individual Income Tax Returns)
Here:
$48,545
State:
$95,910
Salary/wage: $43,456 (reported on 85.4% of returns)
Here:
$43,456
State:
$77,331
(% of AGI for various income ranges: 1245.6% for AGIs below $25k, 3996.9% for AGIs $25k-50k, 7638.7% for AGIs $50k-75k, 11201.5% for AGIs $75k-100k, 19756.6% for AGIs $100k-200k, 83937.5% for AGIs over 200k)
Taxable interest for individuals: $524 (reported on 22.0% of returns)
This zip code:
$524
California:
$2,294
(% of AGI for various income ranges: 5.9% for AGIs below $25k, 6.0% for AGIs $25k-50k, 15.1% for AGIs $50k-75k, 17.3% for AGIs $75k-100k, 66.2% for AGIs $100k-200k, 1457.5% for AGIs over 200k)
Ordinary dividends: $2,190 (reported on 5.9% of returns)
Here:
$2,190
State:
$10,949
(% of AGI for various income ranges: 4.2% for AGIs below $25k, 3.9% for AGIs $25k-50k, 16.3% for AGIs $50k-75k, 17.7% for AGIs $75k-100k, 57.1% for AGIs $100k-200k, 2702.5% for AGIs over 200k)
Net capital gain/loss in AGI: +$4,280 (reported on 7.1% of returns)
Here:
+$4,280
State:
+$49,306
(% of AGI for various income ranges: 1.0% for AGIs below $25k, 4.6% for AGIs $25k-50k, 25.5% for AGIs $50k-75k, 60.9% for AGIs $75k-100k, 165.9% for AGIs $100k-200k, 7355.0% for AGIs over 200k)
Profit/loss from business: +$8,319 (reported on 16.8% of returns)
Here:
+$8,319
State:
+$15,671
(% of AGI for various income ranges: 199.2% for AGIs below $25k, 164.4% for AGIs $25k-50k, 184.9% for AGIs $50k-75k, 263.6% for AGIs $75k-100k, 228.5% for AGIs $100k-200k, 3307.5% for AGIs over 200k)
Taxable individual retirement arrangement distribution: $14,298 (reported on 2.9% of returns)
91763:
$14,298
California:
$23,505
(% of AGI for various income ranges: 21.5% for AGIs below $25k, 30.4% for AGIs $25k-50k, 57.7% for AGIs $50k-75k, 128.5% for AGIs $75k-100k, 369.0% for AGIs $100k-200k)
Total itemized deductions: $27,522 (reported on 9.2% of returns)
Here:
$27,522
State:
$39,517
(% of AGI for various income ranges: 32.9% for AGIs below $25k, 134.8% for AGIs $25k-50k, 510.2% for AGIs $50k-75k, 981.4% for AGIs $75k-100k, 1854.3% for AGIs $100k-200k, 11682.5% for AGIs over 200k)
Charity contributions: $5,045 (reported on 7.7% of returns)
Here:
$5,045
State:
$12,598
(% of AGI for various income ranges: 1.7% for AGIs below $25k, 16.9% for AGIs $25k-50k, 63.5% for AGIs $50k-75k, 141.6% for AGIs $75k-100k, 312.0% for AGIs $100k-200k, 2965.0% for AGIs over 200k)
Taxes paid: $8,052 (reported on 9.2% of returns)
91763:
$8,052
State:
$8,807
(% of AGI for various income ranges: 7.0% for AGIs below $25k, 34.1% for AGIs $25k-50k, 148.6% for AGIs $50k-75k, 308.7% for AGIs $75k-100k, 596.0% for AGIs $100k-200k, 2690.0% for AGIs over 200k)
Earned income credit: $2,081 (reported on 20.9% of returns)
Here:
$2,081
State:
$2,074
(% of AGI for various income ranges: 101.1% for AGIs below $25k, 75.5% for AGIs $25k-50k, 1.3% for AGIs $50k-75k)
Percentage of individuals using paid preparers for their 2020 taxes: 92.0%
Here:
92%
State:
92%
(% for various income ranges: 90.4% for AGIs below $25k, 92.7% for AGIs $25k-50k, 93.0% for AGIs $50k-75k, 93.8% for AGIs $75k-100k, 92.9% for AGIs $100k-200k, 94.4% for AGIs over 200k)
Averages for the 2012 tax year for zip code 91763, filed in 2013:
Average Adjusted Gross Income (AGI) in 2012: $36,240 (Individual Income Tax Returns)
Here:
$36,240
State:
$72,726
Salary/wage: $34,694 (reported on 86.4% of returns)
Here:
$34,694
State:
$59,079
(% of AGI for various income ranges: 77.2% for AGIs below $25k, 86.9% for AGIs $25k-50k, 87.9% for AGIs $50k-75k, 85.8% for AGIs $75k-100k, 83.3% for AGIs $100k-200k, 36.3% for AGIs over 200k)
Taxable interest for individuals: $484 (reported on 22.5% of returns)
This zip code:
$484
California:
$2,146
(% of AGI for various income ranges: 0.3% for AGIs below $25k, 0.2% for AGIs $25k-50k, 0.2% for AGIs $50k-75k, 0.4% for AGIs $75k-100k, 0.4% for AGIs $100k-200k, 1.1% for AGIs over 200k)
Ordinary dividends: $1,689 (reported on 5.1% of returns)
Here:
$1,689
State:
$9,308
(% of AGI for various income ranges: 0.2% for AGIs below $25k, 0.1% for AGIs $25k-50k, 0.2% for AGIs $50k-75k, 0.1% for AGIs $75k-100k, 0.6% for AGIs $100k-200k, 0.2% for AGIs over 200k)
Net capital gain/loss in AGI: +$5,706 (reported on 4.0% of returns)
Here:
+$5,706
State:
+$30,460
(% of AGI for various income ranges: 0.4% for AGIs $100k-200k, 15.7% for AGIs over 200k)
Profit/loss from business: +$9,309 (reported on 16.4% of returns)
Here:
+$9,309
State:
+$17,064
(% of AGI for various income ranges: 13.2% for AGIs below $25k, 4.1% for AGIs $25k-50k, 1.3% for AGIs $50k-75k, 1.0% for AGIs $75k-100k, 1.7% for AGIs $100k-200k)
Taxable individual retirement arrangement distribution: $11,152 (reported on 3.6% of returns)
91763:
$11,152
California:
$19,557
(% of AGI for various income ranges: 1.0% for AGIs below $25k, 0.8% for AGIs $25k-50k, 1.1% for AGIs $50k-75k, 1.3% for AGIs $75k-100k, 1.9% for AGIs $100k-200k)
Total itemized deductions: $20,979 (31% of AGI, reported on 26.4% of returns)
Here:
$20,979
State:
$34,004
Here:
30.7% of AGI
State:
22.7% of AGI
(% of AGI for various income ranges: 6.7% for AGIs below $25k, 12.4% for AGIs $25k-50k, 18.6% for AGIs $50k-75k, 20.1% for AGIs $75k-100k, 20.6% for AGIs $100k-200k, 18.3% for AGIs over 200k)
Charity contributions: $2,480 (reported on 21.3% of returns)
Here:
$2,480
State:
$4,659
(% of AGI for various income ranges: 0.4% for AGIs below $25k, 1.1% for AGIs $25k-50k, 1.7% for AGIs $50k-75k, 1.9% for AGIs $75k-100k, 2.4% for AGIs $100k-200k, 2.3% for AGIs over 200k)
Taxes paid: $5,457 (reported on 26.4% of returns)
91763:
$5,457
State:
$14,448
(% of AGI for various income ranges: 1.2% for AGIs below $25k, 2.4% for AGIs $25k-50k, 4.4% for AGIs $50k-75k, 5.4% for AGIs $75k-100k, 6.6% for AGIs $100k-200k, 9.4% for AGIs over 200k)
Earned income credit: $2,544 (reported on 28.3% of returns)
Here:
$2,544
State:
$2,286
(% of AGI for various income ranges: 8.5% for AGIs below $25k, 1.6% for AGIs $25k-50k)
Percentage of individuals using paid preparers for their 2012 taxes: 74.2%
Here:
74%
State:
64%
(% for various income ranges: 72.9% for AGIs below $25k, 74.9% for AGIs $25k-50k, 75.9% for AGIs $50k-75k, 75.6% for AGIs $75k-100k, 77.1% for AGIs $100k-200k, 80.0% for AGIs over 200k)
Averages for the 2004 tax year for zip code 91763, filed in 2005:
Average Adjusted Gross Income (AGI) in 2004: $32,649 (Individual Income Tax Returns)
Here:
$32,649
State:
$58,600
Salary/wage: $31,857 (reported on 89.2% of returns)
Here:
$31,857
State:
$49,455
(% of AGI for various income ranges: 89.5% for AGIs below $10k, 84.9% for AGIs $10k-25k, 90.0% for AGIs $25k-50k, 89.8% for AGIs $50k-75k, 90.2% for AGIs $75k-100k, 72.6% for AGIs over 100k)
Taxable interest for individuals: $748 (reported on 28.9% of returns)
This zip code:
$748
California:
$2,365
(% of AGI for various income ranges: 1.8% for AGIs below $10k, 0.6% for AGIs $10k-25k, 0.4% for AGIs $25k-50k, 0.5% for AGIs $50k-75k, 0.8% for AGIs $75k-100k, 1.4% for AGIs over 100k)
Taxable dividends: $1,186 (reported on 7.7% of returns)
Here:
$1,186
State:
$4,746
(% of AGI for various income ranges: 0.8% for AGIs below $10k, 0.3% for AGIs $10k-25k, 0.2% for AGIs $25k-50k, 0.3% for AGIs $50k-75k, 0.3% for AGIs $75k-100k, 0.3% for AGIs over 100k)
Net capital gain/loss: +$7,706 (reported on 5.7% of returns)
Here:
+$7,706
State:
+$23,418
(% of AGI for various income ranges: -0.5% for AGIs below $10k, -0.1% for AGIs $10k-25k, 0.2% for AGIs $25k-50k, 0.4% for AGIs $50k-75k, 1.1% for AGIs $75k-100k, 9.4% for AGIs over 100k)
Profit/loss from business: +$8,163 (reported on 14.7% of returns)
Here:
+$8,163
State:
+$16,826
(% of AGI for various income ranges: 10.5% for AGIs below $10k, 7.2% for AGIs $10k-25k, 3.2% for AGIs $25k-50k, 2.3% for AGIs $50k-75k, 0.9% for AGIs $75k-100k, 4.0% for AGIs over 100k)
IRA payment deduction: $2,566 (reported on 1.3% of returns)
91763:
$2,566
California:
$3,192
(% of AGI for various income ranges: 0.1% for AGIs $10k-25k, 0.1% for AGIs $25k-50k, 0.1% for AGIs $50k-75k, 0.1% for AGIs $75k-100k, 0.1% for AGIs over 100k)
Self-employed pension: $12,714 (reported on 0.1% of returns)
Here:
$12,714
California:
$17,688
Total itemized deductions: $18,594 (34% of AGI, reported on 33.2% of returns)
Here:
$18,594
State:
$28,113
Here:
33.8% of AGI
State:
25.3% of AGI
(% of AGI for various income ranges: 9.2% for AGIs below $10k, 9.5% for AGIs $10k-25k, 19.0% for AGIs $25k-50k, 23.6% for AGIs $50k-75k, 23.3% for AGIs $75k-100k, 20.6% for AGIs over 100k)
Charity contributions deductions: $2,255 (4% of AGI, reported on 29.1% of returns)
Here:
$2,255
State:
$3,923
Here:
4.0% of AGI
State:
3.3% of AGI
(% of AGI for various income ranges: 0.4% for AGIs below $10k, 0.7% for AGIs $10k-25k, 1.8% for AGIs $25k-50k, 2.5% for AGIs $50k-75k, 2.8% for AGIs $75k-100k, 2.9% for AGIs over 100k)
Total tax: $3,295 (reported on 64.4% of returns)
91763:
$3,295
State:
$10,761
(% of AGI for various income ranges: 3.0% for AGIs below $10k, 3.4% for AGIs $10k-25k, 4.8% for AGIs $25k-50k, 6.9% for AGIs $50k-75k, 8.6% for AGIs $75k-100k, 13.4% for AGIs over 100k)
Earned income credit: $1,905 (reported on 25.0% of returns)
Here:
$1,905
State:
$1,763
Percentage of individuals using paid preparers for their 2004 taxes: 75.4%
Here:
75%
State:
66%
(% for various income ranges: 66.4% for AGIs below $10k, 76.8% for AGIs $10k-25k, 77.4% for AGIs $25k-50k, 76.6% for AGIs $50k-75k, 79.9% for AGIs $75k-100k, 79.3% for AGIs over 100k)
Likely homosexual households (counted as self-reported same-sex unmarried-partner households)
Lesbian couples: 0.0% of all households
Gay men: 0.1% of all households
Household received Food Stamps/SNAP in the past 12 months: 1,834 Household did not receive Food Stamps/SNAP in the past 12 months: 8,551
Women who had a birth in the past 12 months: 540 (404 now married, 135 unmarried) Women who did not have a birth in the past 12 months: 9,690 (3,280 now married, 6,433 unmarried)
Housing units in zip code 91763 with a mortgage: 3,741 (250 second mortgage, 7 home equity loan, 178 both second mortgage and home equity loan) Houses without a mortgage: 29
Median monthly owner costs for units with a mortgage: $2,120 Median monthly owner costs for units without a mortgage: $491
Residents with income below the poverty level in 2022:
This zip code:
15.0%
Whole state:
12.2%
Residents with income below 50% of the poverty level in 2022:
This zip code:
6.8%
Whole state:
6.2%
Median number of rooms in houses and condos:
Here:
5.9
State:
6.0
Median number of rooms in apartments:
Here:
4.4
State:
3.9
Notable locations in this zip code not listed on our city pages
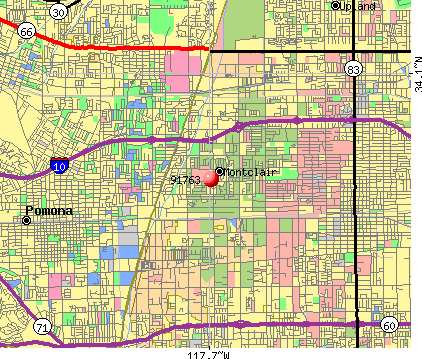
Notable locations in zip code 91763: Mission Tiki Drive-In Theatre (A), Montclair City Hall (B), Montclair Branch San Bernardino County Library (C), Montclair Fire Department Station 1 (D). Display/hide their locations on the map
Shopping Centers: Ramona Town Center Shopping Center (1), Montclair Towne Square Shopping Center (2), Montclair Plaza Shopping Center (3), Montclair Village Square Shopping Center (4), Montclair Village Shopping Center (5), Montclair Entertainment Plaza Shopping Center (6), Montclair East Shopping Center (7), Montclair Central Shopping Center (8), Montclair Center Shopping Center (9). Display/hide their locations on the map
Churches in zip code 91763 include: Bethany Baptist Church (A), Church of Christ of Montclair (B), First United Methodist Church (C), Love Sanctuary Church of God in Christ (D), Our Lady of Lourdes Catholic Church (E), Trinity Lutheran Church (F), Unitarian Society of Pomona Valley (G), Church of God of Montclair (H), First Assembly of God Church of Montclair (I). Display/hide their locations on the map
Parks in zip code 91763 include: Hoffman Park (1), John F Kennedy Park (2), MacArthur Park (3), Sunset Park (4), Golden Girls Softball Field (5), Kingsley Park (6), Saratoga Park (7), Sunrise Park (8), Essex Park (9). Display/hide their locations on the map
4,446 married couples with children.
3,043 single-parent households (789 men, 2,254 women).
39.5% of residents of 91763 zip code speak English at home.
48.9% of residents speak Spanish at home (61% very well, 19% well, 14% not well, 7% not at all).
0.9% of residents speak other Indo-European language at home (81% very well, 17% well, 2% not well).
9.7% of residents speak Asian or Pacific Island language at home (46% very well, 24% well, 23% not well, 7% not at all).
0.8% of residents speak other language at home (63% very well, 20% well, 15% not well, 2% not at all).
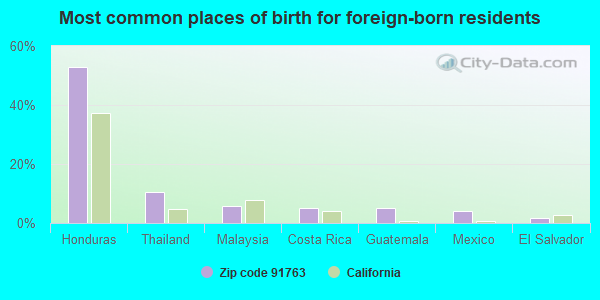
Foreign born population: 12,044 (32.2%) (54.7% of them are naturalized citizens)
This zip code:
32.2%
Whole state:
26.7%
53%Honduras
11%Thailand
6%Malaysia
5%Costa Rica
5%Guatemala
4%Mexico
2%El Salvador
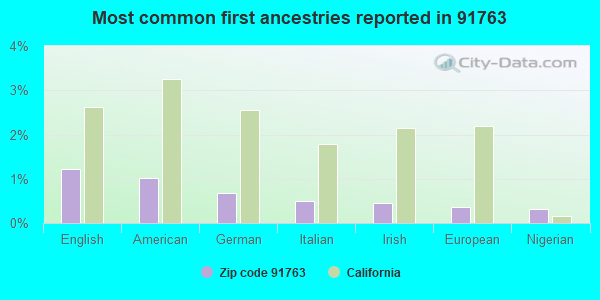
1%English
1%American
1%German
0%Italian
0%Irish
0%European
0%Nigerian
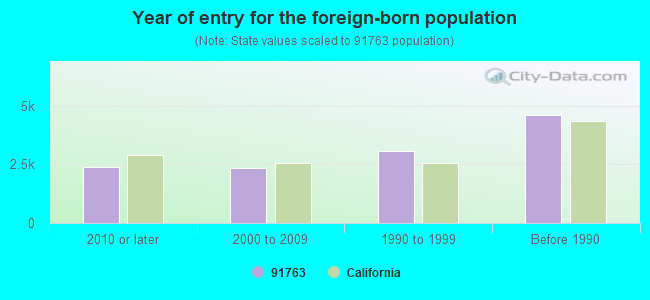
Year of entry for the foreign-born population
2,3762010 or later
2,3552000 to 2009
3,0511990 to 1999
4,599Before 1990
Major facilities with environmental interests located in this zip code:
GREAT METRO AUTOGROUP DBA METRO ACURA (9377 AUTOPLEX DR in MONTCLAIR, CA) . Federal Facility
STATE MASTER (California - Hazardous Waste Tracking) - HAZARDOU WASTE PROGRAM CRITERIA AND HAZARDOUS AIR POLLUTANT INVENTORY (Inventory of air pollution sources) Small Quantity Generators, between 100 kg and 1000 kg of hazardous waste/month (Resource Conservation and Recovery Act (tracking hazardous waste)) Small Quantity Generators, between 100 kg and 1000 kg of hazardous waste/month (Resource Conservation and Recovery Act (tracking hazardous waste)) Small Quantity Generators, between 100 kg and 1000 kg of hazardous waste/month (Resource Conservation and Recovery Act (tracking hazardous waste)) - notification Business SIC classification: MOTOR VEHICLE DEALERS (NEW AND USED) Organizations: JIM LUKENS (CONTACT/OWNER)
Alternative names: METRO HONDA, METRO NISSAN, POMONA VALLEY IMPORTS DBA METRO HONDA, POMONA VALLEY IMPORTS DBA METRO MOTORS
ACCURATE AUTOMOTIVE (8939 ROSE AVE in MONTCLAIR, CA)
STATE MASTER (California - Hazardous Waste Tracking) - HAZARDOU WASTE PROGRAM Small Quantity Generators, between 100 kg and 1000 kg of hazardous waste/month (Resource Conservation and Recovery Act (tracking hazardous waste)) - notification STATE MASTER (California - Used Oil Recycling System ) - USED OIL RECYCLING Business NAICS classification: GENERAL AUTOMOTIVE REPAIR. Organizations: MARIO CANAS (CONTACT/OWNER)
INDUSTRIAL WASTE UTILIZATION (5601 STATE ST in MONTCLAIR, CA)
STATE MASTER (California - Hazardous Waste Tracking) - HAZARDOU WASTE PROGRAM COMPLIANCE ACTIVITY (Tracking inspections of insecticide, fungicide, and rodenticide, and toxic substances) National Pollutant Discharge Elimination System NON-MAJOR (Tracking pollutant discharge elimination systems) - permit TRANSPORTER (Resource Conservation and Recovery Act (tracking hazardous waste)) - notification TSD (Resource Conservation and Recovery Act (tracking hazardous waste)) - notification Business SIC classification: LOCAL TRUCKING WITH STORAGE Alternative names: STORM,MONTCLAIR
LARRY CARBURETOR SHOP (5834 HOLT BLVD #14 in MONTCLAIR, CA)
STATE MASTER (California - Hazardous Waste Tracking) - HAZARDOU WASTE PROGRAM Small Quantity Generators, between 100 kg and 1000 kg of hazardous waste/month (Resource Conservation and Recovery Act (tracking hazardous waste)) - notification Business NAICS classification: OTHER AUTOMOTIVE MECHANICAL AND ELECTRICAL REPAIR AND MAINTENANCE. Organizations: LARRY YEPES (CONTACT/OWNER)
CALMAT CO CLAREMONT (4711 HUNTINGTON DR in MONTCLAIR, CA)
STATE MASTER (California - Hazardous Waste Tracking) - HAZARDOU WASTE PROGRAM CRITERIA AND HAZARDOUS AIR POLLUTANT INVENTORY (Inventory of air pollution sources) Small Quantity Generators, between 100 kg and 1000 kg of hazardous waste/month (Resource Conservation and Recovery Act (tracking hazardous waste)) - notification Business SIC classification: ASPHALT PAVING MIXTURES AND BLOCKS
CHAFFEY JOINT UNION HIGH SCHOO (4725 BENITO ST. in MONTCLAIR, CA)
(National Center for Education Statistics) - STATE ID-3633906 CRITERIA AND HAZARDOUS AIR POLLUTANT INVENTORY (Inventory of air pollution sources) Business SIC classification: ELEMENTARY AND SECONDARY SCHOOLS
MC DANIEL INC (10807 MONTE VISTA in MONTCLAIR, CA)
STATE MASTER (California - Hazardous Waste Tracking) - HAZARDOU WASTE PROGRAM Small Quantity Generators, between 100 kg and 1000 kg of hazardous waste/month (Resource Conservation and Recovery Act (tracking hazardous waste)) - notification
CAMINO REAL CLEANERS (5637 ARROW HWY UNIT L in MONTCLAIR, CA)
STATE MASTER (California - Hazardous Waste Tracking) - HAZARDOU WASTE PROGRAM Small Quantity Generators, between 100 kg and 1000 kg of hazardous waste/month (Resource Conservation and Recovery Act (tracking hazardous waste)) - notification Organizations: KAILASH CHANDNANI (CONTACT/OWNER)
MORENO ELEMENTARY (4825 MORENO ST. in MONTCLAIR, CA)
(National Center for Education Statistics) - STATE ID-6036370 Organizations: ONTARIO-MONTCLAIR ELEMENTARY (SCHOOL DISTRICT)
MONTE VISTA ELEMENTARY (4900 ORCHARD AVE. in MONTCLAIR, CA)
(National Center for Education Statistics) - STATE ID-6036362 Organizations: ONTARIO-MONTCLAIR ELEMENTARY (SCHOOL DISTRICT)
LEHIGH ELEMENTARY (10200 LEHIGH ST. in MONTCLAIR, CA)
(National Center for Education Statistics) - STATE ID-6036305 Organizations: ONTARIO-MONTCLAIR ELEMENTARY (SCHOOL DISTRICT)
KINGSLEY ELEMENTARY (5625 KINGSLEY ST. in MONTCLAIR, CA)
(National Center for Education Statistics) - STATE ID-6036297 Organizations: ONTARIO-MONTCLAIR ELEMENTARY (SCHOOL DISTRICT)
MAACO AUTO PAINTING & BODY WORKS (5438 HOLT BLVD in MONTCLAIR, CA)
CRITERIA AND HAZARDOUS AIR POLLUTANT INVENTORY (Inventory of air pollution sources) (Resource Conservation and Recovery Act (tracking hazardous waste)) Business SIC classification: TOP, BODY, AND UPHOLSTERY REPAIR SHOPS AND PAINT SHOPS Business NAICS classification: AUTOMOTIVE BODY, PAINT, AND INTERIOR REPAIR AND MAINTENANCE. Organizations: FELIX L LUNA (CONTACT/OWNER)
Housing units lacking complete plumbing facilities: 0.5% Housing units lacking complete kitchen facilities: 1.7%
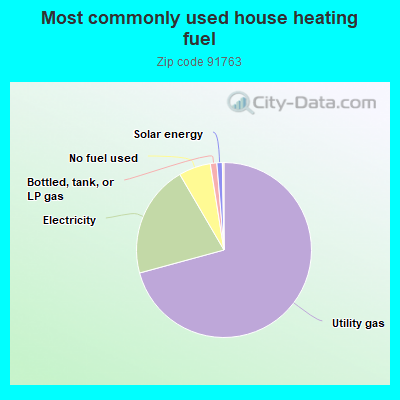
70.7%Utility gas
20.8%Electricity
5.9%No fuel used
1.2%Bottled, tank, or LP gas
1.0%Solar energy
Population in 1990: 25,862. Population change in the 1990s: +8,575 (+33.2%).
Place of birth for U.S.-born residents:
This state: 22,484
Northeast: 475
Midwest: 786
South: 768
West: 504
56% of the 91763 zip code residents lived in the same house 5 years ago. Out of people who lived in different houses, 48% lived in this county. Out of people who lived in different counties, 50% lived in California.
93% of the 91763 zip code residents lived in the same house 1 year ago. Out of people who lived in different houses, 38% moved from this county. Out of people who lived in different houses, 55% moved from different county within same state. Out of people who lived in different houses, 9% moved from different state. Out of people who lived in different houses, 1% moved from abroad.
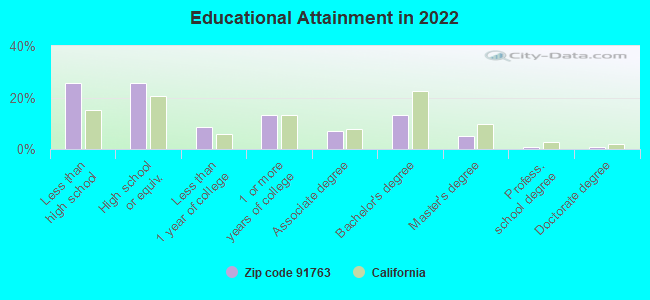
Private vs. public school enrollment:
Students in private schools in grades 1 to 8 (elementary and middle school): 76
Here:
2.0%
California:
10.5%
Students in private schools in grades 9 to 12 (high school): 45
Here:
1.6%
California:
8.5%
Students in private undergraduate colleges: 628
Here:
19.8%
California:
15.9%
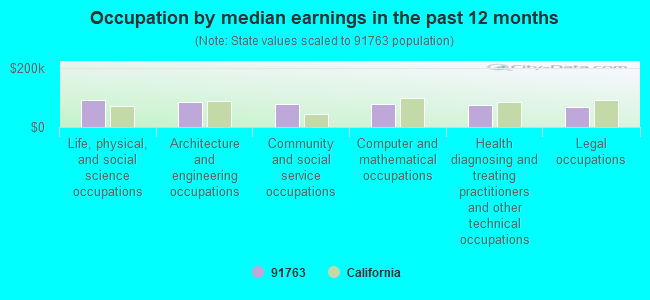
Occupation by median earnings in the past 12 months ($)
91,371Life, physical, and social science occupations
85,920Architecture and engineering occupations
78,532Community and social service occupations
77,720Computer and mathematical occupations
73,365Health diagnosing and treating practitioners and other technical occupations
68,564Legal occupations
Companies with biggest federal contracts located in this zip code (MONTCLAIR, CA):
ACEPEX MANAGEMENT CORP (10643 MILLS AVE; small business) : $1,520,014,399 in 603 contractsfrom 1999 to 2006
Contracts for Custodial Janitorial Services, Operation of Government-Owned Facilities -- Family Housing Facilities, Maintenance, Repair and Rebuilding of Equipment -- Refrigeration, Air Conditioning, and Air Circulating Equipment, Operation of Government-Owned Facilities -- Other Hospital Buildings, and moreby Public Buildings Service, U.S. Coast Guard, Navy, Army, and others Signed by year:2000: $3,675,147; 2001: $12,451,097; 2002: $1,471,019,888; 2003: $8,190,673; 2004: $11,076,411; 2005: $5,289,876; 2006: $7,391,705.
Biggest contracts:
$1,458,283,000 with Public Buildings Service for Custodial Janitorial Services. Taking place in CO. Signed on 2002-09-15. Completion date: 2004-09-15.
$4,918,906 with U.S. Coast Guard for Operation of Government-Owned Facilities -- Family Housing Facilities. Signed on 2006-08-02. Completion date: 2001-11-09.
$2,913,990 with Navy for Custodial Janitorial Services. Signed on 2000-10-01. Completion date: 2001-09-30.
$2,581,844, same as above.Signed on 2002-12-05. Completion date: 2003-09-30.
BIG E CONSTRUCTION, INC (4460 BROOKS STREET, UNIT D; small business) : $2,174,360 in 12 contractsfrom 2004 to 2006
Contracts for Construction of Structures and Facilities -- Miscellaneous Buildings, Construction of Structures and Facilities -- Other Non-Building Facilities, Maintenance, Repair or Alteration of Real Property -- Other Non-Building Facilities, Maintenance, Repair or Alteration of Real Property -- Ammunition Storage Buildings, and moreby Navy, National Park Service Signed by year:2000: $0; 2001: $0; 2002: $0; 2003: $0; 2004: $225,603; 2005: $1,913,186; 2006: $35,571.
Biggest contracts:
$700,000 with Navy for Construction of Structures and Facilities -- Miscellaneous Buildings. Signed on 2005-09-29. Completion date: 2006-11-05.
$661,000 with Navy for Construction of Structures and Facilities -- Other Non-Building Facilities. Signed on 2005-05-25. Completion date: 2005-11-07.
$297,286 with Navy for Maintenance, Repair or Alteration of Real Property -- Other Non-Building Facilities. Signed on 2005-09-26. Completion date: 2006-04-10.
$160,900, same as above.Signed on 2005-06-23. Completion date: 2005-09-30.
INTERNATIONAL RITE-WAY PDTS,LL (5536 OLIVE ST; small business) : $1,249,119 in 66 contractsfrom 2000 to 2006
Contracts for Airframe Structural Components, Aircraft Hydraulic, Vacuum, and De-icing System Components, Miscellaneous Aircraft Accessories and Components by Defense Logistics Agency, Air Force Signed by year:2000: $150,975; 2001: $295,584; 2002: $133,374; 2003: $77,427; 2004: $198,229; 2005: $289,011; 2006: $104,519.
Biggest contracts:
$150,975 with Defense Logistics Agency for Airframe Structural Components. Signed on 2000-04-06. Completion date: 2000-07-15.
$99,999, same as above.Signed on 2002-09-19. Completion date: 2003-03-18.
$98,000, same as above.Signed on 2001-09-28. Completion date: 2002-03-27.
$77,427, same as above.Signed on 2003-11-19. Completion date: 2004-03-23.
ENTERPRISE RENT-A-CAR, INC (5462) : $473,831 in 118 contractsfrom 2000 to 2006
Contracts for Lease or Rental of Equipment -- Ground Effect Vehicles, Motor Vehicles, Trailers, and Cycles, Transport Vessels-Passenger And Troop, Lease or Rental of Equipment -- Weapons, Lease or Rental of Equipment -- Vehicular Equipment Components, and moreby Navy, Army Signed by year:2000: $76,484; 2001: $115,222; 2002: $198,397; 2003: $44,669; 2004: $32,874; 2005: -$1,071; 2006: $7,256.
Biggest contracts:
$46,049 with Navy for Lease or Rental of Equipment -- Ground Effect Vehicles, Motor Vehicles, Trailers, and Cycles. Signed on 2000-07-13. Completion date: 2000-09-12.
$44,440 with Army for Lease or Rental of Equipment -- Ground Effect Vehicles, Motor Vehicles, Trailers, and Cycles. Signed on 2001-08-01. Completion date: 2001-09-15.
$41,959 with Army for Transport Vessels-Passenger And Troop. Signed on 2002-07-05. Completion date: 2002-08-16.
$39,024 with Army for Lease or Rental of Equipment -- Weapons. Signed on 2001-07-25. Completion date: 2001-09-30.
INDUSTRIAL WASTE UTILIZATION I (5601 STATE ST; small business) : $197,798 in 16 contractsfrom 2002 to 2005
Contracts for Maintenance, Repair or Alteration of Real Property -- Other Industrial Buildings, Purchase of Structures and Facilities -- Waste Treatment and Storage Facilities, Hazardous Substance Removal, Cleanup, and Disposal Services and Operational Support by U.S. Coast Guard, United States Coast Guard (disused code: now 7008), American Forces Information Service, Defense Logistics Agency, and others Signed by year:2000: $0; 2001: $0; 2002: $100,000; 2003: $95,436; 2004: $0; 2005: $2,362; 2006: $0.
Biggest contracts:
$60,000 with U.S. Coast Guard for Maintenance, Repair or Alteration of Real Property -- Other Industrial Buildings. Signed on 2003-04-15. Completion date: 2003-05-15.
$50,000 with United States Coast Guard (disused code: now 7008) for Maintenance, Repair or Alteration of Real Property -- Other Industrial Buildings. Signed on 2002-10-15. Completion date: 2002-11-15.
$50,000, same as above.Signed on 2003-01-15. Completion date: 2003-02-15.
$50,000, same as above.Signed on 2002-08-15. Completion date: 2002-08-15.
KWIK-KLEEN (4125 STATE STREET; small business) : $101,083 in 3 contractsfrom 1999 to 2001
$59,158 with Navy for Lease or Rental of Equipment -- Service and Trade Equipment. Signed on 2001-01-30. Completion date: 2001-09-30.
$41,925, same as above.Signed on 1999-10-01. Completion date: 2000-09-30.
$0, same as above.Signed on 2001-01-30. Completion date: 2001-09-30.
ROBOTECH MANUFACTURING (10660 SILICON AVE UNIT C) : $79,086 in 5 contractsfrom 2004 to 2005
Contracts for Airframe Structural Components, Valves, Nonpowered by Defense Logistics Agency Signed by year:2000: $0; 2001: $0; 2002: $0; 2003: $0; 2004: $61,379; 2005: $17,707; 2006: $0.
Biggest contracts:
$43,595 with Defense Logistics Agency for Airframe Structural Components. Signed on 2004-06-25. Completion date: 2005-05-21.
$17,784, same as above.Signed on 2004-08-24. Completion date: 2005-08-29.
$14,355, same as above.Signed on 2005-05-16. Completion date: 2005-07-17.
$3,352 with Defense Logistics Agency for Valves, Nonpowered. Signed on 2005-03-05. Completion date: 2005-06-03.
TEDDER, HAMPTON ELECTRIC CO (4571 W STATE ST; small business) : $61,255 in 2 contractsin 2005
$58,280 with Air Force for Equipment and Materials Testing -- Electrical and Electronic Equipment Components. Signed on 2005-07-27. Completion date: 2005-09-27.
$2,975 with Bureau of Prisoners/Federal Prison System for Electrical Hardware and Supplies. Signed on 2005-03-09. Completion date: 2005-03-09.
CAL ORE LIMITED (4667 HOLT BLVD; small business) : $29,615 in 3 contractsfrom 2003 to 2004
$31,100 with Army for Miscellaneous Vehicular Components. Signed on 2003-09-13. Completion date: 2003-10-03.
-$285, same as above.Signed on 2004-02-11. Completion date: 2003-10-03.
-$1,200, same as above.Signed on 2004-01-08. Completion date: 2003-10-03.
OPEN ROAD RV, LLC (4252 MISSION BLVD; small business)
$9,000 with Navy for Passenger Motor Vehicles. Signed on 2005-09-02. Completion date: 2005-10-02.
Top industries in this zip code by the number of employees in 2005:
2005 - 2017 National Fire Incident Reporting System (NFIRS) incidents
According to the data from the years 2005 - 2017 the average number of fires per year is 77. The highest number of fires - 125 took place in 2008, and the least - 6 in 2017. The data has a decreasing trend.
When looking into fire subcategories, the most incidents belonged to: Outside Fires (40.6%), and Structure Fires (35.1%).
Fire incident types reported to NFIRS in Zip Code 91763


 Nearest zip codes: 91762, 91767, 91786, 91711, 91766, 91710.
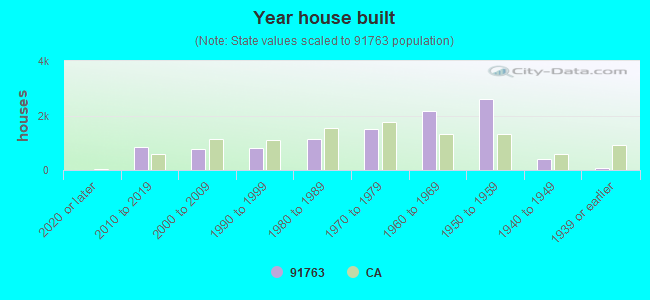


 . Federal Facility


 According to the data from the years 2005 - 2017 the average number of fires per year is 77. The highest number of fires - 125 took place in 2008, and the least - 6 in 2017. The data has a decreasing trend.
 When looking into fire subcategories, the most incidents belonged to: Outside Fires (40.6%), and Structure Fires (35.1%).