Estimated zip code population in 2022: 37,230 Zip code population in 2010: 35,705 Zip code population in 2000: 34,715
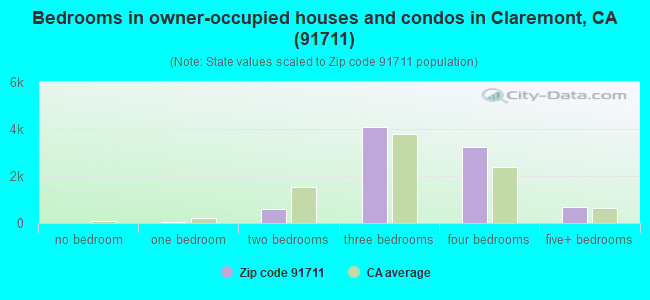
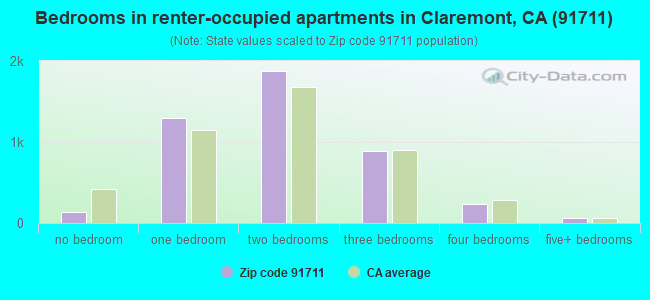
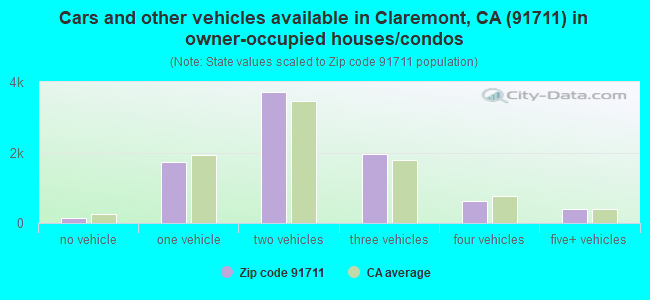
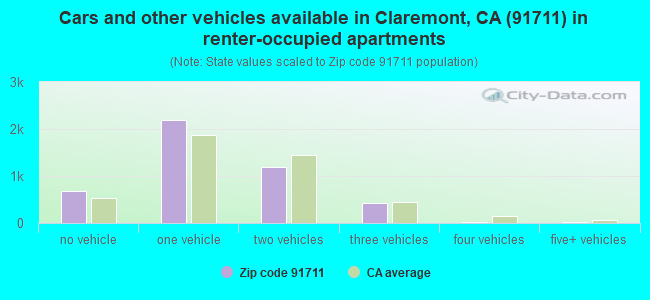
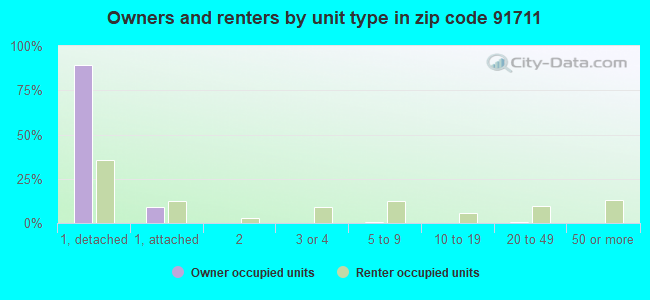
Houses and condos: 13,682 Renter-occupied apartments: 4,516
% of renters here:
34%
State:
44%
March 2022 cost of living index in zip code 91711: 134.0 (high, U.S. average is 100)
Land area: 15.0 sq. mi. Water area: 0.1 sq. mi.
Population density: 2,480 people per square mile
(low).
OSM Map
General Map
Google Map
MSN Map
OSM Map
General Map
Google Map
MSN Map
OSM Map
General Map
Google Map
MSN Map
OSM Map
General Map
Google Map
MSN Map
Please wait while loading the map...
Real estate property taxes paid for housing units in 2022:
This zip code:
0.6% ($5,540)
California:
0.7% ($4,831)
Median real estate property taxes paid for housing units with mortgages in 2022: $6,412 (0.7%) Median real estate property taxes paid for housing units with no mortgage in 2022: $4,066 (0.4%)
Estimated median house/condo value in 2022: $911,461
91711:
$911,461
California:
$715,900
According to our research of California and other state lists, there were 11 registered sex offenders living in 91711 zip code as of April 27, 2024. The ratio of all residents to sex offenders in zip code 91711 is 3,408 to 1. The ratio of registered sex offenders to all residents in this zip code is much lower than the state average.
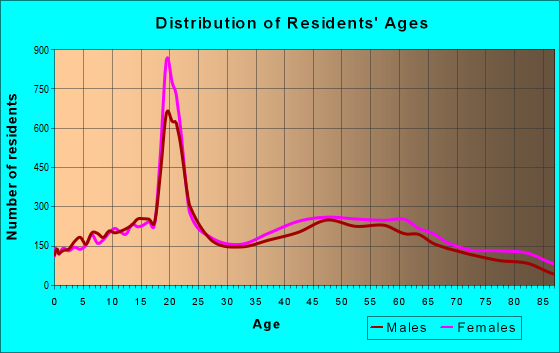
Median resident age:
This zip code:
42.1 years
California median age:
37.9 years
Average household size:
This zip code:
2.5 people
California:
2.8 people
Averages for the 2020 tax year for zip code 91711, filed in 2021:
Average Adjusted Gross Income (AGI) in 2020: $123,431 (Individual Income Tax Returns)
Here:
$123,431
State:
$95,910
Salary/wage: $94,693 (reported on 74.6% of returns)
Here:
$94,693
State:
$77,331
(% of AGI for various income ranges: 1155.3% for AGIs below $25k, 3762.5% for AGIs $25k-50k, 6834.1% for AGIs $50k-75k, 10070.2% for AGIs $75k-100k, 20174.6% for AGIs $100k-200k, 88732.3% for AGIs over 200k)
Taxable interest for individuals: $2,447 (reported on 49.9% of returns)
This zip code:
$2,447
California:
$2,294
(% of AGI for various income ranges: 27.2% for AGIs below $25k, 55.0% for AGIs $25k-50k, 78.8% for AGIs $50k-75k, 134.0% for AGIs $75k-100k, 241.1% for AGIs $100k-200k, 1963.2% for AGIs over 200k)
Ordinary dividends: $10,158 (reported on 31.8% of returns)
Here:
$10,158
State:
$10,949
(% of AGI for various income ranges: 50.4% for AGIs below $25k, 99.6% for AGIs $25k-50k, 181.3% for AGIs $50k-75k, 339.8% for AGIs $75k-100k, 648.1% for AGIs $100k-200k, 5444.0% for AGIs over 200k)
Net capital gain/loss in AGI: +$27,566 (reported on 30.5% of returns)
Here:
+$27,566
State:
+$49,306
(% of AGI for various income ranges: 24.4% for AGIs below $25k, 70.1% for AGIs $25k-50k, 173.9% for AGIs $50k-75k, 273.7% for AGIs $75k-100k, 854.2% for AGIs $100k-200k, 18936.6% for AGIs over 200k)
Profit/loss from business: +$18,015 (reported on 20.8% of returns)
Here:
+$18,015
State:
+$15,671
(% of AGI for various income ranges: 147.8% for AGIs below $25k, 299.8% for AGIs $25k-50k, 292.8% for AGIs $50k-75k, 451.1% for AGIs $75k-100k, 860.3% for AGIs $100k-200k, 4922.1% for AGIs over 200k)
Taxable individual retirement arrangement distribution: $25,483 (reported on 11.7% of returns)
91711:
$25,483
California:
$23,505
(% of AGI for various income ranges: 64.6% for AGIs below $25k, 162.0% for AGIs $25k-50k, 317.7% for AGIs $50k-75k, 505.1% for AGIs $75k-100k, 1077.8% for AGIs $100k-200k, 2843.4% for AGIs over 200k)
Self-employed (Keogh) retirement plans: $32,272 (reported on 1.8% of returns)
91711:
$32,272
California:
$30,163
(% of AGI for various income ranges: 22.7% for AGIs $50k-75k, 51.2% for AGIs $100k-200k, 1324.5% for AGIs over 200k)
Total itemized deductions: $37,737 (reported on 26.2% of returns)
Here:
$37,737
State:
$39,517
(% of AGI for various income ranges: 156.0% for AGIs below $25k, 381.5% for AGIs $25k-50k, 859.7% for AGIs $50k-75k, 1625.5% for AGIs $75k-100k, 3195.2% for AGIs $100k-200k, 11714.4% for AGIs over 200k)
Charity contributions: $9,928 (reported on 23.3% of returns)
Here:
$9,928
State:
$12,598
(% of AGI for various income ranges: 8.7% for AGIs below $25k, 37.3% for AGIs $25k-50k, 100.1% for AGIs $50k-75k, 232.1% for AGIs $75k-100k, 577.3% for AGIs $100k-200k, 3885.5% for AGIs over 200k)
Taxes paid: $8,824 (reported on 26.2% of returns)
91711:
$8,824
State:
$8,807
(% of AGI for various income ranges: 26.4% for AGIs below $25k, 83.7% for AGIs $25k-50k, 187.7% for AGIs $50k-75k, 418.0% for AGIs $75k-100k, 871.2% for AGIs $100k-200k, 2426.5% for AGIs over 200k)
Earned income credit: $1,661 (reported on 8.5% of returns)
Here:
$1,661
State:
$2,074
(% of AGI for various income ranges: 54.5% for AGIs below $25k, 54.7% for AGIs $25k-50k)
Percentage of individuals using paid preparers for their 2020 taxes: 92.2%
Here:
92%
State:
92%
(% for various income ranges: 90.3% for AGIs below $25k, 91.9% for AGIs $25k-50k, 92.5% for AGIs $50k-75k, 91.1% for AGIs $75k-100k, 93.2% for AGIs $100k-200k, 94.6% for AGIs over 200k)
Averages for the 2012 tax year for zip code 91711, filed in 2013:
Average Adjusted Gross Income (AGI) in 2012: $95,302 (Individual Income Tax Returns)
Here:
$95,302
State:
$72,726
Salary/wage: $73,619 (reported on 76.6% of returns)
Here:
$73,619
State:
$59,079
(% of AGI for various income ranges: 68.5% for AGIs below $25k, 70.5% for AGIs $25k-50k, 68.2% for AGIs $50k-75k, 66.2% for AGIs $75k-100k, 68.3% for AGIs $100k-200k, 46.8% for AGIs over 200k)
Taxable interest for individuals: $2,249 (reported on 51.5% of returns)
This zip code:
$2,249
California:
$2,146
(% of AGI for various income ranges: 2.0% for AGIs below $25k, 1.3% for AGIs $25k-50k, 1.0% for AGIs $50k-75k, 1.0% for AGIs $75k-100k, 0.8% for AGIs $100k-200k, 1.5% for AGIs over 200k)
Ordinary dividends: $8,191 (reported on 32.0% of returns)
Here:
$8,191
State:
$9,308
(% of AGI for various income ranges: 4.4% for AGIs below $25k, 2.0% for AGIs $25k-50k, 2.3% for AGIs $50k-75k, 2.2% for AGIs $75k-100k, 2.2% for AGIs $100k-200k, 3.3% for AGIs over 200k)
Net capital gain/loss in AGI: +$25,607 (reported on 27.8% of returns)
Here:
+$25,607
State:
+$30,460
(% of AGI for various income ranges: 0.7% for AGIs $25k-50k, 0.5% for AGIs $50k-75k, 0.8% for AGIs $75k-100k, 1.4% for AGIs $100k-200k, 16.4% for AGIs over 200k)
Profit/loss from business: +$18,404 (reported on 20.5% of returns)
Here:
+$18,404
State:
+$17,064
(% of AGI for various income ranges: 10.7% for AGIs below $25k, 4.9% for AGIs $25k-50k, 3.6% for AGIs $50k-75k, 4.1% for AGIs $75k-100k, 3.2% for AGIs $100k-200k, 3.8% for AGIs over 200k)
Taxable individual retirement arrangement distribution: $23,273 (reported on 13.9% of returns)
91711:
$23,273
California:
$19,557
(% of AGI for various income ranges: 4.0% for AGIs below $25k, 3.0% for AGIs $25k-50k, 3.2% for AGIs $50k-75k, 3.4% for AGIs $75k-100k, 3.7% for AGIs $100k-200k, 3.2% for AGIs over 200k)
Self-employment retirement plans: $27,604 (reported on 1.8% of returns)
91711:
$27,604
California:
$24,530
(% of AGI for various income ranges: 0.4% for AGIs $50k-75k, 0.3% for AGIs $100k-200k, 0.9% for AGIs over 200k)
Total itemized deductions: $35,723 (23% of AGI, reported on 50.7% of returns)
Here:
$35,723
State:
$34,004
Here:
22.8% of AGI
State:
22.7% of AGI
(% of AGI for various income ranges: 19.0% for AGIs below $25k, 16.4% for AGIs $25k-50k, 19.5% for AGIs $50k-75k, 21.7% for AGIs $75k-100k, 21.0% for AGIs $100k-200k, 17.2% for AGIs over 200k)
Charity contributions: $5,279 (reported on 45.3% of returns)
Here:
$5,279
State:
$4,659
(% of AGI for various income ranges: 1.3% for AGIs below $25k, 1.8% for AGIs $25k-50k, 2.5% for AGIs $50k-75k, 2.6% for AGIs $75k-100k, 2.6% for AGIs $100k-200k, 2.6% for AGIs over 200k)
Taxes paid: $14,412 (reported on 50.5% of returns)
91711:
$14,412
State:
$14,448
(% of AGI for various income ranges: 3.4% for AGIs below $25k, 3.4% for AGIs $25k-50k, 5.1% for AGIs $50k-75k, 6.6% for AGIs $75k-100k, 7.9% for AGIs $100k-200k, 9.2% for AGIs over 200k)
Earned income credit: $1,778 (reported on 11.0% of returns)
Here:
$1,778
State:
$2,286
(% of AGI for various income ranges: 4.3% for AGIs below $25k, 0.7% for AGIs $25k-50k)
Percentage of individuals using paid preparers for their 2012 taxes: 65.1%
Here:
65%
State:
64%
(% for various income ranges: 56.0% for AGIs below $25k, 61.9% for AGIs $25k-50k, 68.0% for AGIs $50k-75k, 68.7% for AGIs $75k-100k, 70.4% for AGIs $100k-200k, 81.3% for AGIs over 200k)
Averages for the 2004 tax year for zip code 91711, filed in 2005:
Average Adjusted Gross Income (AGI) in 2004: $74,103 (Individual Income Tax Returns)
Here:
$74,103
State:
$58,600
Salary/wage: $61,593 (reported on 76.5% of returns)
Here:
$61,593
State:
$49,455
(% of AGI for various income ranges: 150.5% for AGIs below $10k, 66.6% for AGIs $10k-25k, 69.1% for AGIs $25k-50k, 69.9% for AGIs $50k-75k, 73.1% for AGIs $75k-100k, 58.5% for AGIs over 100k)
Taxable interest for individuals: $2,455 (reported on 61.0% of returns)
This zip code:
$2,455
California:
$2,365
(% of AGI for various income ranges: 11.8% for AGIs below $10k, 4.1% for AGIs $10k-25k, 2.2% for AGIs $25k-50k, 1.9% for AGIs $50k-75k, 1.5% for AGIs $75k-100k, 1.9% for AGIs over 100k)
Taxable dividends: $4,767 (reported on 37.8% of returns)
Here:
$4,767
State:
$4,746
(% of AGI for various income ranges: 12.1% for AGIs below $10k, 3.2% for AGIs $10k-25k, 2.2% for AGIs $25k-50k, 2.0% for AGIs $50k-75k, 2.1% for AGIs $75k-100k, 2.5% for AGIs over 100k)
Net capital gain/loss: +$16,050 (reported on 31.3% of returns)
Here:
+$16,050
State:
+$23,418
(% of AGI for various income ranges: -7.2% for AGIs below $10k, 0.2% for AGIs $10k-25k, 1.0% for AGIs $25k-50k, 1.2% for AGIs $50k-75k, 2.5% for AGIs $75k-100k, 10.1% for AGIs over 100k)
Profit/loss from business: +$20,942 (reported on 20.1% of returns)
Here:
+$20,942
State:
+$16,826
(% of AGI for various income ranges: 13.0% for AGIs below $10k, 8.0% for AGIs $10k-25k, 5.1% for AGIs $25k-50k, 4.9% for AGIs $50k-75k, 4.2% for AGIs $75k-100k, 6.0% for AGIs over 100k)
IRA payment deduction: $3,465 (reported on 3.4% of returns)
91711:
$3,465
California:
$3,192
(% of AGI for various income ranges: 0.7% for AGIs below $10k, 0.3% for AGIs $10k-25k, 0.3% for AGIs $25k-50k, 0.3% for AGIs $50k-75k, 0.2% for AGIs $75k-100k, 0.1% for AGIs over 100k)
Self-employed pension: $20,567 (reported on 2.3% of returns)
Here:
$20,567
California:
$17,688
(% of AGI for various income ranges: 0.5% for AGIs below $10k, 0.2% for AGIs $25k-50k, 0.3% for AGIs $50k-75k, 0.3% for AGIs $75k-100k, 0.9% for AGIs over 100k)
Total itemized deductions: $29,409 (24% of AGI, reported on 51.9% of returns)
Here:
$29,409
State:
$28,113
Here:
24.5% of AGI
State:
25.3% of AGI
(% of AGI for various income ranges: 42.3% for AGIs below $10k, 19.9% for AGIs $10k-25k, 20.5% for AGIs $25k-50k, 23.8% for AGIs $50k-75k, 25.1% for AGIs $75k-100k, 18.9% for AGIs over 100k)
Charity contributions deductions: $4,743 (4% of AGI, reported on 48.2% of returns)
Here:
$4,743
State:
$3,923
Here:
3.8% of AGI
State:
3.3% of AGI
(% of AGI for various income ranges: 2.2% for AGIs below $10k, 1.7% for AGIs $10k-25k, 2.7% for AGIs $25k-50k, 3.2% for AGIs $50k-75k, 3.6% for AGIs $75k-100k, 3.1% for AGIs over 100k)
Total tax: $13,475 (reported on 80.4% of returns)
91711:
$13,475
State:
$10,761
(% of AGI for various income ranges: 5.7% for AGIs below $10k, 4.8% for AGIs $10k-25k, 7.4% for AGIs $25k-50k, 9.3% for AGIs $50k-75k, 9.8% for AGIs $75k-100k, 18.4% for AGIs over 100k)
Earned income credit: $1,466 (reported on 8.3% of returns)
Here:
$1,466
State:
$1,763
Percentage of individuals using paid preparers for their 2004 taxes: 66.7%
Here:
67%
State:
66%
(% for various income ranges: 53.6% for AGIs below $10k, 63.7% for AGIs $10k-25k, 66.1% for AGIs $25k-50k, 70.5% for AGIs $50k-75k, 71.3% for AGIs $75k-100k, 76.0% for AGIs over 100k)
Likely homosexual households (counted as self-reported same-sex unmarried-partner households)
Lesbian couples: 0.0% of all households
Gay men: 0.3% of all households
Household received Food Stamps/SNAP in the past 12 months: 864 Household did not receive Food Stamps/SNAP in the past 12 months: 12,083
Women who had a birth in the past 12 months: 326 (281 now married, 43 unmarried) Women who did not have a birth in the past 12 months: 8,669 (2,870 now married, 5,822 unmarried)
Housing units in zip code 91711 with a mortgage: 5,928 (768 second mortgage, 7 home equity loan, 629 both second mortgage and home equity loan) Houses without a mortgage: 60
Median monthly owner costs for units with a mortgage: $3,125 Median monthly owner costs for units without a mortgage: $784
Residents with income below the poverty level in 2022:
This zip code:
5.8%
Whole state:
12.2%
Residents with income below 50% of the poverty level in 2022:
This zip code:
3.0%
Whole state:
6.2%
Median number of rooms in houses and condos:
Here:
6.8
State:
6.0
Median number of rooms in apartments:
Here:
4.1
State:
3.9
Notable locations in this zip code not listed on our city pages
Notable locations in zip code 91711: Foothill Business Center (A), Claremont Golf Course (B), Claremont Branch County of Los Angeles Public Library (C), Los Angeles County Fire Department Station 102 (D), Los Angeles County Fire Department Station 101 (E), Los Angeles County Fire Department Station 62 (F), Padua Hills Theater (G). Display/hide their locations on the map
Shopping Centers: Claremont Heights Center Shopping Center (1), Griswolds Old House Shopping Center (2), Vanderbilt Square Shopping Center (3), The Old School House Shopping Center (4), Stater Brothers Shopping Center (5), Pepper Tree Square Shopping Center (6), North Hills Square Shopping Center (7), Griswolds Old School House Shopping Center (8), College Center Shopping Center (9). Display/hide their locations on the map
Churches in zip code 91711 include: Claremont Bible Chapel (A), Claremont United Church of Christ (B), First Baptist Church (C), First Church of Christ Scientist (D), Good Shepherd Lutheran Church (E), Our Lady of the Assumption Church (F). Display/hide their locations on the map
Parks in zip code 91711 include: Cahuilla Park (1), Memorial Park (2), Blaisdell Park (3), Larkin Park (4), Lewis Park (5), Marlow Park (6), Rancho Santa Ana Botanic Garden (7), Stuart Wheeler Park (8), Chaparral Park (9). Display/hide their locations on the map
In group quarters: 4,654 (-1 institutionalized population)
Size of family households: 4,247 2-persons, 2,286 3-persons, 1,685 4-persons, 748 5-persons, 151 6-persons, 60 7-or-more-persons
Size of nonfamily households: 3,234 1-person, 592 2-persons, 131 3-persons
4,555 married couples with children.
1,036 single-parent households (239 men, 797 women).
72.2% of residents of 91711 zip code speak English at home.
12.1% of residents speak Spanish at home (81% very well, 14% well, 4% not well, 1% not at all).
4.0% of residents speak other Indo-European language at home (86% very well, 11% well, 3% not well).
10.8% of residents speak Asian or Pacific Island language at home (55% very well, 30% well, 10% not well, 5% not at all).
1.1% of residents speak other language at home (85% very well, 14% well, 2% not at all).
Foreign born population: 6,501 (17.5%) (69.4% of them are naturalized citizens)
This zip code:
17.5%
Whole state:
26.7%
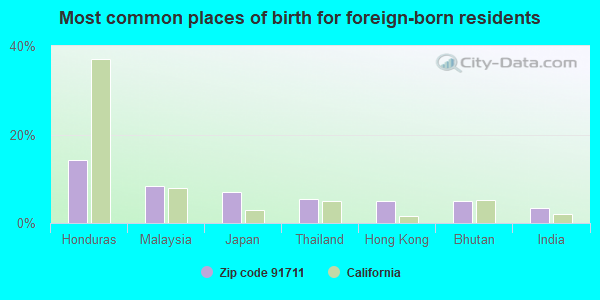
14%Honduras
8%Malaysia
7%Japan
5%Thailand
5%Hong Kong
5%Bhutan
3%India
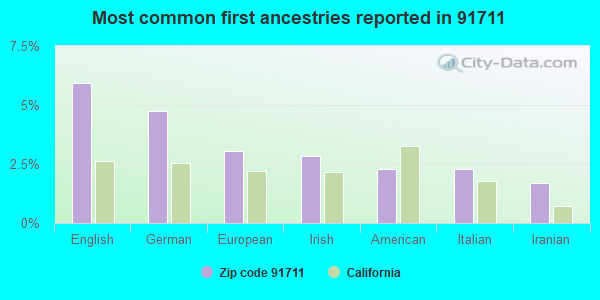
6%English
5%German
3%European
3%Irish
2%American
2%Italian
2%Iranian
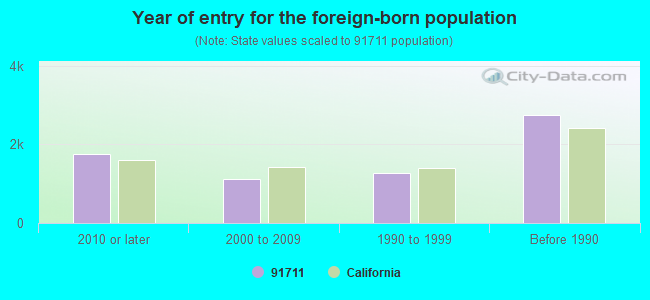
Year of entry for the foreign-born population
1,7452010 or later
1,1142000 to 2009
1,2701990 to 1999
2,747Before 1990
Major facilities with environmental interests located in this zip code:
MIRAMAR WATER TREATMENT PLANT (1021 MIRAMAR AVENUE in CLAREMONT, CA)
STATE MASTER (California - Hazardous Waste Tracking) - HAZARDOU WASTE PROGRAM Large Quantity Generators, more that 1000 kg of hazardous waste/month (Resource Conservation and Recovery Act (tracking hazardous waste)) - notification Organizations: THREE VALLEYS MUNICIPAL WATER DISTRICT (CONTACT/OPERATOR)
Alternative names: THREE VALLEYS MUNI WATER DIST
FREDERICK THOMAS HAYS (344 W 8TH ST in CLAREMONT, CA)
STATE MASTER (California - Hazardous Waste Tracking) - HAZARDOU WASTE PROGRAM TRANSPORTER (Resource Conservation and Recovery Act (tracking hazardous waste)) - notification Organizations: FREDERICK HAYS (CONTACT/OWNER)
CHEVRON 202024 (699 E FOOTHILL in CLAREMONT, CA) . Federal Facility
STATE MASTER (California - Hazardous Waste Tracking) - HAZARDOU WASTE PROGRAM Small Quantity Generators, between 100 kg and 1000 kg of hazardous waste/month (Resource Conservation and Recovery Act (tracking hazardous waste)) - notification Organizations: CHEVRON U S A PRODUCTS CO (CONTACT/OWNER)
Alternative names: CHEVRON STATION 20 2024
CHEVRON STATION NO 207053 (860 INDIAN HILL BLVD in CLAREMONT, CA)
STATE MASTER (California - Hazardous Waste Tracking) - HAZARDOU WASTE PROGRAM Small Quantity Generators, between 100 kg and 1000 kg of hazardous waste/month (Resource Conservation and Recovery Act (tracking hazardous waste)) - notification Organizations: CHEVRON PRODUCTS CO (CONTACT/OWNER)
EL ROBLE INTERMEDIATE (665 N. MOUNTAIN AVE. in CLAREMONT, CA)
(National Center for Education Statistics) - STATE ID-6057541 Organizations: CLAREMONT UNIFIED (SCHOOL DISTRICT)
CHAPARRAL ELEMENTARY (451 CHAPARRAL DR. in CLAREMONT, CA)
(National Center for Education Statistics) - STATE ID-6012157 Organizations: CLAREMONT UNIFIED (SCHOOL DISTRICT)
MOUNTAIN VIEW ELEMENTARY (851 SANTA CLARA AVE. in CLAREMONT, CA)
(National Center for Education Statistics) - STATE ID-6012181 Organizations: CLAREMONT UNIFIED (SCHOOL DISTRICT)
GARNER GLASS CO (177 SOUTH INDIAN HILL BOULEVARD in CLAREMONT, CA)
CRITERIA AND HAZARDOUS AIR POLLUTANT INVENTORY (Inventory of air pollution sources) Large Quantity Generators, more that 1000 kg of hazardous waste/month (Resource Conservation and Recovery Act (tracking hazardous waste)) TRI REPORTER (Tracking of toxic chemicals releasing facilities) Business SIC classification: GLASS PRODUCTS, MADE OF PURCHASED GLASS Business NAICS classification: OTHER PRESSED AND BLOWN GLASS AND GLASSWARE MANUFACTURING.; OTHER ELECTRONIC COMPONENT MANUFACTURING.
HIREL CONNECTORS, INC. (760 WEST WHARTON DRIVE in CLAREMONT, CA)
HAZARDOUS WASTE BIENNIAL REPORTER (Resource Conservation and Recovery Act (tracking hazardous waste)) Large Quantity Generators, more that 1000 kg of hazardous waste/month (Resource Conservation and Recovery Act (tracking hazardous waste)) Business NAICS classification: ELECTRONIC CONNECTOR MANUFACTURING.
EXXONMOBIL OIL CORP. (747 S INDIAN HILL BLVD in CLAREMONT, CA)
HAZARDOUS WASTE BIENNIAL REPORTER (Resource Conservation and Recovery Act (tracking hazardous waste)) Large Quantity Generators, more that 1000 kg of hazardous waste/month (Resource Conservation and Recovery Act (tracking hazardous waste)) Organizations: EXXONMOBIL OIL CORPORATION (CONTACT/OWNER)
CHIRON VISION CORP (517 IOLAB DR in CLAREMONT, CA)
HAZARDOUS WASTE BIENNIAL REPORTER (Resource Conservation and Recovery Act (tracking hazardous waste)) (Resource Conservation and Recovery Act (tracking hazardous waste)) Organizations: CHIRON CORP (CONTACT/OWNER)
Alternative names: BAUSCH & LOMB SURGICAL
CHAMBERS D J TRUCKING (235 W ARMSTRONG DR in CLAREMONT, CA)
TRANSPORTER (Resource Conservation and Recovery Act (tracking hazardous waste))
CAMPO ROQUE TRUCKING (480 W MT CARMEL DR in CLAREMONT, CA)
TRANSPORTER (Resource Conservation and Recovery Act (tracking hazardous waste)) Organizations: ROQUE CAMPO (CONTACT/OWNER)
Housing units lacking complete plumbing facilities: 0.4% Housing units lacking complete kitchen facilities: 2.5%
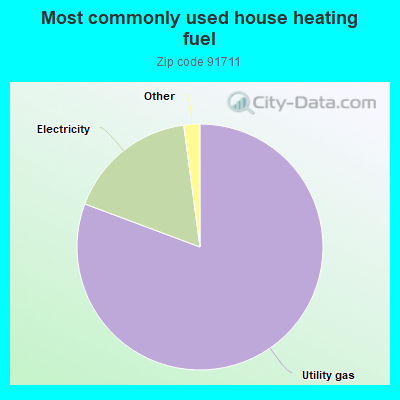
80.7%Utility gas
17.2%Electricity
0.9%Bottled, tank, or LP gas
0.7%No fuel used
Population in 1990: 34,096. Population change in the 1990s: +619 (+1.8%).
Place of birth for U.S.-born residents:
This state: 21,708
Northeast: 2,281
Midwest: 2,732
South: 1,964
West: 1,547
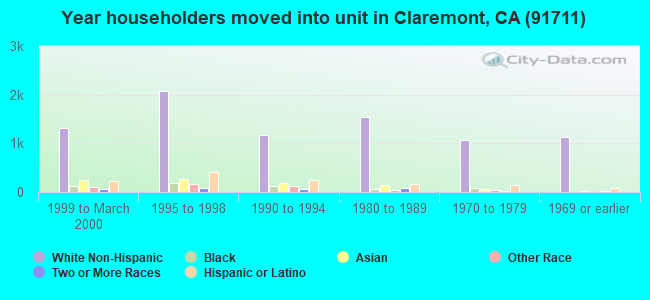
52% of the 91711 zip code residents lived in the same house 5 years ago. Out of people who lived in different houses, 48% lived in this county. Out of people who lived in different counties, 50% lived in California.
89% of the 91711 zip code residents lived in the same house 1 year ago. Out of people who lived in different houses, 51% moved from this county. Out of people who lived in different houses, 33% moved from different county within same state. Out of people who lived in different houses, 10% moved from different state. Out of people who lived in different houses, 7% moved from abroad.
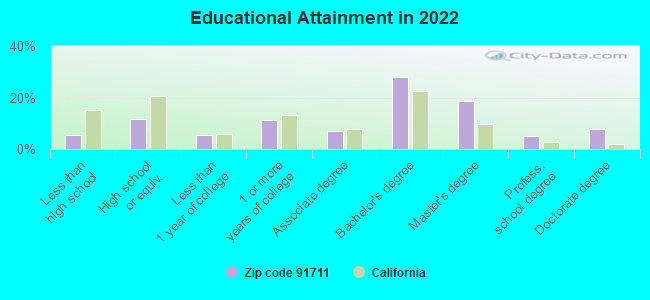
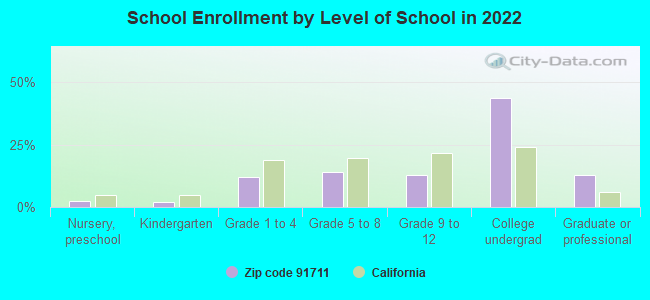
Private vs. public school enrollment:
Students in private schools in grades 1 to 8 (elementary and middle school): 519
Here:
16.2%
California:
10.5%
Students in private schools in grades 9 to 12 (high school): 176
Here:
11.6%
California:
8.5%
Students in private undergraduate colleges: 2,913
Here:
53.9%
California:
15.9%
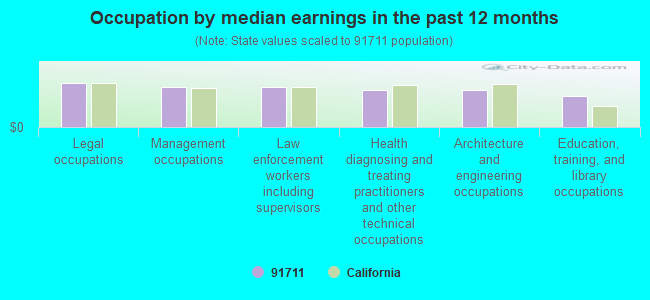
Occupation by median earnings in the past 12 months ($)
118,403Legal occupations
108,788Management occupations
107,680Law enforcement workers including supervisors
101,369Health diagnosing and treating practitioners and other technical occupations
100,570Architecture and engineering occupations
83,710Education, training, and library occupations
Companies with federal contracts located in this zip code (CLAREMONT, CA):
HIREL CONNECTORS, INC (760 WEST WHARTON DRIVE; small business) : $2,444,303 in 90 contractsfrom 1999 to 2006
Contracts for Connectors, Electrical, Armament Training Devices, Cable, Cord, and Wire Assemblies: Communications Equipment, Miscellaneous Electrical and Electronic Components, and moreby Air Force, NASA, Defense Logistics Agency, Navy, and others Signed by year:2000: $104,878; 2001: $534,924; 2002: $117,292; 2003: $441,991; 2004: $508,569; 2005: $552,912; 2006: $111,737.
Biggest contracts:
$427,307 with Air Force for Connectors, Electrical. Signed on 2001-09-17. Completion date: 2001-01-31.
$340,564, same as above.Signed on 2003-03-14. Completion date: 2003-10-31.
$201,853, same as above.Signed on 2004-06-25. Completion date: 2005-02-28.
$107,617 with Air Force for Armament Training Devices. Signed on 2001-09-06. Completion date: 2002-01-30.
MATHEMATICAL ANALYSIS RESEARCH (4239 VIA PADOVA; small business) : $1,988,524 in 7 contractsfrom 2000 to 2005
Contracts for Engineering and Technical Services, Other Quality Control, Testing and Inspection Services -- Miscellaneous by Navy Signed by year:2000: $429,057; 2001: $0; 2002: $459,631; 2003: $475,710; 2004: $574,171; 2005: $49,955; 2006: $0.
Biggest contracts:
$492,358 with Navy for Engineering and Technical Services. Signed on 2004-11-24. Completion date: 2005-09-30.
$475,710, same as above.Signed on 2003-10-27. Completion date: 2004-09-30.
$459,631, same as above.Signed on 2002-10-16. Completion date: 2003-09-30.
$429,057 with Navy for Other Quality Control, Testing and Inspection Services -- Miscellaneous. Signed on 2000-11-14. Completion date: 2001-09-30.
KECK GRADUATE INSTITUTE OF APP (535 WATSON DRIVE) : $600,000 in 2 contractsfrom 2002 to 2003
$450,000 with Department of Defense for Other Defense -- Applied Research and Exploratory Development (R&D). Signed on 2002-07-09. Completion date: 2003-06-30.
$150,000, same as above.Signed on 2003-05-21. Completion date: 2003-09-30.
DURON CONSULTANTS (4406 LIVE OAK DRIVE) : $154,500 in 7 contractsfrom 2002 to 2005
Contracts for Other Research and Development -- Applied Research and Exploratory Development (R&D), Other Research and Development -- Basic Research (R&D) by Army, U.S. Army Corps of Engineers - civil program financing only Signed by year:2000: $0; 2001: $0; 2002: $25,000; 2003: $20,000; 2004: $77,500; 2005: $32,000; 2006: $0.
Biggest contracts:
$47,500 with Army for Other Research and Development -- Applied Research and Exploratory Development (R&D). Signed on 2004-03-22. Completion date: 2004-09-19.
$25,000, same as above.Signed on 2002-02-25. Completion date: 2003-02-21.
$20,000, same as above.Signed on 2003-08-07. Completion date: 2003-11-07.
$16,000 with U.S. Army Corps of Engineers - civil program financing only for Other Research and Development -- Applied Research and Exploratory Development (R&D). Signed on 2005-04-28. Completion date: 2006-10-28.
SCRIPPS COLLEGE INC (1030 COLUMBIA AVE) : $108,000 in 4 contractsfrom 2003 to 2005
$40,000 with Army for Educational Services. Signed on 2005-08-15. Completion date: 2005-08-15.
$25,500, same as above.Signed on 2003-07-30. Completion date: 2003-07-30.
$25,500, same as above.Signed on 2003-06-23. Completion date: 2003-06-23.
$17,000, same as above.Signed on 2004-07-19. Completion date: 2004-07-19.
VORTOX COMPANY (121 S INDIAN HILL BLVD; small business)
$34,373 with Army for Waste Disposal Equipment. Signed on 2004-08-05. Completion date: 2004-10-13.
CALIFORNIA SURFACING (4457 OAK LANE; small business)
$29,600 with Navy for Maintenance, Repair or Alteration of Real Property -- Other Non-Building Facilities. Signed on 2001-08-14. Completion date: 2001-09-30.
IMPALA GROUP (237 W TWELFTH STREET; small business)
$10,705 with Navy for Education Services. Taking place in RI. Signed on 2005-08-01. Completion date: 2006-05-26.
ULTRA-LUM, INC (1480 N CLAREMONT BLVD; small business)
$4,279 with Army for Laboratory Equipment and Supplies. Signed on 2003-09-15. Completion date: 2003-10-10.
Top industries in this zip code by the number of employees in 2005:
2005 - 2017 National Fire Incident Reporting System (NFIRS) incidents
According to the data from the years 2005 - 2017 the average number of fires per year is 18. The highest number of fires - 137 took place in 2010, and the least - 2 in 2005. The data has a constant trend.
When looking into fire subcategories, the most incidents belonged to: Structure Fires (43.9%), and Outside Fires (32.2%).
Fire incident types reported to NFIRS in Zip Code 91711
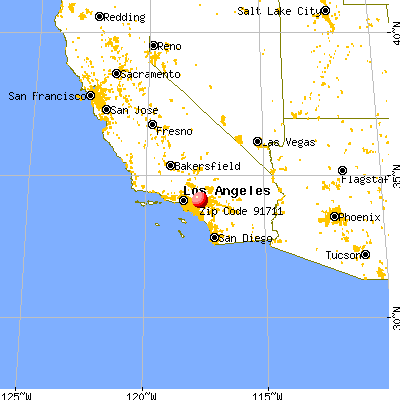


 Nearest zip codes: 91767, 91763, 91786, 91784, 91750, 91762.


 According to the data from the years 2005 - 2017 the average number of fires per year is 18. The highest number of fires - 137 took place in 2010, and the least - 2 in 2005. The data has a constant trend.
 When looking into fire subcategories, the most incidents belonged to: Structure Fires (43.9%), and Outside Fires (32.2%).