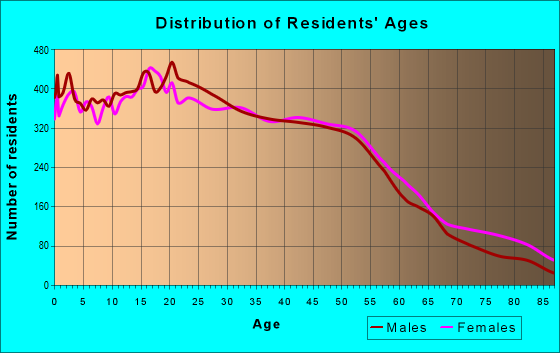
Estimated zip code population in 2022: 50,293 Zip code population in 2010: 48,068 Zip code population in 2000: 46,614
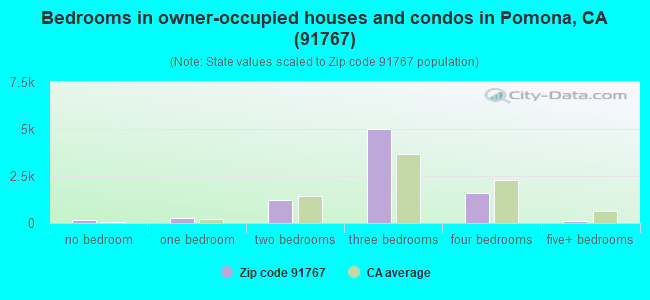
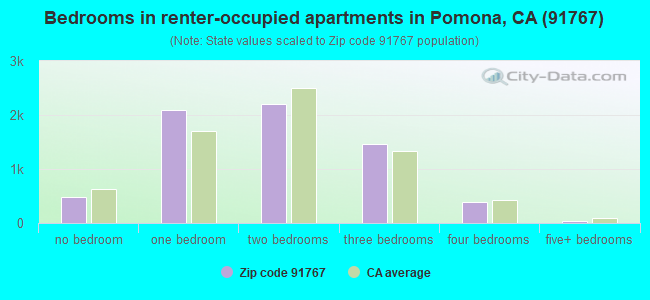
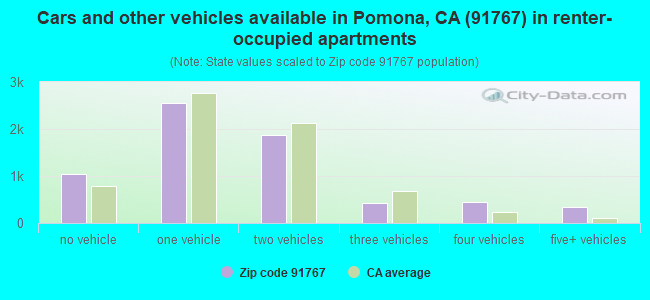
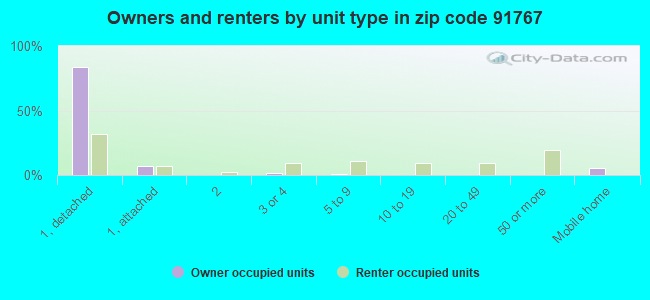
Houses and condos: 15,670 Renter-occupied apartments: 6,692
% of renters here:
45%
State:
44%
March 2022 cost of living index in zip code 91767: 132.9 (high, U.S. average is 100)
Land area: 5.6 sq. mi. Water area: 0.0 sq. mi.
Population density: 8,948 people per square mile
(high).
OSM Map
General Map
Google Map
MSN Map
OSM Map
General Map
Google Map
MSN Map
OSM Map
General Map
Google Map
MSN Map
OSM Map
General Map
Google Map
MSN Map
Please wait while loading the map...
Real estate property taxes paid for housing units in 2022:
This zip code:
0.6% ($3,591)
California:
0.7% ($4,831)
Median real estate property taxes paid for housing units with mortgages in 2022: $3,939 (0.6%) Median real estate property taxes paid for housing units with no mortgage in 2022: $2,871 (0.5%)
Averages for the 2020 tax year for zip code 91767, filed in 2021:
Average Adjusted Gross Income (AGI) in 2020: $47,582 (Individual Income Tax Returns)
Here:
$47,582
State:
$95,910
Salary/wage: $44,784 (reported on 85.6% of returns)
Here:
$44,784
State:
$77,331
(% of AGI for various income ranges: 1258.1% for AGIs below $25k, 4054.4% for AGIs $25k-50k, 7640.2% for AGIs $50k-75k, 11003.1% for AGIs $75k-100k, 19625.2% for AGIs $100k-200k, 63906.2% for AGIs over 200k)
Taxable interest for individuals: $438 (reported on 24.0% of returns)
This zip code:
$438
California:
$2,294
(% of AGI for various income ranges: 5.9% for AGIs below $25k, 5.7% for AGIs $25k-50k, 13.5% for AGIs $50k-75k, 28.3% for AGIs $75k-100k, 72.2% for AGIs $100k-200k, 358.8% for AGIs over 200k)
Ordinary dividends: $3,973 (reported on 6.6% of returns)
Here:
$3,973
State:
$10,949
(% of AGI for various income ranges: 5.7% for AGIs below $25k, 5.6% for AGIs $25k-50k, 13.7% for AGIs $50k-75k, 52.6% for AGIs $75k-100k, 180.9% for AGIs $100k-200k, 3017.5% for AGIs over 200k)
Net capital gain/loss in AGI: +$9,306 (reported on 7.9% of returns)
Here:
+$9,306
State:
+$49,306
(% of AGI for various income ranges: 2.4% for AGIs below $25k, 8.2% for AGIs $25k-50k, 26.9% for AGIs $50k-75k, 56.2% for AGIs $75k-100k, 307.7% for AGIs $100k-200k, 14781.2% for AGIs over 200k)
Profit/loss from business: +$7,925 (reported on 16.3% of returns)
Here:
+$7,925
State:
+$15,671
(% of AGI for various income ranges: 181.3% for AGIs below $25k, 164.2% for AGIs $25k-50k, 116.5% for AGIs $50k-75k, 136.1% for AGIs $75k-100k, 301.1% for AGIs $100k-200k, 3193.8% for AGIs over 200k)
Taxable individual retirement arrangement distribution: $16,397 (reported on 3.0% of returns)
91767:
$16,397
California:
$23,505
(% of AGI for various income ranges: 15.9% for AGIs below $25k, 24.1% for AGIs $25k-50k, 67.3% for AGIs $50k-75k, 134.6% for AGIs $75k-100k, 300.6% for AGIs $100k-200k, 3168.8% for AGIs over 200k)
Total itemized deductions: $28,394 (reported on 11.8% of returns)
Here:
$28,394
State:
$39,517
(% of AGI for various income ranges: 48.0% for AGIs below $25k, 172.8% for AGIs $25k-50k, 581.0% for AGIs $50k-75k, 1236.3% for AGIs $75k-100k, 2425.8% for AGIs $100k-200k, 10570.0% for AGIs over 200k)
Charity contributions: $5,497 (reported on 9.9% of returns)
Here:
$5,497
State:
$12,598
(% of AGI for various income ranges: 3.4% for AGIs below $25k, 20.7% for AGIs $25k-50k, 73.6% for AGIs $50k-75k, 176.9% for AGIs $75k-100k, 404.4% for AGIs $100k-200k, 3388.8% for AGIs over 200k)
Taxes paid: $8,197 (reported on 11.8% of returns)
91767:
$8,197
State:
$8,807
(% of AGI for various income ranges: 11.0% for AGIs below $25k, 45.7% for AGIs $25k-50k, 168.9% for AGIs $50k-75k, 393.3% for AGIs $75k-100k, 741.9% for AGIs $100k-200k, 2221.2% for AGIs over 200k)
Earned income credit: $2,130 (reported on 20.3% of returns)
Here:
$2,130
State:
$2,074
(% of AGI for various income ranges: 103.1% for AGIs below $25k, 73.1% for AGIs $25k-50k, 1.0% for AGIs $50k-75k)
Percentage of individuals using paid preparers for their 2020 taxes: 92.5%
Here:
93%
State:
92%
(% for various income ranges: 91.5% for AGIs below $25k, 92.9% for AGIs $25k-50k, 92.5% for AGIs $50k-75k, 93.1% for AGIs $75k-100k, 93.9% for AGIs $100k-200k, 96.7% for AGIs over 200k)
Averages for the 2012 tax year for zip code 91767, filed in 2013:
Average Adjusted Gross Income (AGI) in 2012: $37,425 (Individual Income Tax Returns)
Here:
$37,425
State:
$72,726
Salary/wage: $35,698 (reported on 85.6% of returns)
Here:
$35,698
State:
$59,079
(% of AGI for various income ranges: 77.1% for AGIs below $25k, 86.5% for AGIs $25k-50k, 84.9% for AGIs $50k-75k, 82.6% for AGIs $75k-100k, 80.3% for AGIs $100k-200k, 53.4% for AGIs over 200k)
Taxable interest for individuals: $508 (reported on 24.7% of returns)
This zip code:
$508
California:
$2,146
(% of AGI for various income ranges: 0.3% for AGIs below $25k, 0.3% for AGIs $25k-50k, 0.3% for AGIs $50k-75k, 0.3% for AGIs $75k-100k, 0.4% for AGIs $100k-200k, 0.9% for AGIs over 200k)
Ordinary dividends: $4,162 (reported on 6.6% of returns)
Here:
$4,162
State:
$9,308
(% of AGI for various income ranges: 0.3% for AGIs below $25k, 0.3% for AGIs $25k-50k, 0.6% for AGIs $50k-75k, 0.7% for AGIs $75k-100k, 1.2% for AGIs $100k-200k, 3.9% for AGIs over 200k)
Net capital gain/loss in AGI: +$2,496 (reported on 5.5% of returns)
Here:
+$2,496
State:
+$30,460
(% of AGI for various income ranges: 1.1% for AGIs $100k-200k, 4.8% for AGIs over 200k)
Profit/loss from business: +$9,268 (reported on 16.4% of returns)
Here:
+$9,268
State:
+$17,064
(% of AGI for various income ranges: 13.0% for AGIs below $25k, 3.7% for AGIs $25k-50k, 1.5% for AGIs $50k-75k, 1.3% for AGIs $75k-100k, 2.2% for AGIs $100k-200k)
Taxable individual retirement arrangement distribution: $13,551 (reported on 4.0% of returns)
91767:
$13,551
California:
$19,557
(% of AGI for various income ranges: 0.9% for AGIs below $25k, 1.0% for AGIs $25k-50k, 1.3% for AGIs $50k-75k, 1.4% for AGIs $75k-100k, 2.0% for AGIs $100k-200k, 6.0% for AGIs over 200k)
Self-employment retirement plans: $10,300 (reported on 0.1% of returns)
91767:
$10,300
California:
$24,530
Total itemized deductions: $21,341 (31% of AGI, reported on 29.2% of returns)
Here:
$21,341
State:
$34,004
Here:
30.8% of AGI
State:
22.7% of AGI
(% of AGI for various income ranges: 7.4% for AGIs below $25k, 13.9% for AGIs $25k-50k, 19.6% for AGIs $50k-75k, 20.8% for AGIs $75k-100k, 21.5% for AGIs $100k-200k, 21.2% for AGIs over 200k)
Charity contributions: $2,677 (reported on 23.8% of returns)
Here:
$2,677
State:
$4,659
(% of AGI for various income ranges: 0.4% for AGIs below $25k, 1.3% for AGIs $25k-50k, 1.9% for AGIs $50k-75k, 2.1% for AGIs $75k-100k, 2.8% for AGIs $100k-200k, 2.9% for AGIs over 200k)
Taxes paid: $5,696 (reported on 29.1% of returns)
91767:
$5,696
State:
$14,448
(% of AGI for various income ranges: 1.2% for AGIs below $25k, 3.0% for AGIs $25k-50k, 4.9% for AGIs $50k-75k, 5.9% for AGIs $75k-100k, 7.0% for AGIs $100k-200k, 8.3% for AGIs over 200k)
Earned income credit: $2,479 (reported on 28.4% of returns)
Here:
$2,479
State:
$2,286
(% of AGI for various income ranges: 8.6% for AGIs below $25k, 1.6% for AGIs $25k-50k)
Percentage of individuals using paid preparers for their 2012 taxes: 73.7%
Here:
74%
State:
64%
(% for various income ranges: 72.0% for AGIs below $25k, 75.0% for AGIs $25k-50k, 76.0% for AGIs $50k-75k, 75.0% for AGIs $75k-100k, 75.0% for AGIs $100k-200k, 88.9% for AGIs over 200k)
Averages for the 2004 tax year for zip code 91767, filed in 2005:
Average Adjusted Gross Income (AGI) in 2004: $33,594 (Individual Income Tax Returns)
Here:
$33,594
State:
$58,600
Salary/wage: $31,800 (reported on 88.8% of returns)
Here:
$31,800
State:
$49,455
(% of AGI for various income ranges: 89.8% for AGIs below $10k, 84.1% for AGIs $10k-25k, 89.9% for AGIs $25k-50k, 87.5% for AGIs $50k-75k, 86.9% for AGIs $75k-100k, 61.6% for AGIs over 100k)
Taxable interest for individuals: $888 (reported on 30.7% of returns)
This zip code:
$888
California:
$2,365
(% of AGI for various income ranges: 1.6% for AGIs below $10k, 0.7% for AGIs $10k-25k, 0.5% for AGIs $25k-50k, 0.8% for AGIs $50k-75k, 0.7% for AGIs $75k-100k, 1.5% for AGIs over 100k)
Taxable dividends: $2,633 (reported on 8.5% of returns)
Here:
$2,633
State:
$4,746
(% of AGI for various income ranges: 0.7% for AGIs below $10k, 0.4% for AGIs $10k-25k, 0.3% for AGIs $25k-50k, 0.6% for AGIs $50k-75k, 0.9% for AGIs $75k-100k, 1.6% for AGIs over 100k)
Net capital gain/loss: +$10,173 (reported on 6.7% of returns)
Here:
+$10,173
State:
+$23,418
(% of AGI for various income ranges: -0.1% for AGIs below $10k, 0.0% for AGIs $10k-25k, 0.1% for AGIs $25k-50k, 0.5% for AGIs $50k-75k, 1.2% for AGIs $75k-100k, 12.4% for AGIs over 100k)
Profit/loss from business: +$8,234 (reported on 13.6% of returns)
Here:
+$8,234
State:
+$16,826
(% of AGI for various income ranges: 12.3% for AGIs below $10k, 6.9% for AGIs $10k-25k, 2.5% for AGIs $25k-50k, 1.8% for AGIs $50k-75k, 1.6% for AGIs $75k-100k, 3.5% for AGIs over 100k)
IRA payment deduction: $2,386 (reported on 1.2% of returns)
91767:
$2,386
California:
$3,192
(% of AGI for various income ranges: 0.1% for AGIs $10k-25k, 0.1% for AGIs $25k-50k, 0.1% for AGIs $50k-75k, 0.1% for AGIs $75k-100k, 0.1% for AGIs over 100k)
Self-employed pension: $11,154 (reported on 0.2% of returns)
Here:
$11,154
California:
$17,688
Total itemized deductions: $19,582 (34% of AGI, reported on 34.9% of returns)
Here:
$19,582
State:
$28,113
Here:
34.1% of AGI
State:
25.3% of AGI
(% of AGI for various income ranges: 8.6% for AGIs below $10k, 10.8% for AGIs $10k-25k, 19.7% for AGIs $25k-50k, 24.7% for AGIs $50k-75k, 25.1% for AGIs $75k-100k, 23.4% for AGIs over 100k)
Charity contributions deductions: $2,408 (4% of AGI, reported on 30.7% of returns)
Here:
$2,408
State:
$3,923
Here:
4.0% of AGI
State:
3.3% of AGI
(% of AGI for various income ranges: 0.4% for AGIs below $10k, 0.8% for AGIs $10k-25k, 1.9% for AGIs $25k-50k, 2.7% for AGIs $50k-75k, 3.2% for AGIs $75k-100k, 3.0% for AGIs over 100k)
Total tax: $3,593 (reported on 63.2% of returns)
91767:
$3,593
State:
$10,761
(% of AGI for various income ranges: 3.0% for AGIs below $10k, 3.2% for AGIs $10k-25k, 4.7% for AGIs $25k-50k, 6.9% for AGIs $50k-75k, 8.8% for AGIs $75k-100k, 14.0% for AGIs over 100k)
Earned income credit: $1,926 (reported on 25.8% of returns)
Here:
$1,926
State:
$1,763
Percentage of individuals using paid preparers for their 2004 taxes: 74.7%
Here:
75%
State:
66%
(% for various income ranges: 69.0% for AGIs below $10k, 76.8% for AGIs $10k-25k, 75.2% for AGIs $25k-50k, 74.9% for AGIs $50k-75k, 74.9% for AGIs $75k-100k, 80.0% for AGIs over 100k)
Likely homosexual households (counted as self-reported same-sex unmarried-partner households)
Lesbian couples: 0.2% of all households
Gay men: 0.0% of all households
Household received Food Stamps/SNAP in the past 12 months: 2,878 Household did not receive Food Stamps/SNAP in the past 12 months: 12,323
Women who had a birth in the past 12 months: 785 (375 now married, 414 unmarried) Women who did not have a birth in the past 12 months: 12,277 (4,094 now married, 8,215 unmarried)
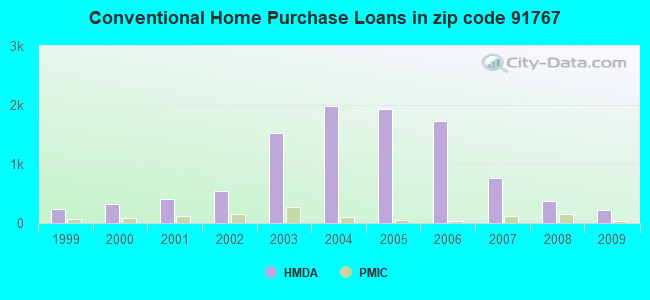
Housing units in zip code 91767 with a mortgage: 5,669 (365 second mortgage, 14 home equity loan, 291 both second mortgage and home equity loan) Houses without a mortgage: 128
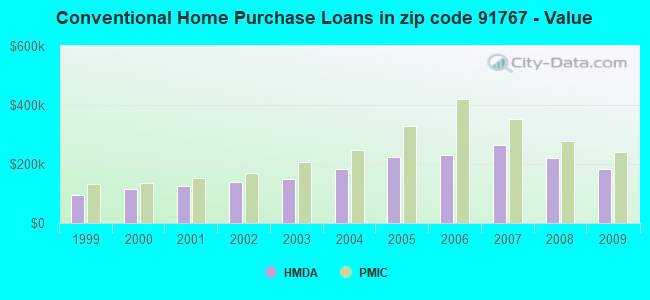
Median monthly owner costs for units with a mortgage: $2,283 Median monthly owner costs for units without a mortgage: $649
Residents with income below the poverty level in 2022:
This zip code:
15.1%
Whole state:
12.2%
Residents with income below 50% of the poverty level in 2022:
This zip code:
6.3%
Whole state:
6.2%
Median number of rooms in houses and condos:
Here:
5.8
State:
6.0
Median number of rooms in apartments:
Here:
3.9
State:
3.9
Notable locations in this zip code not listed on our city pages
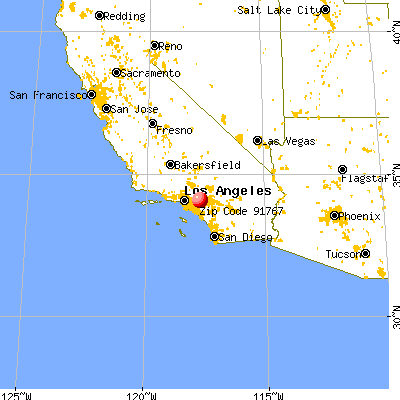
Notable locations in zip code 91767: Pomona (A), Claremont City Hall (B), Cole Schaefer Ambulance Service (C), Los Angeles County Fire Department Station 186 (D), Los Angeles County Fire Department Station 183 (E). Display/hide their locations on the map
Shopping Centers: Foothill and Towne Center Shopping Center (1), The Valley Center Shopping Center (2), Indian Hill Marketplace Shopping Center (3), Garey Shopping Center (4), Foothill and Towne Shopping Center (5). Display/hide their locations on the map
Churches in zip code 91767 include: First Presbyterian Church (A), Pilgrim Congregational Church (B), Pilgrim Holiness Church (C), Saint Pauls Lutheran Church (D), Trinity Methodist Church (E), Central Baptist Church (F), Christ Apostolic Church (G), Church of Christ (H), Covenant United Methodist Church (I). Display/hide their locations on the map
Parks in zip code 91767 include: Garfield Park (1), Lincoln Park (2), Palomares Park (3), Ted Green Field (4), Harrison Park (5), Montvue Park (6), Pomona Jaycees Community Park (7), Ted Greene Park (8). Display/hide their locations on the map
5,095 married couples with children.
3,654 single-parent households (942 men, 2,712 women).
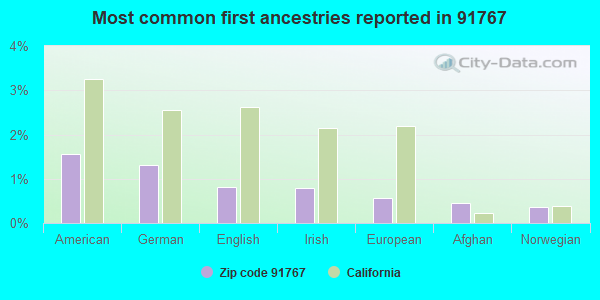
41.5% of residents of 91767 zip code speak English at home.
49.0% of residents speak Spanish at home (66% very well, 13% well, 13% not well, 8% not at all).
2.0% of residents speak other Indo-European language at home (59% very well, 19% well, 22% not well).
7.1% of residents speak Asian or Pacific Island language at home (44% very well, 22% well, 24% not well, 11% not at all).
0.3% of residents speak other language at home (61% very well, 34% well, 4% not well).
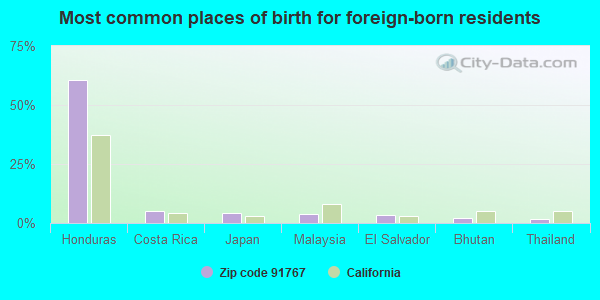
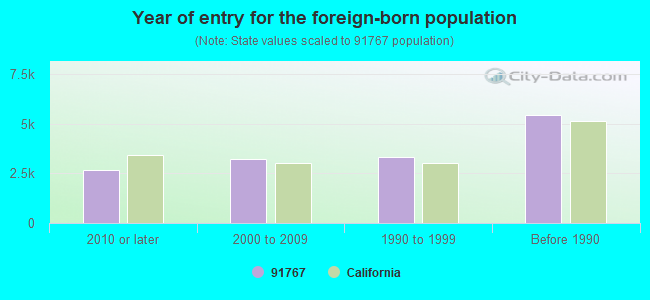
Foreign born population: 14,214 (28.3%) (48.1% of them are naturalized citizens)
Major facilities with environmental interests located in this zip code:
LOCKHEED MARTIN ELECTRO OPTICAL (600 EAST BONITA AVENUE in POMONA, CA)
STATE MASTER (California - Hazardous Waste Tracking) - HAZARDOU WASTE PROGRAM CRITERIA AND HAZARDOUS AIR POLLUTANT INVENTORY (Inventory of air pollution sources) HAZARDOUS WASTE BIENNIAL REPORTER (Resource Conservation and Recovery Act (tracking hazardous waste)) Small Quantity Generators, between 100 kg and 1000 kg of hazardous waste/month (Resource Conservation and Recovery Act (tracking hazardous waste)) TRI REPORTER (Tracking of toxic chemicals releasing facilities) Business SIC classification: ELECTRONIC COMPONENTS Business NAICS classification: PRINTED CIRCUIT ASSEMBLY (ELECTRONIC ASSEMBLY) MANUFACTURING.; OTHER ELECTRONIC COMPONENT MANUFACTURING. Organizations: BAE SYSTEMS (CONTACT/OPERATOR)
, ORTON DEVELOPMENT (CONTACT/OWNER)
Alternative names: BAE SYSTEMS, LORAL ELECTRO OPTICAL SYSTEMS
A FREDDS AUTO REPAIR (393 N EASTEND AVE in POMONA, CA)
STATE MASTER (California - Hazardous Waste Tracking) - HAZARDOU WASTE PROGRAM Small Quantity Generators, between 100 kg and 1000 kg of hazardous waste/month (Resource Conservation and Recovery Act (tracking hazardous waste)) - notification Organizations: ALFRED ALVAREZ (CONTACT/OWNER)
ADAMS RITE MANUFACTURING (260 SANTA FE ST in POMONA, CA)
STATE MASTER (California - Hazardous Waste Tracking) - HAZARDOU WASTE PROGRAM Small Quantity Generators, between 100 kg and 1000 kg of hazardous waste/month (Resource Conservation and Recovery Act (tracking hazardous waste)) - notification Organizations: PETE ADAMS (CONTACT/OWNER)
ALLEN'S AUTO BODY (245 E HOLT AVE in POMONA, CA) . Federal Facility
STATE MASTER (California - Hazardous Waste Tracking) - HAZARDOU WASTE PROGRAM Small Quantity Generators, between 100 kg and 1000 kg of hazardous waste/month (Resource Conservation and Recovery Act (tracking hazardous waste)) - notification Organizations: ALLEN RUPERT (CONTACT/OWNER)
Alternative names: A AND D AUTO BODY
H AND H MFG (661 E MONTEREY AVE in POMONA, CA)
STATE MASTER (California - Hazardous Waste Tracking) - HAZARDOU WASTE PROGRAM Small Quantity Generators, between 100 kg and 1000 kg of hazardous waste/month (Resource Conservation and Recovery Act (tracking hazardous waste)) - notification Organizations: JERRY C HOLLAND (CONTACT/OWNER)
Alternative names: HOLLAND & HERRING MFG
FRANTZ CLEANERS (1490 N GAREY AVE in POMONA, CA)
STATE MASTER (California - Hazardous Waste Tracking) - HAZARDOU WASTE PROGRAM Small Quantity Generators, between 100 kg and 1000 kg of hazardous waste/month (Resource Conservation and Recovery Act (tracking hazardous waste))
GAREY AVE AUTO SVC (2093 N GAREY AVE in POMONA, CA)
STATE MASTER (California - Hazardous Waste Tracking) - HAZARDOU WASTE PROGRAM Small Quantity Generators, between 100 kg and 1000 kg of hazardous waste/month (Resource Conservation and Recovery Act (tracking hazardous waste)) - notification Organizations: TONY NASSAR (CONTACT/OWNER)
CHEVRON STATION 99527 (1515 N GAREY AVE in POMONA, CA)
STATE MASTER (California - Hazardous Waste Tracking) - HAZARDOU WASTE PROGRAM Small Quantity Generators, between 100 kg and 1000 kg of hazardous waste/month (Resource Conservation and Recovery Act (tracking hazardous waste)) - notification Organizations: CHEVRON U S A PRODUCTS CO (CONTACT/OWNER)
ALLISON ELEMENTARY (1011 RUSSELL PL. in POMONA, CA)
(National Center for Education Statistics) - STATE ID-6021794 Organizations: POMONA UNIFIED (SCHOOL DISTRICT)
EMERSON MIDDLE (635 LINCOLN AVE. in POMONA, CA)
(National Center for Education Statistics) - STATE ID-6058507 Organizations: POMONA UNIFIED (SCHOOL DISTRICT)
HARRISON ELEMENTARY (425 E. HARRISON AVE. in POMONA, CA)
(National Center for Education Statistics) - STATE ID-6021851 Organizations: POMONA UNIFIED (SCHOOL DISTRICT)
KINGSLEY ELEMENTARY (1170 WASHINGTON ST. in POMONA, CA)
(National Center for Education Statistics) - STATE ID-6021877 Organizations: POMONA UNIFIED (SCHOOL DISTRICT)
BARFIELD (C. JOSEPH) ELEMENTARY (2181 N. SAN ANTONIO AVE. in POMONA, CA)
(National Center for Education Statistics) - STATE ID-6021927 Organizations: POMONA UNIFIED (SCHOOL DISTRICT)
Housing units lacking complete plumbing facilities: 0.5% Housing units lacking complete kitchen facilities: 1.3%
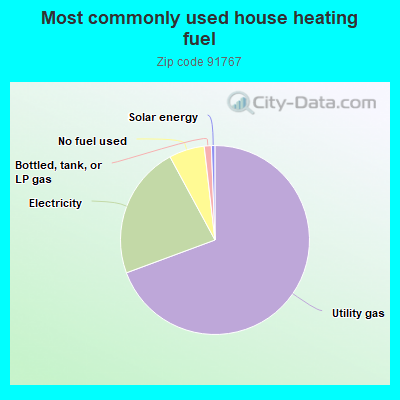
68.6%Utility gas
22.5%Electricity
6.0%No fuel used
1.2%Bottled, tank, or LP gas
0.6%Solar energy
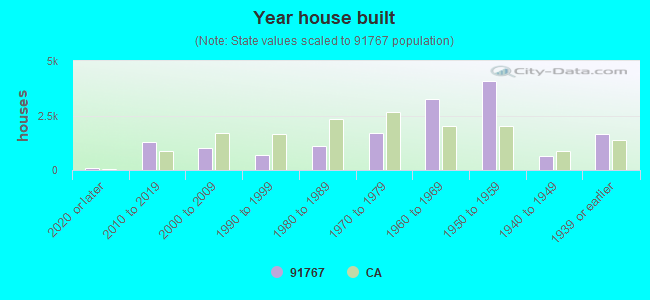
Population in 1990: 41,420. Population change in the 1990s: +5,194 (+12.5%).
Place of birth for U.S.-born residents:
This state: 31,506
Northeast: 796
Midwest: 931
South: 1,393
West: 1,011
52% of the 91767 zip code residents lived in the same house 5 years ago. Out of people who lived in different houses, 76% lived in this county. Out of people who lived in different counties, 50% lived in California.
93% of the 91767 zip code residents lived in the same house 1 year ago. Out of people who lived in different houses, 54% moved from this county. Out of people who lived in different houses, 35% moved from different county within same state. Out of people who lived in different houses, 10% moved from different state. Out of people who lived in different houses, 2% moved from abroad.
Private vs. public school enrollment:
Students in private schools in grades 1 to 8 (elementary and middle school): 521
Here:
10.5%
California:
10.5%
Students in private schools in grades 9 to 12 (high school): 85
Here:
2.8%
California:
8.5%
Students in private undergraduate colleges: 454
Here:
12.9%
California:
15.9%
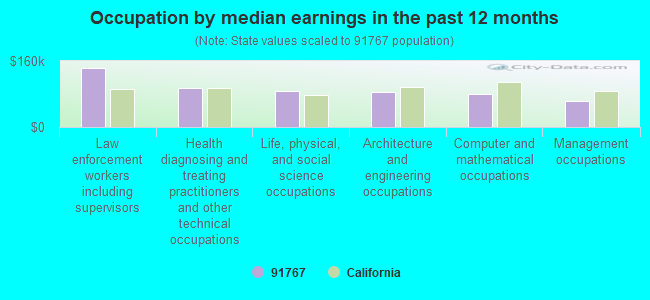
Occupation by median earnings in the past 12 months ($)
142,692Law enforcement workers including supervisors
94,993Health diagnosing and treating practitioners and other technical occupations
87,732Life, physical, and social science occupations
85,478Architecture and engineering occupations
80,905Computer and mathematical occupations
63,526Management occupations
Companies with biggest federal contracts located in this zip code (POMONA, CA):
LOCKHEED MARTIN CORPORATION (600 E BONITA AVENUE) : $27,772,707 in 25 contractsfrom 1999 to 2006
Contracts for Electric Lamps, Training Aids, Optical Instruments, Test Equipment, Components and Accessories, Armament Training Devices, and moreby Defense Logistics Agency, Navy Signed by year:2000: $10,600,440; 2001: $7,208,672; 2002: $0; 2003: $0; 2004: $1,569,250; 2005: $6,063,195; 2006: $1,595,875.
Biggest contracts:
$4,829,160 with Defense Logistics Agency for Electric Lamps. Signed on 2001-09-27. Completion date: 2003-05-20.
$3,569,268, same as above.Signed on 2000-09-06. Completion date: 2001-02-05.
$2,565,000 with Navy for Training Aids. Signed on 2000-02-28. Completion date: 2000-09-30.
$2,379,512 with Defense Logistics Agency for Electric Lamps. Signed on 2001-03-30. Completion date: 2001-03-30.
GENERAL NUCLEONICS INC (2807 METROPOLITAN PL; small business) : $21,682,569 in 113 contractsfrom 1999 to 2006
Contracts for Engine Instruments, Helicopter Rotor Blades, Drive Mechanisms and Components, Hazard-Detecting Instruments and Apparatus, Maintenance, Repair and Rebuilding of Equipment -- Aircraft and Airframe Structural Components, and moreby Navy, Air Force, Defense Logistics Agency Signed by year:2000: $2,797,567; 2001: $2,657,153; 2002: $2,452,121; 2003: $4,570,431; 2004: $3,902,669; 2005: $2,376,859; 2006: $1,812,602.
Biggest contracts:
$1,471,240 with Navy for Engine Instruments. Signed on 2004-10-29. Completion date: 2005-10-31.
$1,309,688, same as above.Signed on 2000-10-26. Completion date: 2001-01-31.
$1,290,210, same as above.Signed on 2003-10-22. Completion date: 2004-01-30.
$1,219,026, same as above.Signed on 2003-03-17. Completion date: 2003-06-30.
MAPEX CO (2516 SUPPLY ST; small business) : $1,663,834 in 41 contractsfrom 2001 to 2006
Contracts for Guns, through 30 mm, Electric Portable and Hand Lighting Equipment, Miscellaneous Electric Power and Distribution Equipment, Connectors, Electrical, and moreby Defense Logistics Agency, Army Signed by year:2000: $0; 2001: $184,414; 2002: $178,950; 2003: $251,168; 2004: $713,057; 2005: $232,340; 2006: $103,905.
Biggest contracts:
$330,403 with Defense Logistics Agency for Guns, through 30 mm. Signed on 2004-09-15. Completion date: 2005-08-02.
$85,225 with Defense Logistics Agency for Electric Portable and Hand Lighting Equipment. Signed on 2005-01-20. Completion date: 2005-05-29.
$83,600 with Defense Logistics Agency for Guns, through 30 mm. Signed on 2004-04-28. Completion date: 2004-05-13.
$79,950, same as above.Signed on 2003-11-17. Completion date: 2004-03-01.
MUSE MEASUREMENTS CORP (2532 SUPPLY) : $1,166,210 in 4 contractsfrom 2003 to 2006
$398,720 with Navy for Miscellaneous Communication Equipment. Taking place in LA. Signed on 2004-12-08. Completion date: 2005-12-08.
$327,500, same as above.Signed on 2003-07-11. Completion date: 2004-02-06.
$237,490 with Navy for Aircraft Air Conditioning, Heating, and Pressurizing Equipment. Taking place in LA. Signed on 2006-05-11. Completion date: 2007-05-05.
$202,500 with Navy for Antennas, Waveguides, and Related Equipment. Taking place in LA. Signed on 2004-04-07. Completion date: 2005-04-07.
ANALYTICAL INDUSTRIES INC (2855 METROPOLITIAN PLACE; small business) : $806,790 in 11 contractsfrom 1999 to 2006
Contracts for Hazard-Detecting Instruments and Apparatus by Navy Signed by year:2000: $72,983; 2001: $154,887; 2002: $284,230; 2003: $0; 2004: $0; 2005: $101,575; 2006: $144,286.
Biggest contracts:
$104,396 with Navy for Hazard-Detecting Instruments and Apparatus. Signed on 2002-09-10. Completion date: 2003-01-08.
$101,575, same as above.Signed on 2005-01-21. Completion date: 2005-04-30.
$96,971, same as above.Signed on 2002-04-30. Completion date: 2002-07-30.
$95,550, same as above.Signed on 2001-10-17. Completion date: 2001-11-16.
NMC GROUPINC (2755 THOMPSON CREEK ROAD; small business) : $103,041 in 3 contractsfrom 2000 to 2002
$43,953 with Defense Logistics Agency for Airframe Structural Components. Signed on 2001-12-10. Completion date: 2002-04-19.
$33,313, same as above.Signed on 2002-09-03. Completion date: 2002-12-22.
$25,775, same as above.Signed on 2000-06-19. Completion date: 2000-10-17.
AIR/FLEX INDUSTRIES INC (2538 SUPPLY ST; small business) : $95,545 in 20 contractsfrom 2004 to 2006
Contracts for Electrical Hardware and Supplies by Defense Logistics Agency Signed by year:2000: $0; 2001: $0; 2002: $0; 2003: $0; 2004: $27,907; 2005: $42,602; 2006: $25,036.
Biggest contracts:
$14,700 with Defense Logistics Agency for Electrical Hardware and Supplies. Signed on 2004-04-26. Completion date: 2004-07-25.
$10,595, same as above.Signed on 2005-11-10. Completion date: 2005-12-10.
$7,488, same as above.Signed on 2005-03-12. Completion date: 2005-04-14.
$5,577, same as above.Signed on 2006-06-01. Completion date: 2006-07-16.
EVERETT CHARLES TECHNOLOGIES I (700 E HARRISON AVE) : $82,677 in 2 contractsfrom 2000 to 2005
$50,657 with Air Force for Cable, Cord, and Wire Assemblies: Communications Equipment. Signed on 2005-09-30. Completion date: 2005-11-30.
$32,020 with Air Force for Aircraft Maintenance and Repair Shop Specialized Equipment. Taking place in RI. Signed on 2000-02-02. Completion date: 2000-06-30.
COMRENT WEST, INC (250 CLARK AVE; small business) : $51,904 in 4 contractsin 2006
$21,843 with Navy for Miscellaneous Electric Power and Distribution Equipment. Signed on 2006-03-08. Completion date: 2006-04-17.
$21,145, same as above.Signed on 2006-04-19. Completion date: 2006-04-17.
$14,672, same as above.Signed on 2006-06-19. Completion date: 2006-04-17.
-$5,756, same as above.Signed on 2006-03-21. Completion date: 2006-04-17.
SILPAK INC (470 E BONITA AVE; small business) : $28,822 in 10 contractsfrom 2003 to 2005
Contracts for Adhesives, Plastics Fabricated Materials by Army Signed by year:2000: $0; 2001: $0; 2002: $0; 2003: $7,121; 2004: $10,707; 2005: $10,994; 2006: $0.
Biggest contracts:
$3,697 with Army for Adhesives. Taking place in GA. Signed on 2005-04-28. Completion date: 2005-05-18.
$3,677 with Army for Adhesives. Signed on 2005-02-10. Completion date: 2005-02-25.
$3,620 with Army for Adhesives. Taking place in GA. Signed on 2005-09-21. Completion date: 2005-10-31.
$3,580 with Army for Adhesives. Signed on 2004-11-05. Completion date: 2004-11-15.
Top industries in this zip code by the number of employees in 2005:
Health Care and Social Assistance: General Medical and Surgical Hospitals (over 1000 employees: 1 establishment)
Wholesale Trade: Motor Vehicle Supplies and New Parts Merchant Wholesalers (500-999: 1, 100-249: 1, 10-19: 1, 5-9: 1, 1-4: 3)


 Nearest zip codes: 91763, 91766, 91711, 91768, 91762, 91773.